Sustainable Catering Services Market Size and Share
Market Overview
| Study Period | 2020 - 2031 |
|---|---|
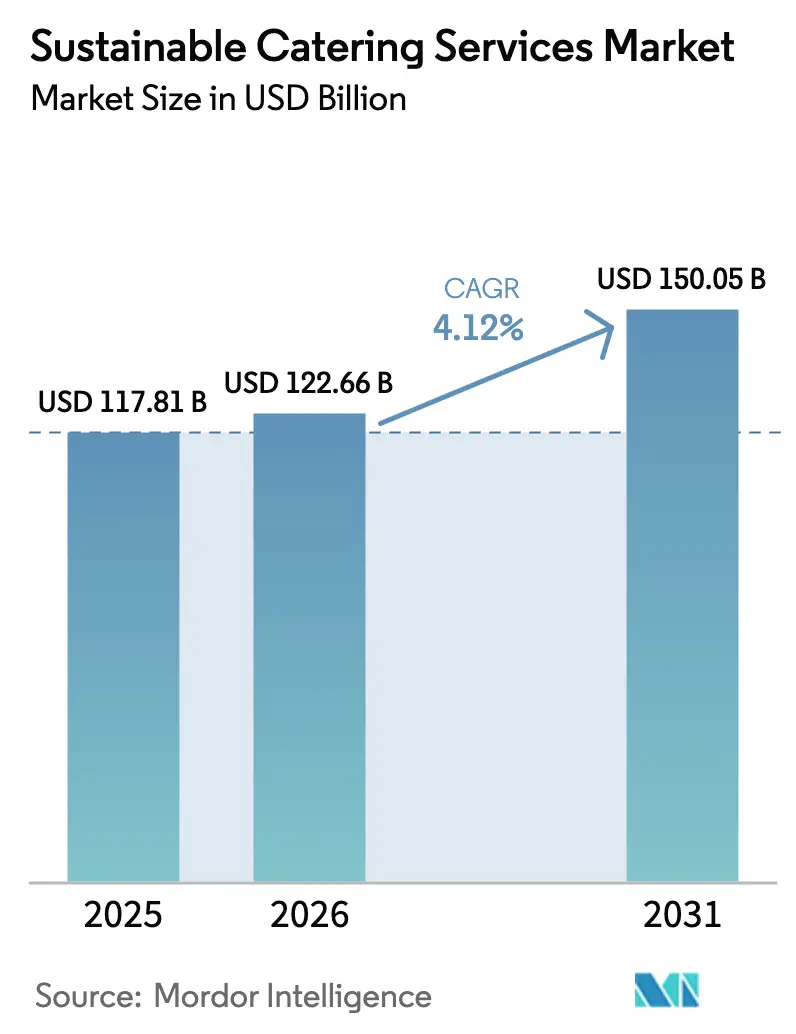
| Market Size (2026) | USD 122.66 Billion |
| Market Size (2031) | USD 150.05 Billion |
| Growth Rate (2026 - 2031) | 4.12% CAGR |
| Fastest Growing Market | Asia Pacific |
| Largest Market | North America |
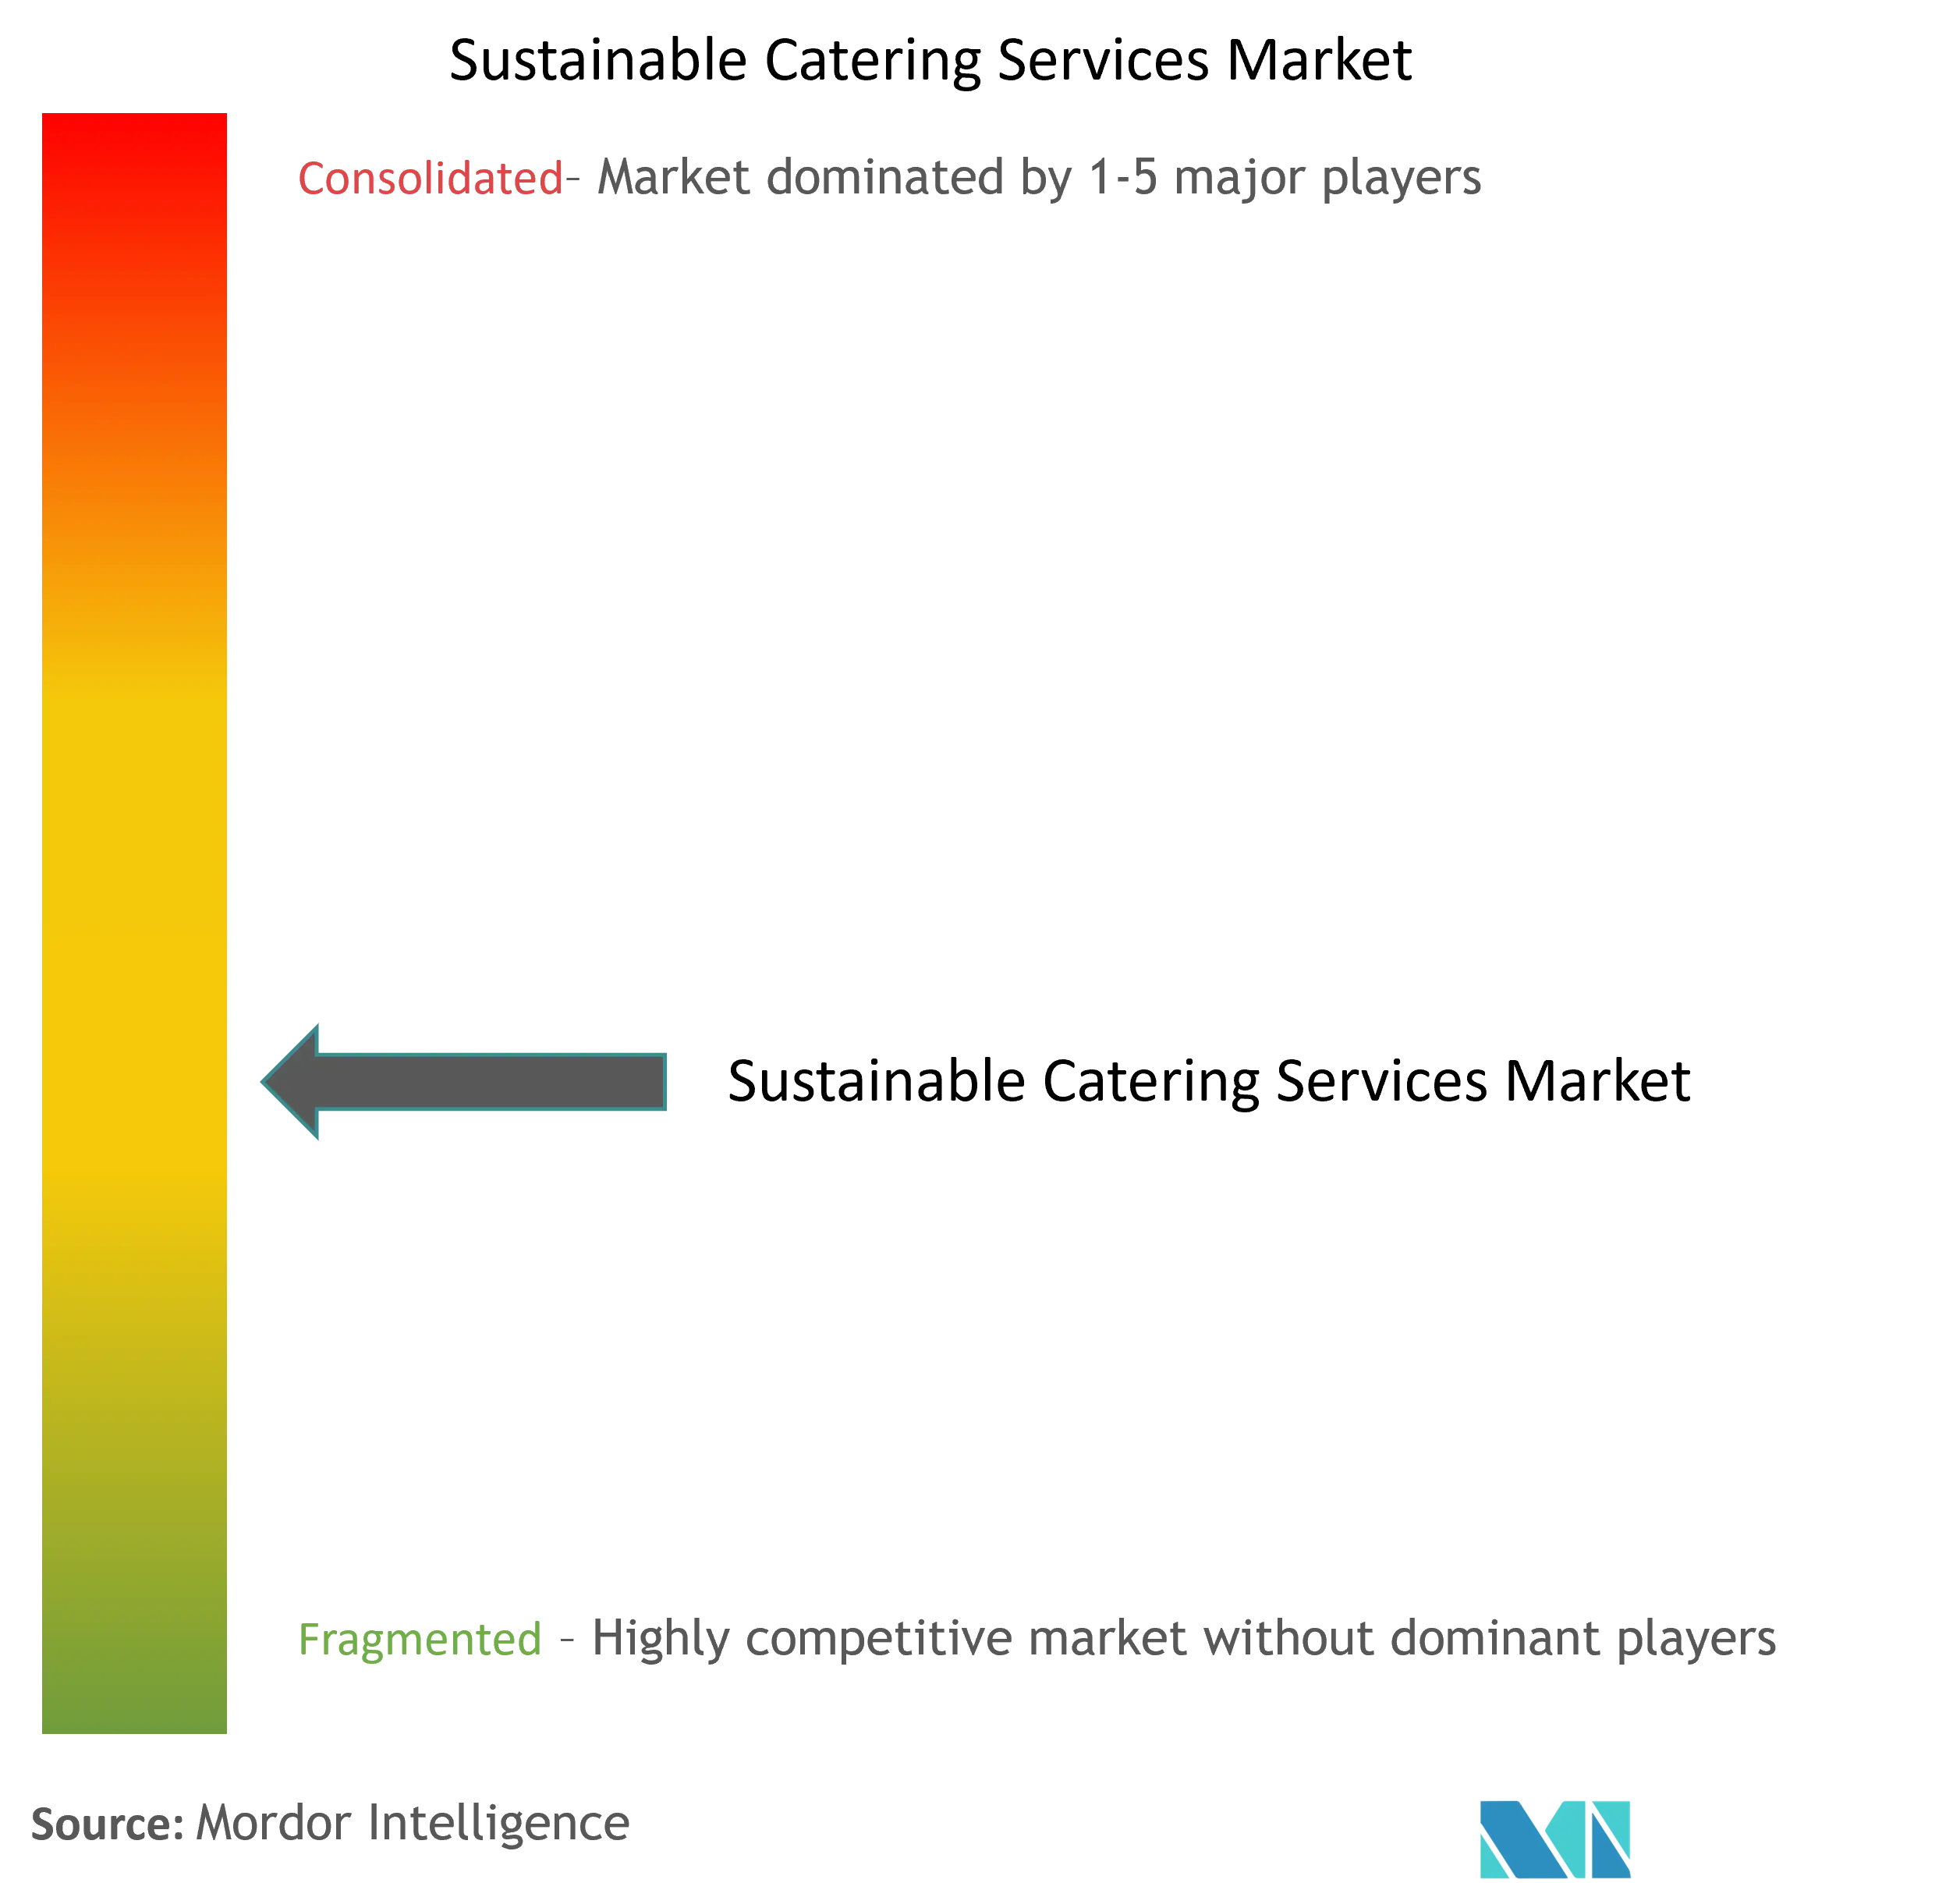
| Market Concentration | Medium |
Major Players *Disclaimer: Major Players sorted in no particular order Image © Mordor Intelligence. Reuse requires attribution under CC BY 4.0. | |
Sustainable Catering Services Market Analysis by Mordor Intelligence
The sustainable catering services market size in 2026 is estimated at USD 122.66 billion, growing from 2025 value of USD 117.81 billion with 2031 projections showing USD 150.05 billion, growing at 4.12% CAGR over 2026-2031. Clients now treat environmental performance as a core purchasing criterion, and digital kitchen platforms that measure waste and carbon output have moved from optional extras to standard features. Europe leads the sustainable catering services market with a 31.35% slice in 2024, supported by strict food-system regulations and consumer preference for transparent sourcing. Middle East and Africa deliver the fastest growth at a 5.6% CAGR as new tourism assets and corporate campuses specify low-carbon dining. Full-service catering retains volume leadership, yet self-sufficient Mobile / Food-Truck units accelerate at 6.7% CAGR because they combine flexible deployment with renewable power systems. Reusable serviceware is expanding as city bans on single-use disposables take effect, while rising demand for plant-based menus underpins the sustainable catering services market as an integral part of corporate net-zero strategies.
Key Report Takeaways
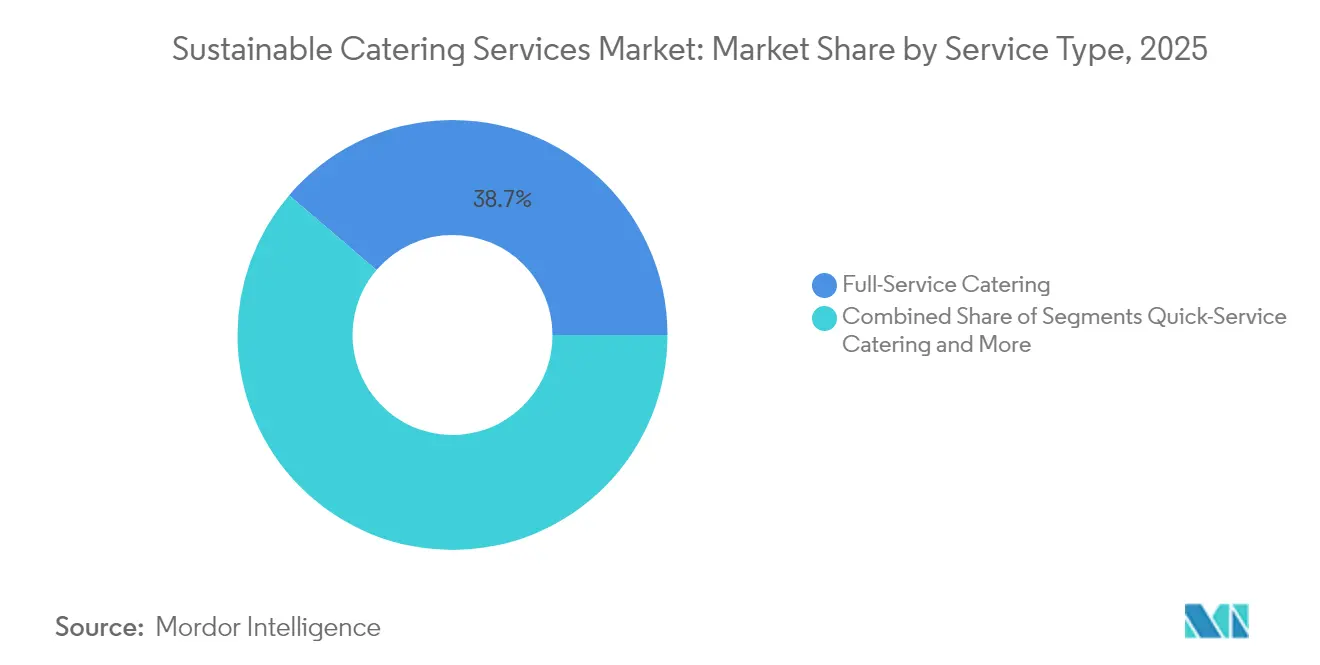
- By service type, full-service catering held 38.74% of sustainable catering services market share in 2025; Mobile / food-truck catering is poised to grow at a 6.42% CAGR through 2031.
- By contract type, Contract catering accounted for 62.88% of the sustainable catering services market size in 2025, while self-operated formats are forecast to expand at a 5.21% CAGR.
- By end user, Corporate and band represented 34.72% of the sustainable catering services market size in 2025; Industrial and remote sites record the quickest 5.88% CAGR to 2031.
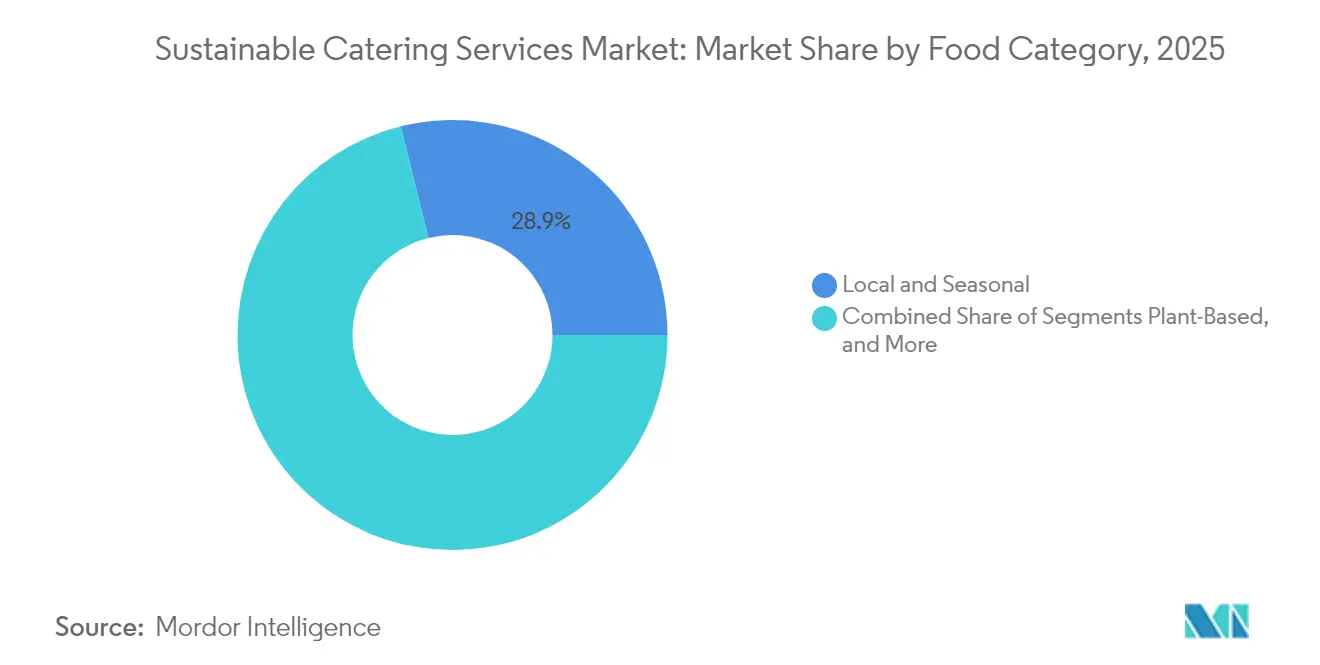
- By food category, local and seasonal procurement commanded 28.86% of sustainable catering services market share in 2025, and plant-based / vegan menus advance at a 9.12% CAGR.
- Compass Group, Sodexo, Aramark, Elior Group, and ISS A/S together controlled significant market share of sustainable catering services in 2025.
Note: Market size and forecast figures in this report are generated using Mordor Intelligence’s proprietary estimation framework, updated with the latest available data and insights as of 2026.
Global Sustainable Catering Services Market Trends and Insights
Drivers Impact Analysis*
| Driver | (~)% Impact on CAGR Forecast | Geographic Relevance | Impact Timeline |
|---|---|---|---|
| Growing Demand for Customized and Healthy Food Options | +1.2% | Global, with higher impact in North America and Europe | Medium term (2-4 years) |
| Focus on Sustainability and Ethical Sourcing Practices | +1.5% | Global, with early adoption in Europe | Long term (≥ 4 years) |
| Technological Innovations in Food Service Management | +0.8% | North America, Europe, Asia-Pacific | Medium term (2-4 years) |
| Increased Corporate and Institutional Demand for Sustainable Practices | +1.1% | Global, with higher impact in developed economies | Medium term (2-4 years) |
| Consumer Willingness to Pay a Premium for Sustainable Offerings | +0.7% | Europe, North America, Urban centers in Asia-Pacific | Short term (≤ 2 years) |
| Source: Mordor Intelligence | |||
Growing Demand for Customized and Healthy Food Options
Personalized nutrition reshapes the sustainable catering services market. Datasets drawn from point-of-sale systems help caterers design meals that address dietary goals while trimming embodied carbon. Universities and corporate offices insist on nutrient profiling that meets USDA guidance. Menu engineering with functional ingredients strengthens diner satisfaction and validates fee premiums.
Focus on Sustainability and Ethical Sourcing Practices
Clients require hard proof of eco-responsible supply chains. Blockchain tracking shows provenance, and the European Farm-to-Fork Strategy pushes organic inputs with tough waste-cutting targets. Providers answer with renewable energy kitchens, zero-waste prep protocols, and carbon-neutral delivery fleets that reinforce trust across the sustainable catering services market.
Technological Innovations in Food Service Management
AI scheduling platforms raise equipment uptime and lower energy bills, while IoT sensors report real-time data to ENERGY STAR dashboards. Refrigerator optimization alone can cut electricity use by double digits, proving that technology is central to scaling the sustainable catering services market.
Increased Corporate and Institutional Demand for Sustainable Practices
Ninety percent of purchasing departments now include emissions clauses. The U.S. General Services Administration embeds sustainability scoring in food-service tenders, creating both compliance pressure and growth headroom for the sustainable catering services market. Vendors supply verified Scope 3 data and deliver plant-forward menus that align with science-based targets.
Restraints Impact Analysis*
| Restraint | (~) % Impact on CAGR Forecast | Geographic Relevance | Impact Timeline |
|---|---|---|---|
| Economic Uncertainty and Budget Constraints | -0.7% | Global, with higher impact in emerging markets | Short term (≤ 2 years) |
| Labor Shortages and Recruitment Challenges | -0.5% | North America, Europe, Australia | Medium term (2-4 years) |
| Stringent Health and Safety Regulations | -0.3% | Global, with higher impact in developed economies | Medium term (2-4 years) |
| Fluctuating Food Costs and Supply Chain Disruptions | -0.8% | Global | Short term (≤ 2 years) |
| Source: Mordor Intelligence | |||
Economic Uncertainty and Budget Constraints
Inflation squeezes catering budgets and can deter upgrades to biodegradable ware and premium produce. Operators respond with total-cost models that show waste savings offsetting upfront premiums. Economic volatility is creating significant headwinds for sustainable catering services, with inflationary pressures forcing clients to scrutinize expenditures more closely and potentially defer investments in premium sustainable options. The cost premiums often associated with sustainable ingredients, packaging, and operational practices become challenging decision points during periods of budget constraint, potentially slowing adoption rates in price-sensitive market segments. Corporate catering budgets remain vulnerable to macroeconomic fluctuations, despite showing signs of recovery in certain sectors and regions.
Labor Shortages and Recruitment Challenges
The sustainable catering industry faces persistent workforce challenges, with labor shortages constraining growth and innovation across multiple market segments and geographic regions. The specialized skills required for sustainable food preparation, including knowledge of plant-based cooking techniques, waste reduction practices, and sustainable sourcing protocols, create additional recruitment hurdles beyond those facing the broader food service industry. Training and retention costs are escalating as companies compete for limited talent pools, with operators reporting significant wage increases to attract and retain skilled staff capable of executing comprehensive sustainability programs.
*Our forecasts treat driver/restraint impacts as directional, not additive. The impact forecasts reflect baseline growth, mix effects, and variable interactions.
Segment Analysis
By Service Type: Full-Service Leadership with Mobile Innovation
Full-Service Catering captured 38.74% of 2025 revenue. It integrates purchasing volume, onsite staffing, and data dashboards that benchmark carbon per plate, a combination that cements its role in the sustainable catering services market. Efforts focus on portion control, ingredient swaps, and biowaste digester installation to meet corporate ESG scorecards.
Mobile / Food-Truck Catering grows 6.42% annually by pairing solar rooftops with compact induction cooktops. Vendors can station fleets at festivals, logistics hubs, and construction sites, broadening geographic reach for the sustainable catering services market. Digital ordering apps slot into corporate meal subsidies, keeping service agile while capturing waste data for reporting. Quick-Service/Drop-Off Catering continues to serve time-sensitive clients with streamlined operations that prioritize efficiency and convenience, while Buffet and Plated Meal Services maintain their appeal for formal events despite facing sustainability challenges related to food waste management and portion control. The integration of digital technologies is transforming service delivery across all segments, with mobile ordering applications and artificial intelligence-driven logistics enhancing operational efficiency while reducing carbon emissions through optimized routing and delivery scheduling.


By Contract Type: Traditional Dominance with Self-Operation Growth
Contract Catering controlled 62.88% of turnover in 2025 due to scale benefits and standardized audit frameworks. Sustainability clauses in master agreements drive near-term menu overhauls that reinforce the sustainable catering services market.
Self-operated kitchens expand at 5.21% CAGR as hospitals and schools seek direct control over sourcing standards. Cloud menu planning tools grant these smaller teams enterprise-grade insights, nudging more cafeterias into the sustainable catering services market. This growth trend is particularly evident in sectors with specialized requirements, such as healthcare facilities requiring specific nutritional protocols and educational institutions implementing comprehensive sustainability education programs. Short-Term Event Contracts continue to serve the events industry with specialized offerings tailored to specific occasions and venues, while Long-Term Facilities Contracts provide operational stability for caterers serving corporate clients and institutional facilities with ongoing food service requirements.
By End User: Corporate Leadership with Industrial Expansion
Corporate and BandI held 34.72% of 2025 spend. Return-to-office policies center on healthy meals that encourage collaboration and signal employer commitment to climate goals, sustaining demand in the sustainable catering services market. Real-time feedback apps help facilities teams adjust menus and flag allergens.
Industrial and Remote locations gain 5.88% CAGR because resource companies compete for skilled labor in isolated areas. Caterers deploy modular kitchens with closed-loop water and renewable generators, bringing off-grid sites inside the sustainable catering services market.
By Food Category: Local Sourcing Dominance with Plant-Based Momentum
Local and Seasonal Procurement took 28.86% share in 2025 and remains a cornerstone of the sustainable catering services market. Short supply chains cut transport miles and build community resilience.
Plant-based / vegan menus rise 9.12% CAGR, reflecting shifting consumer preferences toward environmentally conscious dining options and growing awareness of the environmental impact of animal agriculture on climate change and resource utilization.. Menu carbon labels and protein innovation drive mainstream uptake, adding incremental growth to the sustainable catering services market. Organic and Biodynamic Ingredients continue to appeal to health-conscious consumers and institutions seeking to minimize exposure to synthetic pesticides and fertilizers while supporting regenerative agricultural practices.
By Packaging and Service-ware: Compostable Leadership with Reusable Growth
Compostable / Biodegradable units comprised 46.12% of spend in 2025, offering familiarity while easing landfill pressure. City bans advance reuse systems, and RFID-tagged bowls cycle through dish-wash hubs that scale across the sustainable catering services market.
Reusable service-ware gains 7.46% CAGR, driven by regulatory pressure from municipal waste reduction ordinances and growing institutional awareness of the long-term economic and environmental benefits of reusable systems. Recycled Content Packaging continues to evolve with innovations in material science and manufacturing processes, offering improved performance characteristics while maintaining environmental benefits through reduced virgin material consumption and waste stream diversion.
Geography Analysis
Europe accounts for 31.02% of global revenue in 2025. Mandatory waste-sorting schemes and compost infrastructure underpin adoption. United Kingdom canteens display carbon labels, while German contracts require renewable power kitchens after Compass Group acquired Hofmann’s. Regional alliances among event venues and caterers streamline zero-waste protocols, strengthening the sustainable catering services market.
North America shows strong adoption. U.S. corporates invest in AI-driven waste logs, and 48% of restaurants offer vegan dishes. Canada subsidizes electric kitchen retrofits and local procurement programs, broadening the sustainable catering services market. Mexico leverages tourism corridors to pilot reusable cup networks.
The Middle East and Africa posts the fastest 5.37% CAGR. Airports, expo centers, and new hotels integrate smart buffets that downscale portions via occupancy sensors, expanding the sustainable catering services market across the region. South African mining camps adopt solar chillers to protect cold chains while lowering diesel use.
Asia-Pacific grows as China and India urbanize. Japan pioneers robotics that cut kitchen labor, and Australia pushes supply contracts that favor regenerative farms. South Korea’s municipal policies on single-use plastics accelerate reusable container adoption. South America builds on its farm-to-table heritage to embed local sourcing in the sustainable catering services market.


Competitive Landscape
The sustainable catering services market is moderately concentrated. Compass Group deploys mergers to sharpen sector specialism, adding boutique firms that excel in low-carbon event cuisine. Sodexo explores absorbing Aramark to widen geographic footprint and tech stack. Aramark pilots AI menu generators that balance nutrition with emissions. Elior and ISS invest in smart vending and pantry refill services.
Startups fill white spaces such as carbon-neutral pop-up kitchens and hyper-local sourcing networks. Tech alliances integrate IoT, traceability ledgers, and demand forecasting that lift service quality across the sustainable catering services market. Emerging disruptors include technology-focused startups offering artificial intelligence-driven menu planning and food waste reduction platforms, as well as specialized sustainable caterers with vertically integrated supply chains that ensure environmental control and quality assurance from farm to table. Technology adoption is accelerating across the industry, with enterprise-level caterers investing in advanced order management systems, delivery optimization platforms, and customer engagement applications that enhance operational efficiency while providing detailed sustainability performance data to clients seeking to meet their own environmental objectives.
Sustainable Catering Services Industry Leaders
Compass Group PLC
Sodexo SA
Aramark Corporation
Elior Group
ISS A/S
- *Disclaimer: Major Players sorted in no particular order

Recent Industry Developments
- April 2025: Sodexo announced a potential acquisition with Aramark aimed at building a global powerhouse in the sustainable catering services market.
- March 2025: Remote Site Solutions widened African catering coverage with solar-powered commissaries.
- January 2025: Earth Hotels outlined property launches in Saudi Arabia and Europe featuring community food halls powered by renewable energy.


Research Methodology Framework and Report Scope
Market Definitions and Key Coverage
Our study treats the sustainable catering services market as the aggregate revenue earned by professional caterers that consciously minimize food waste, cut greenhouse-gas emissions, favor locally sourced and seasonal produce, and adopt reusable or compostable service-ware across institutional, corporate, social-event, and in-flight settings.
Scope exclusion: retail meal-kits, home meal delivery apps, and disposable packaging suppliers sit outside this definition.
Segmentation Overview
- By Service Type
- Full-Service Catering
- Quick-Service / Drop-Off Catering
- Mobile / Food-Truck Catering
- Buffet & Plated Meal Services
- Boxed / Grab-and-Go Lunches
- By Contract Type
- Contract Catering
- Self-Operated / Non-Contract
- Short-Term Event Contracts
- Long-Term Facilities Contracts
- By End User
- Corporate & Business & Industry (B&I)
- Education (K-12 & Universities)
- Healthcare & Senior Living
- Industrial & Remote (Mining, Oil & Gas, Offshore Wind)
- Hospitality, Sports & Leisure Venues
- Government & Military
- Social & Private Events
- By Food Category
- Plant-Based / Vegan Menus
- Organic & Biodynamic Ingredients
- Local & Seasonal Procurement
- Fair-Trade & Ethically-Sourced Products
- Low-Carbon / Climate-Smart Menus
- By Packaging & Service-ware
- Reusable Service-ware
- Biodegradable Packaging
- Recycled Content Packaging
- By Geography
- North America
- Canada
- United States
- Mexico
- Rest of North America
- South America
- Brazil
- Peru
- Chile
- Argentina
- Rest of South America
- Asia-Pacific
- India
- China
- Japan
- Australia
- South Korea
- South East Asia (Singapore, Malaysia, Thailand, Indonesia, Vietnam, Philippines)
- Rest of Asia-Pacific
- Europe
- United Kingdom
- Germany
- France
- Spain
- Italy
- BENELUX (Belgium, Netherlands, Luxembourg)
- NORDICS (Denmark, Finland, Iceland, Norway, Sweden)
- Rest of Europe
- Middle East & Africa
- United Arab Emirates
- Saudi Arabia
- South Africa
- Nigeria
- Rest of Middle East & Africa
Detailed Research Methodology and Data Validation
Primary Research
Interviewing regional food-service executives, procurement heads at hospitals and factories, and sustainability consultants lets us test menu-mix shifts, average spend per covered meal, and compost adoption rates. These conversations, spread across North America, Europe, and key Asia-Pacific economies, fill data gaps and ground our desk findings.
Desk Research
Mordor analysts first map the industry using open datasets such as Eurostat catering turnover, USDA food-away-from-home statistics, UN Comtrade trade codes for prepared meals, and UNEP Food Waste Index. We enrich those baselines with hospitality demand indicators released by the World Tourism Organization and employee head-count data from the International Labor Organization. Company filings, investor decks, and reputable press coverage then reveal pricing moves and contract wins. Select paid databases, D&B Hoovers for caterer financials and Dow Jones Factiva for deal tracking, add depth. This list is illustrative and not exhaustive; many additional sources inform our desk work.
Market-Sizing & Forecasting
We anchor the 2025 baseline through a top-down reconstruction of institutional meal volumes and social-event counts, which is then cross-checked with sampled average selling price × volume estimates gathered from supplier roll-ups. Key variables like corporate cafeteria penetration, share of organic ingredients, landfill diversion rates, energy prices, and regulatory fee trajectories feed the model. A multivariate regression, validated by interview consensus, generates five-year forecasts; where bottom-up inputs are thin, interpolation follows documented analogues before being stress-tested.
Data Validation & Update Cycle
Every model passes a two-step peer review, variance checks against third-party indicators, and anomaly flag resolution. Reports refresh annually, with mid-cycle revisions triggered by material regulations or mega mergers; a final analyst pass precedes delivery.
Why Mordor's Sustainable Catering Services Baseline Commands Reliability
Published estimates often diverge because each firm chooses a different service mix, contract horizon, and currency conversion date.
Key gap drivers include whether home meal-kits are counted, how aggressively plant-based menu uptake is projected, and if one-time wedding revenues are annualized. Mordor's scope aligns strictly with on-site and contract catering, uses transparent ASP progression, and benefits from a yearly refresh cadence that many studies lack.
Benchmark comparison
| Market Size | Anonymized source | Primary gap driver |
|---|---|---|
| USD 117.81 B (2025) | Mordor Intelligence | - |
| USD 149.10 B (2024) | Global Consultancy A | Adds meal-kit and venue hire revenue |
| USD 148.91 B (2024) | Trade Journal B | Assumes uniform global ASP without regional weighting |
These comparisons show that once differing scopes and price assumptions are stripped away, Mordor provides a balanced, verifiable baseline rooted in clearly tracked variables and repeatable steps.


Key Questions Answered in the Report
How big is the sustainable catering services Market?
The sustainable catering services market size is expected to reach USD 122.66 billion in 2026.
What is the projected value of the sustainable catering services market by 2031?
It is expected to reach USD 150.05 billion, rising from USD 117.81 billion in 2025.
Which region currently leads the sustainable catering services market?
Europe leads with 31.02% of global revenue in 2025 due to stringent regulations and high consumer awareness.
Which service type is expanding the fastest?
Mobile / food-truck catering is growing at a 6.42% CAGR between 2026 and 2031, driven by renewable energy units and flexible deployment.
Why are self-operated kitchens gaining momentum?
Organizations favor self-operation to align food sourcing and waste targets directly with internal ESG goals.
How significant is the plant-based segment within the sustainable catering services market?
Plant-based / vegan menus are advancing at a 9.12% CAGR, reflecting rising consumer demand for climate-conscious dining.
Page last updated on:


