Online Accommodation Booking Market Size and Share
Market Overview
| Study Period | 2020 - 2031 |
|---|---|
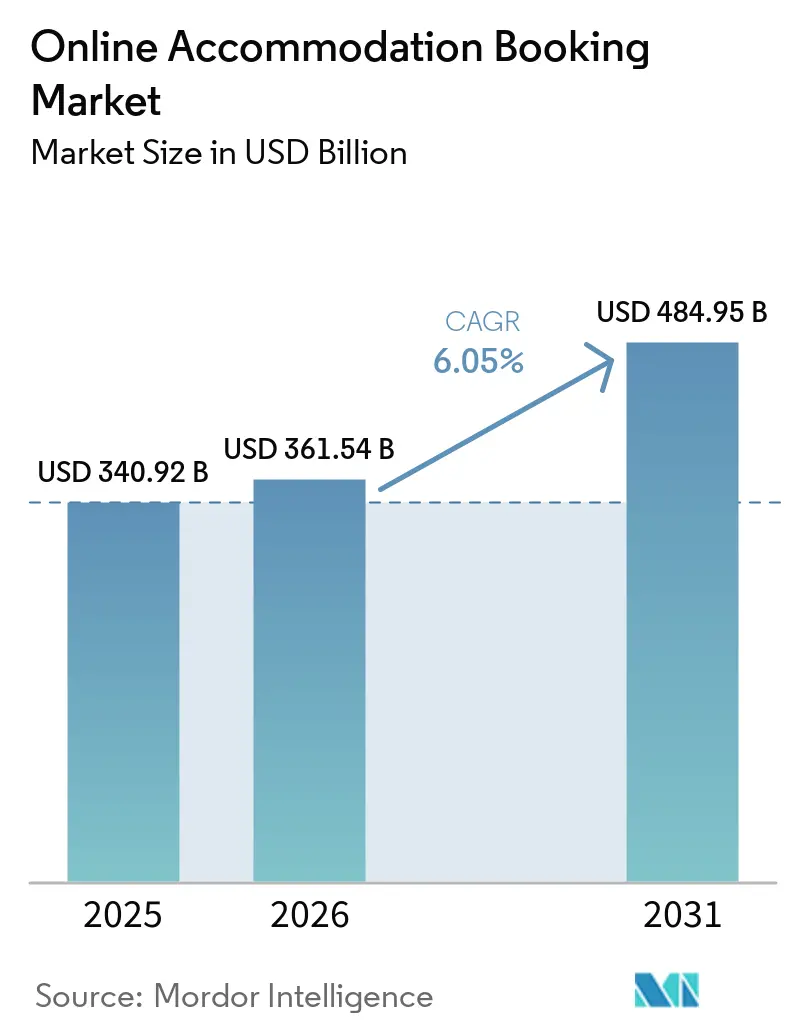
| Market Size (2026) | USD 361.54 Billion |
| Market Size (2031) | USD 484.95 Billion |
| Growth Rate (2026 - 2031) | 6.05% CAGR |
| Fastest Growing Market | Asia Pacific |
| Largest Market | North America |
| Market Concentration | Medium |
Major Players *Disclaimer: Major Players sorted in no particular order Image © Mordor Intelligence. Reuse requires attribution under CC BY 4.0. | |
Online Accommodation Booking Market Analysis by Mordor Intelligence
The online accommodation booking market size was valued at USD 340.92 billion in 2025 and estimated to grow from USD 361.54 billion in 2026 to reach USD 484.95 billion by 2031, at a CAGR of 6.05% during the forecast period (2026-2031). This expansion illustrates the sector’s ability to adapt to changing traveler behavior that increasingly favors real-time booking and friction-free digital journeys. Rising smartphone penetration, faster mobile networks, and intuitive interfaces are moving bookings away from desktops and toward mobile-first experiences that reduce search time and improve conversion rates. Operators are matching this shift with AI-driven personalization tools that analyze browsing history, trip intent, and contextual signals to surface relevant properties faster than manual filters can. Competitive intensity is prompting major platforms to build proprietary models that recommend entire itineraries instead of only listing rooms, thereby elevating the perceived value of an integrated trip planner. Simultaneously, supply-side partners are adopting dynamic pricing engines that synchronize with these AI systems to protect margins while keeping inventory visible across multiple channels.
Key Report Takeaways
- - By platform, mobile applications held 61.45% of the online accommodation booking market share in 2025, and their share is projected to widen as the segment advances at a 12.65% CAGR through 2031.
- - By mode of booking, third-party OTAs controlled 71.60% of the online accommodation booking market share 2025, whereas direct portals are on track to record a 12.2% CAGR to 2031.
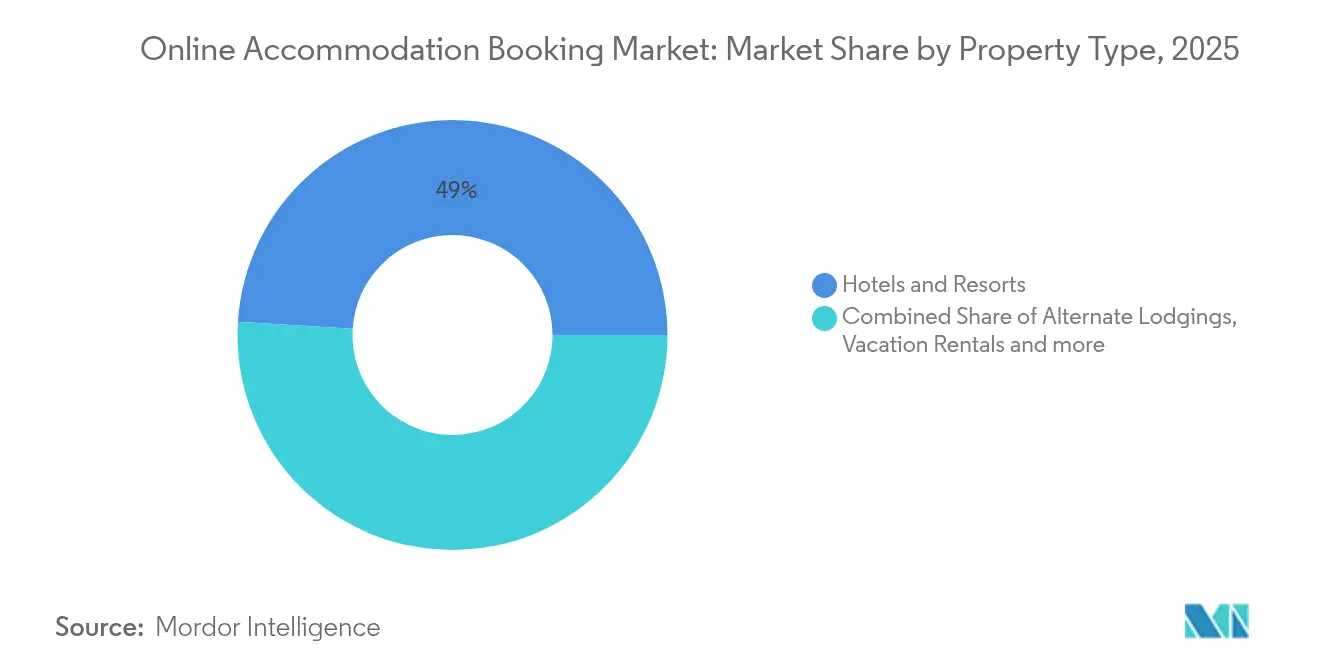
- - By property type, hotels and resorts captured 49.02% of the online accommodation booking market size in 2025, while alternative lodgings are accelerating at a 14.9% CAGR during the forecast period.
- - By geography, Europe accounted for 33.05% of the online accommodation booking market share in 2025; Asia-Pacific is expanding at a 12.1% CAGR, making it the fastest-growing region.
Note: Market size and forecast figures in this report are generated using Mordor Intelligence’s proprietary estimation framework, updated with the latest available data and insights as of 2026.
Global Online Accommodation Booking Market Trends and Insights
Drivers Impact Analysis*
| Driver | (~) % Impact on CAGR Forecast | Geographic Relevance | Impact Timeline |
|---|---|---|---|
| Rising mobile internet penetration | +2.1% | Global, strongest in Asia-Pacific and Middle East & Africa | Medium term (2–4 years) |
| Growing millennial and Gen-Z travel spend | +1.8% | North America and Europe first, Asia-Pacific catching up | Long term (≥ 4 years) |
| Expansion of low-cost carriers boosting short-haul trips | +1.4% | Asia-Pacific core, spill-over to South America | Short term (≤ 2 years) |
| AI-powered hyper-personalized search and recommendation engines | +1.2% | North America and Europe lead, Asia-Pacific adoption rising | Medium term (2–4 years) |
| ESG-driven preference for certified sustainable stays | +1.0% | Europe leads, growing traction in North America and Oceania | Long term (≥ 4 years) |
| AI-powered hyper-personalized search and recommendation engines | +1.2% | North America and Europe lead, Asia-Pacific adoption rising | Medium term (2–4 years) |
| Source: Mordor Intelligence | |||
Rising Mobile Internet Penetration
Rapid 5G rollout and lower data tariffs are fostering uninterrupted, high-speed browsing that supports full-funnel trip planning on handheld devices. Travelers are leveraging biometric logins, digital wallets, and one-click checkout flows that significantly shorten the booking path and reduce abandonment. Mobile channels already account for more than six out of every ten online reservations, and their share keeps climbing because broadband connectivity reaches new rural and peri-urban users every quarter. Hospitality brands are responding by embedding chatbots, AR-enabled room previews, and real-time inventory alerts through hotel and hospitality management software that capitalize on push-notification immediacy.[1]Source: Philip Barton, “Rebuilding Hotel Tech Stacks for the Agentic AI Era,” Hospitality Net, hospitalitynet.org. These upgrades collectively raise app engagement, session depth, and booking frequency, cementing mobile’s primacy in the customer journey. Providers unable to deliver seamless, low-latency mobile experiences risk marginalization as consumer expectations rise.
Growing Millennial & Gen-Z Travel Spend
Younger cohorts prioritize experience-rich travel over asset accumulation, and they value platforms that curate sustainable stays, authentic local touchpoints, and transparent pricing. Surveys conducted in 2024 showed that 41% of respondents wanted AI-generated itineraries tailored to personal interests, indicating demand for planning that goes beyond room selection. This shift is propelling vacation rentals and designer hostels, which promise community, flexibility, and shareable moments that align with social-media culture. Hotel groups are countering with hybrid accommodation concepts, such as micro-room urban properties featuring co-working lounges and self-service kitchens, to stay relevant to digital natives. Gamified loyalty programs are also gaining traction because they reward frequent micro-trips rather than only high-value stays, which fits the travel patterns of younger consumers. As disposable income rises among these demographics, their expectations continue to reshape industry norms around personalization, sustainability, and digital convenience.
Expansion of Low-Cost Carriers Boosting Short-Haul Trips
Regional budget airlines are opening new point-to-point routes that shorten travel times and lower ticket prices, making weekend getaways and midweek bleisure excursions more feasible. In Southeast Asia, for instance, secondary airports have doubled passenger throughput since 2024, funneling a surge of demand toward nearby accommodations that were previously overlooked. OTAs quickly ingest flight-path data to anticipate surges and preload relevant accommodation options, driving incremental booking volume with minimal marketing spend. Property owners in emerging resort towns are digitizing their inventory to capture this influx, often partnering with distribution platforms that promise global visibility. Last-minute mobile bookings have become a hallmark of these trips, prompting revenue-management systems to emphasize agile rate adjustments within 48-hour windows. Overall, low-cost carrier growth acts as a catalyst that broadens the addressable customer base for digital lodging marketplaces.
AI-Powered Hyper-Personalized Search & Recommendation Engines
Generative AI embedded into booking funnels is transforming conventional keyword search into conversational decision-making that mirrors human travel agents. Travelers can now ask complex questions in natural language, and the system returns curated lists that match budget, amenity preferences, and experiential goals. For suppliers, AI enables contextual pricing that can nudge fence-sitters with timed offers calibrated to predicted willingness to pay. Video, image, and text reviews are summarized automatically, helping users absorb sentiment without scrolling through hundreds of posts. Early pilots reveal higher click-through rates and longer stay durations when recommendations align with inferred travel purpose, such as anniversaries or remote work retreats. As models learn across millions of interactions, the feedback loop accelerates innovation and deepens platform stickiness, creating a formidable moat around AI-rich ecosystems[2]Source: Cloudbeds, “Cloudbeds Unveils Advanced Revenue Intelligence and Guest Marketing Capabilities Powered by Signals AI Foundation Model,” hospitalitynet.org
Restraints Impact Analysis*
| Restraint | (~) % Impact on CAGR Forecast | Geographic Relevance | Impact Timeline |
|---|---|---|---|
| Rising regulatory scrutiny on short-term rentals | -1.9% | Europe and North America highest, moderate in Asia-Pacific | Short term (≤ 2 years) |
| High customer-acquisition costs compressing OTA margins | -1.3% | Global, intense in mature markets | Medium term (2–4 years) |
| Cyber-security & data-privacy breaches | -1.2% | Global, especially in digitally advanced regions | Short term (≤ 2 years) |
| Supply crunch in prime urban locations during mega events | -0.9% | Global, especially in event-hosting cities (e.g., Olympics) | Short term (≤ 2 years) |
| Source: Mordor Intelligence | |||
Rising Regulatory Scrutiny on Short-Term Rentals
City councils across tourist hubs are imposing license caps, zoning rules, and nighttime limits to rebalance housing markets strained by vacation rentals. Platforms must invest in compliance dashboards that verify host eligibility, collect local taxes, and supply transparency reports on listing density. Non-compliant inventory faces delisting, shrinking available stock, and driving room rates upward during peak periods. Traditional hotels often obtain an advantage because they already comply with safety, accessibility, and taxation norms, whereas smaller hosts struggle to navigate new rules. Platforms that automate registration and facilitate tax remittance help retain supply, yet they incur additional development and operational expenses. Over time, stricter oversight could nudge travelers back toward regulated lodging formats, moderating the explosive growth of peer-to-peer rentals.
High Customer-Acquisition Costs Compressing OTA Margins
Digital advertising auctions on search and social platforms are becoming more expensive as travel demand rebounds and bidding wars intensify. Market leaders can afford elevated cost-per-click rates because their larger take rates and cross-sell revenues subsidize marketing, but smaller OTAs suffer margin erosion. Alternative traffic sources, such as influencer collaborations and metasearch partnerships, offer relief but lack the scale to fully replace paid search. Some operators are experimenting with subscription models that promise members lower service fees in exchange for predictable recurring revenue that shields them from ad-spend volatility. Payment providers and fintech firms are becoming strategic allies because integrated checkout boosts conversion, allowing OTAs to stretch marketing dollars further. While high acquisition costs persist, platforms that master retention through loyalty perks and personalized upsells will achieve better lifetime value, cushioning the impact on profitability.
*Our forecasts treat driver/restraint impacts as directional, not additive. The impact forecasts reflect baseline growth, mix effects, and variable interactions.
Segment Analysis
By Platform: Mobile Applications Expand as Primary Booking Hub
Mobile channels accounted for 61.45% of the online accommodation booking market share in 2025, a proportion that continues to widen as smartphone users expect one-handed search, voice input, and biometric payment verification. These apps compress the discover-research-book cycle into a few taps, which directly improves conversion while gathering high-quality behavior data for AI models. Push notifications remind travelers of price changes, loyalty milestones, and check-in details, thereby deepening engagement and encouraging repeat use. The online accommodation booking market size accruing to web browsers remains sizable, yet its growth trails mobile, especially among digital natives who consider laptops optional for travel planning. Established OTAs are restructuring product roadmaps to favor app-only features, such as mobile-exclusive discounts and AR room previews, to migrate reluctant desktop users. Independent hotels are following suit with white-label apps that sync room keys and in-stay messaging, narrowing the functionality gap with aggregator platforms.
Loyalty ecosystems now emphasize in-app gamification, awarding badges for consecutive bookings, off-peak travel, or eco-friendly property choices that resonate with younger travelers. Real-time location services allow apps to suggest nearby attractions, rideshares, or dining offers, extending value beyond the accommodation transaction itself. This ancillary focus increases average revenue per user while positioning the platform as a holistic trip companion instead of a one-off reservation tool. Super-apps in Asia-Pacific exemplify the potential, bundling flights, stay options, digital wallets, and food delivery in a single interface that streamlines vacation logistics. Western competitors observe these models closely, experimenting with partner APIs that insert add-on services without overhauling core infrastructure. App store ratings and review management, therefore, emerge as critical brand assets because they heavily influence organic installs and search ranking.


By Mode of Booking: OTAs Retain Scale Advantage as Direct Channels Accelerate
Third-party OTAs booked 71.60% of global transactions in 2025 because they aggregate massive inventories, enforce price transparency, and package cross-border payment tools. Their global reach attracts independent properties that cannot justify direct marketing across multiple languages or regulatory regimes. Nonetheless, direct portals are climbing a steeper growth curve, logging a 12.2% CAGR by leveraging loyalty programs and personalized offers to recapture share from intermediaries. Hotels are integrating dynamic-pricing algorithms that adapt to live demand signals, which narrows rate gaps and encourages guests to transact on branded sites. Some chains align with fintech partners to embed pay-over-time and buy-now-pay-later plans, smoothing sticker shock and improving direct checkout conversion. Meanwhile, OTAs are countering with white-label solutions that supply hotels with tech stacks under revenue-share agreements, complicating the binary OTA-versus-direct narrative.
In a landscape where search giants control discovery gateways, distribution diversification remains imperative for hotels aiming to reduce commission leakage. Meta-search participation, influencer endorsements, and content marketing built around property storytelling complement direct booking strategies that emphasize brand differentiation. OTAs, for their part, continue to widen service portfolios into insurance, experiences, and ground transport, reinforcing their value proposition beyond room aggregation. Both channels harness AI chatbots that respond instantly to pricing queries, amenity clarification, and cancellation policies, raising service expectations industry-wide. Regulatory proposals that encourage rate parity transparency could level the playing field, yet enforcement nuances vary by jurisdiction, keeping strategic uncertainty high. Ultimately, the balance between OTA reach and direct intimacy will depend on how effectively each side personalizes, bundles, and prices its offerings over the forecast horizon.
By Property Type: Hotels & Resorts Dominate While Alternative Lodgings Surge
Hotels and resorts represented 49.02% of the online accommodation booking market size in 2025 because they meet corporate compliance, brand standards, and loyalty perks that matter to frequent business travelers. Their conventional advantage lies in operational consistency, onsite amenities, and safety protocols that shorter-term rental hosts sometimes lack. Vacation rentals remain formidable, anchored by families and groups seeking larger spaces and kitchen facilities, whereas hostels capture cost-sensitive segments that prioritize social interaction over privacy. The online accommodation booking market share of alternative lodgings like glamping tents, houseboats, and farm-stays is expanding fastest at a 14.9% CAGR as experience-seeking travelers crave novelty, nature immersion, and photo-worthy aesthetics. Hotel brands respond with soft-brand collections and pop-up concepts that mimic boutique flair without diluting chain quality assurance. As the lines blur, platforms refine taxonomy and search filters so users can compare cabins with city lofts on equal footing.
Property managers are investing in smart-lock technology, automated cleaning schedules, and unified channel managers that sync pricing across OTAs and direct portals in near real time. These operational upgrades narrow the gap between traditional hospitality and peer-to-peer listings, making alternative stays more accessible to risk-averse guests. ESG factors influence property choice as well, with travelers rewarding solar-powered campsites, plastic-free amenities, and fair-wage labor certifications. Insurance underwriters offer tailored coverage for short-term rentals, de-risking participation for individual hosts, and fostering supply growth in regulated jurisdictions. Data-driven yield tools help boutique hotels and rentals detect local events, weather anomalies, and flight patterns to optimize nightly rates, maximizing revenue per available room irrespective of property class. Together, these innovations reconfigure property-type boundaries and propel a more diversified lodging landscape.
Geography Analysis
Asia-Pacific surpassed North America in booking volume growth, posting a 12.1% regional CAGR that far outpaces mature Western markets. Expanding middle-class disposable income, rapid airport infrastructure additions, and widespread mobile payment adoption are driving this momentum. Low-cost carriers add intra-regional routes weekly, stimulating spontaneous domestic and short-haul travel that fills city-center hotels and coastal resorts. Super-apps combine ride-hailing, payment wallets, and hotel inventory, lowering entry barriers for first-time digital bookers and elevating the importance of localized UX design. Government visa-facilitation policies, such as e-Visa schemes and simplified arrival procedures, further lubricate cross-border demand within Southeast Asia and beyond. As international chains roll out conversion-friendly localized websites, they strive to capture rising outbound traffic from India and mainland China, where regulatory clarity improves but still poses occasional bottlenecks on data localization and payment flows.
Europe still maintains the largest regional slice at 33.05% of global revenue due to a dense concentration of tourist attractions, high penetration of direct train connections, and strong legacy brand presence. However, stricter rental regulations in cities like Amsterdam and Barcelona temper short-term rental growth, nudging supply toward licensed hotels. Consumers benefit from multi-currency wallets and EU-wide payment harmonization that simplify cross-border bookings within the Schengen area. OTAs exploit this integration by bundling rail passes and attraction tickets, generating incremental revenue streams beyond accommodation itself. Political pressures on overtourism lead to visitor caps and dynamic taxation in famous locales, prompting travelers to explore secondary cities that now feature prominently in search results. Such dispersion broadens geographic coverage for platforms, though it also demands finer-grained inventory onboarding in emerging destinations.
North America, with a 27.62% share, exemplifies a market where digital channels already saturate the travel funnel, so incremental growth hinges on experiential upsells and value-added bundles rather than raw customer acquisition. U.S. consumers show a strong affinity for loyalty ecosystems that unify flights, stays, and co-branded credit-card rewards. Canadian provincial initiatives that market off-season wilderness experiences foster cross-border traffic, encouraging hotels to collaborate with outdoor excursion partners and display packaged offers online. Caribbean resort operators adopt advanced revenue-management platforms to compete with cruise lines for vacation budgets, accelerating digital transformation among all-inclusive properties. Mexico’s integration into North American flight networks brings new feeder markets while inviting closer scrutiny of safety and tax compliance standards on vacation rentals. Taken together, these factors sustain a healthy but competitive environment where personalization and tiered loyalty benefits become decisive in share gains.
Competitive Landscape
The online accommodation booking market is characterized by an oligopolistic structure, led by a few dominant players. Booking Holdings, Expedia Group, and Airbnb together command a majority share of the market, highlighting their significant influence. These major platforms benefit from scale advantages that enable them to negotiate better payment processing terms, secure premium advertising placements, and attract top AI talent, further reinforcing their leadership. Trip.com Group and Agoda complete the top five, leveraging strong regional presence and effective language localization to maintain competitiveness in the Asia-Pacific region against global giants. Competitive strategies focus on proprietary AI engines that shorten booking paths, anticipate ancillary purchases, and personalize in-stay services such as upgrades and late checkout offers. Strategic differentiation also appears in content formats, with short-form video and immersive imagery becoming pivotal in inspiring undecided travelers at the dreaming stage. Outsized marketing budgets enable extensive A/B testing that small platforms cannot match, further widening innovation gaps.
To fortify customer lock-in, Booking Holdings integrates attraction tickets and intercity rail passes, while Expedia Group expands B2B APIs that place its inventory inside bank apps and workplace travel platforms. Airbnb pursues professionalization, vetting hosts through Project Lighthouse to elevate quality and consistency, thereby courting business travelers formerly exclusive to hotels. Regional champions like Yanolja in South Korea invest in cloud-based property-management software that embeds inventory directly into consumer apps, fostering an ecosystem loop. Private-equity interest remains high, evidenced by funding rounds in vertical-specific platforms that cater to campgrounds or luxury villas, although exit timelines may hinge on regulatory clarity and acquisition appetite from the top five. Overall, sustained R&D spending and M&A firepower among leading players set a high bar for insurgents seeking relevance in a concentrated arena.
Competitive threats stem from super-apps, search engine feature encroachment, and voice-assistants that could disintermediate traditional booking flows by pushing recommendations directly to users without visible interfaces. Market leaders hedge by signing distribution agreements with smart-speaker manufacturers and embedding widgets into car dashboards that present lodging options en route. Data-privacy legislation such as the Digital Markets Act imposes new consent management obligations but also restricts gatekeeper platforms, potentially reducing ad-tech dominance and opening niches for specialized OTAs[3]Source: Zacks Equity Research, “Expedia Group Aids Travelers & Partners With New Releases,” nasdaq.com. Meanwhile, sustainability credentials and carbon-emission calculators emerge as differentiators as corporate travel managers impose ESG reporting on preferred suppliers. Platforms quick to surface eco-labels and verified sustainability scores may win share among procurement officers and climate-conscious consumers alike. In sum, the competitive landscape evolves through a blend of technological innovation, regulatory response, and shifting traveler priorities that favor agile, well-capitalized operators.
Online Accommodation Booking Industry Leaders
Expedia Group Inc.
Booking Holdings Inc.
Airbnb Inc.
Trip.com Group Ltd.
Agoda Company Pte. Ltd.
- *Disclaimer: Major Players sorted in no particular order
.webp)

Recent Industry Developments
- October 2025: Cloudbeds launched Signals AI foundation model, a hospitality-specific artificial intelligence system processing 4 billion data points hourly to deliver up to 95% forecasting accuracy across 90-day booking periods, with particular strength in seven-day booking windows for last-minute reservation optimization.
- September 2025: Cloudbeds unveiled advanced revenue intelligence and guest marketing capabilities powered by its Signals AI platform, enabling hotels to achieve unified commercial strategies across distribution channels while processing diverse inputs including competitor rates, event feeds, weather patterns, and booking behaviors.
- June 2025: PayPal partnered with Selfbook to embed hotel booking functionality within the PayPal app ecosystem, offering commission-free rates to PayPal users while integrating PayPal, Venmo, and Buy Now Pay Later payment options into hotel booking flows powered by conversational AI technology.
- May 2025: Expedia Group expanded its B2B platform with new APIs for car rentals (110+ brands across 190 countries), activities (170,000+ bookable experiences), insurance, and air travel, while launching GenAI partnerships including Trip Matching on Instagram and integration with OpenAI Operator and Microsoft Copilot Actions.


Global Online Accommodation Booking Market Report Scope
A complete background analysis of the Global Online Accommodation Booking Market, which includes an assessment of the national accounts, economy, and emerging market trends by segments, significant changes in the market dynamics, and market overview is covered in the report.
| Mobile Application |
| Website |
| Third-party online portals |
| Direct/captive portals |
| Hotels & Resorts |
| Vacation Rentals |
| Hostels & Budget Accommodations |
| Alternate Lodgings (Glamping, Farm-stays) |
| North America | United States |
| Canada | |
| Mexico | |
| South America | Brazil |
| Peru | |
| Chile | |
| Argentina | |
| Rest of South America | |
| Europe | United Kingdom |
| Germany | |
| France | |
| Spain | |
| Italy | |
| BENELUX (Belgium, Netherlands, Luxembourg) | |
| NORDICS (Denmark, Finland, Iceland, Norway, Sweden) | |
| Rest of Europe | |
| Asia-Pacific | India |
| China | |
| Japan | |
| Australia | |
| South Korea | |
| South-East Asia (Singapore, Malaysia, Thailand, Indonesia, Vietnam, Philippines) | |
| Rest of Asia-Pacific | |
| Middle East and Africa | United Arab Emirates |
| Saudi Arabia | |
| South Africa | |
| Nigeria | |
| Rest of Middle East and Africa |
| By Platform | Mobile Application | |
| Website | ||
| By Mode of Booking | Third-party online portals | |
| Direct/captive portals | ||
| By Property Type | Hotels & Resorts | |
| Vacation Rentals | ||
| Hostels & Budget Accommodations | ||
| Alternate Lodgings (Glamping, Farm-stays) | ||
| By Geography | North America | United States |
| Canada | ||
| Mexico | ||
| South America | Brazil | |
| Peru | ||
| Chile | ||
| Argentina | ||
| Rest of South America | ||
| Europe | United Kingdom | |
| Germany | ||
| France | ||
| Spain | ||
| Italy | ||
| BENELUX (Belgium, Netherlands, Luxembourg) | ||
| NORDICS (Denmark, Finland, Iceland, Norway, Sweden) | ||
| Rest of Europe | ||
| Asia-Pacific | India | |
| China | ||
| Japan | ||
| Australia | ||
| South Korea | ||
| South-East Asia (Singapore, Malaysia, Thailand, Indonesia, Vietnam, Philippines) | ||
| Rest of Asia-Pacific | ||
| Middle East and Africa | United Arab Emirates | |
| Saudi Arabia | ||
| South Africa | ||
| Nigeria | ||
| Rest of Middle East and Africa | ||


Key Questions Answered in the Report
How large is the online accommodation market today?
The online accommodation market size is USD 361.54 billion in 2026 and is projected to reach USD 484.95 billion by 2031.
Which booking channel is growing fastest in digital lodging?
Mobile applications are advancing at a 12.65% CAGR through 2031, making them the fastest-expanding platform.
What is driving Asia-Pacific’s rapid growth in digital accommodation?
Rising middle-class income, low-cost carrier expansion, and mobile payment adoption are propelling a 12.1% CAGR in the region.
Why are alternative lodgings gaining traction among travelers?
Experience-seeking guests favor unique stays such as glamping and farm-stays, pushing alternative lodging to a 14.9% CAGR.
Page last updated on:


