Market Overview
| Study Period | 2021 - 2031 |
|---|---|
| Forecast Data Period | 2026 - 2031 |
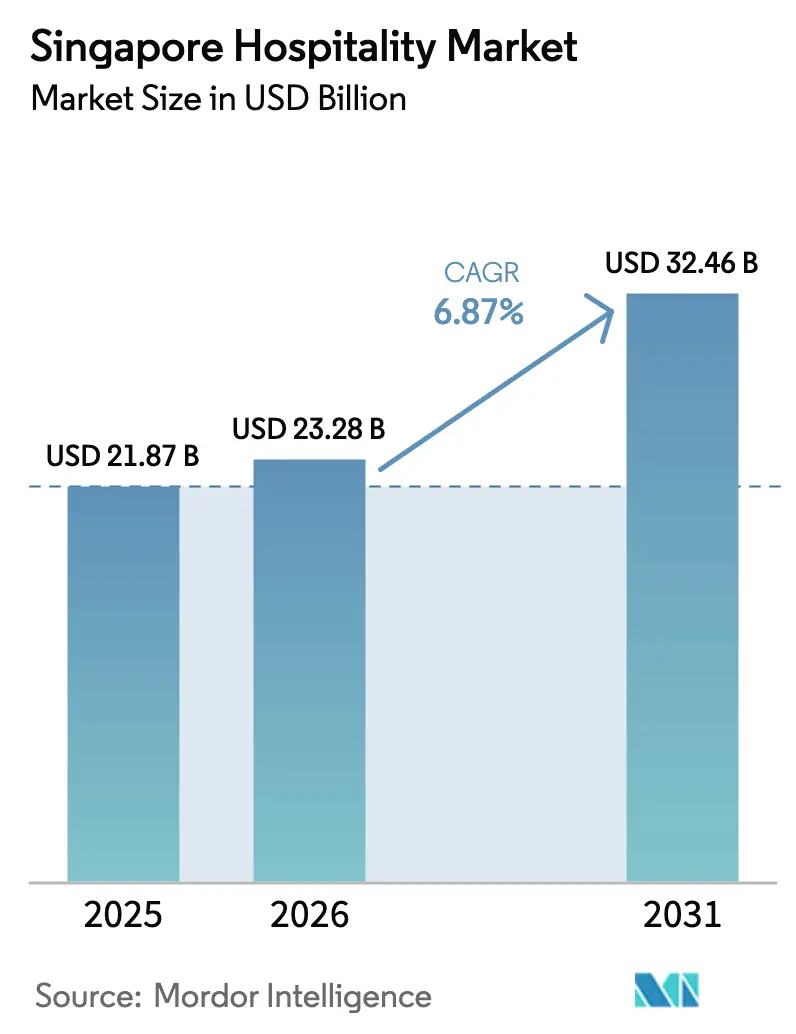
| Base Year Market Size (2025) | USD 21.87 Billion |
| Market Size (2026) | USD 23.28 Billion |
| Market Size (2031) | USD 32.46 Billion |
| Growth Rate (2026 - 2031) | 6.87% CAGR |
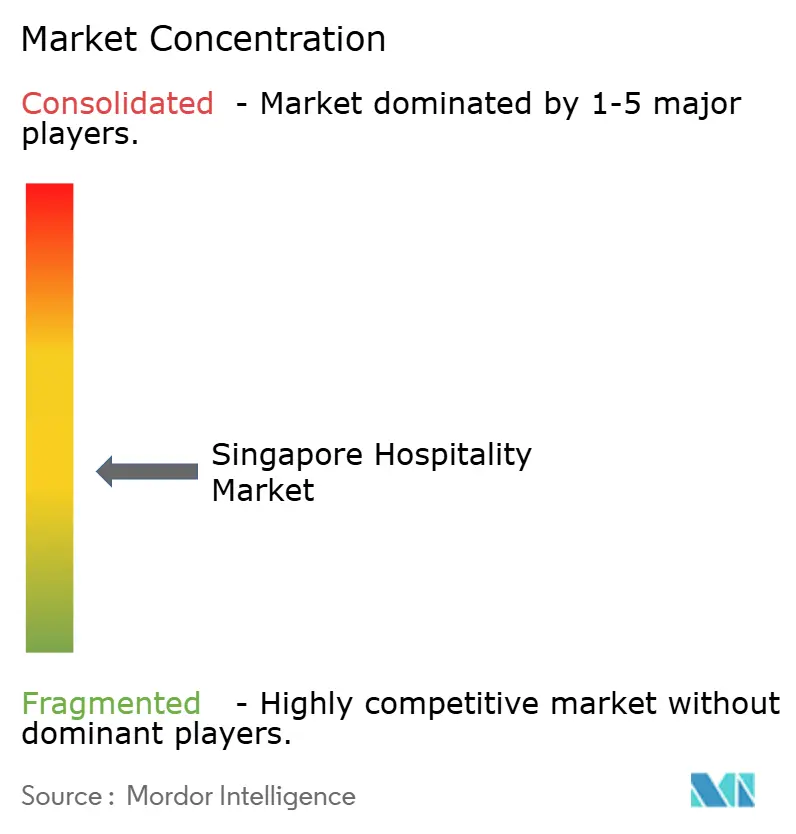
| Market Concentration | Medium |
Major Players *Disclaimer: Major Players sorted in no particular order Image © Mordor Intelligence. Reuse requires attribution under CC BY 4.0. | |
Singapore Hospitality Market Analysis by Mordor Intelligence
The Singapore hospitality market size is expected to grow from USD 21.87 billion in 2025 to USD 23.28 billion in 2026 and is forecast to reach USD 32.46 billion by 2031 at a 6.87% CAGR over 2026-2031. Demand is broadening beyond a post-pandemic rebound, as MICE and leisure continue to recover while extended stays lift serviced apartments that cater to corporate relocations and co-living use cases. Operators are leaning into pricing discipline as supply remains tight, which supports rate integrity even when occupancy normalization lags peak years of the past. Companies are using this window to prioritize sustainability retrofits that improve operating margins and align with national standards and traveler preferences for certified stays. Digital adoption across booking and on-property systems is deepening, supporting better conversion on brand.com and contactless experiences that reduce front-line staffing pressure, while strengthening the long-term revenue mix of the Singapore hospitality market.
Key Report Takeaways
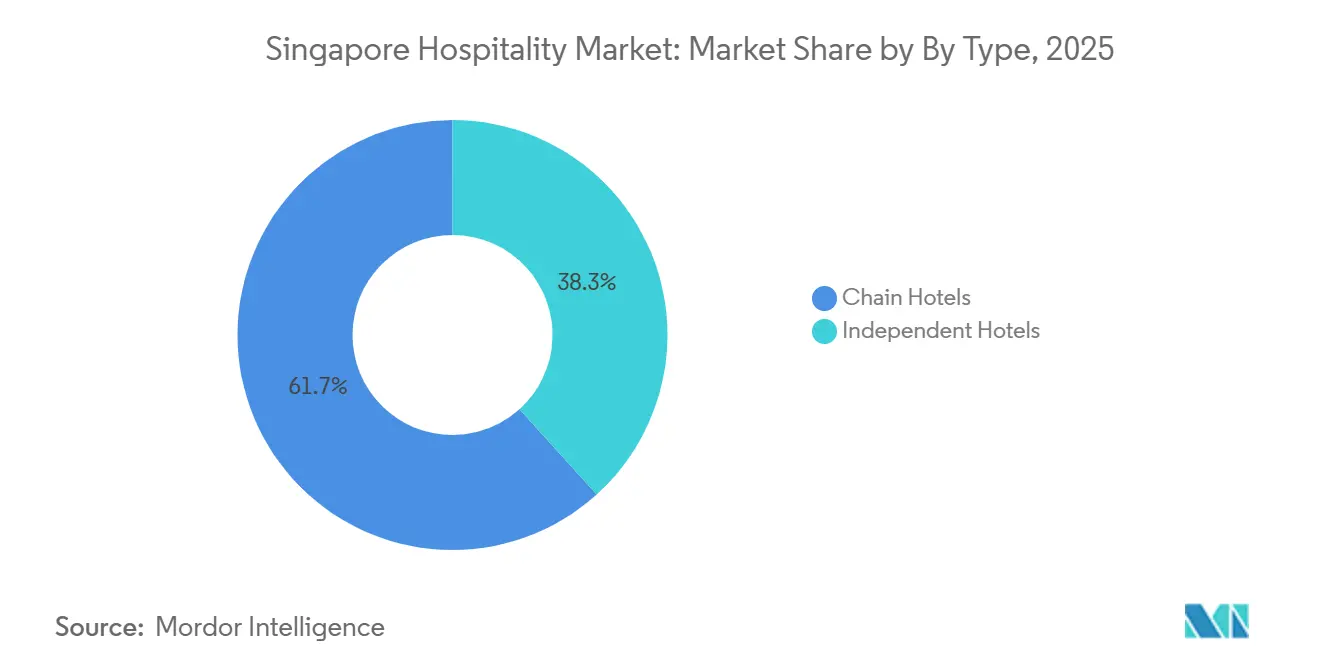
- By type, chain hotels led with 61.65% of the Singapore hospitality market share in 2025. Service apartments are projected to expand at a 9.76% CAGR through 2031.
- By accommodation class, luxury properties accounted for 47.65% of the Singapore hospitality industry share in 2025. Budget and economy are forecast to grow at an 8.67% CAGR through 2031.
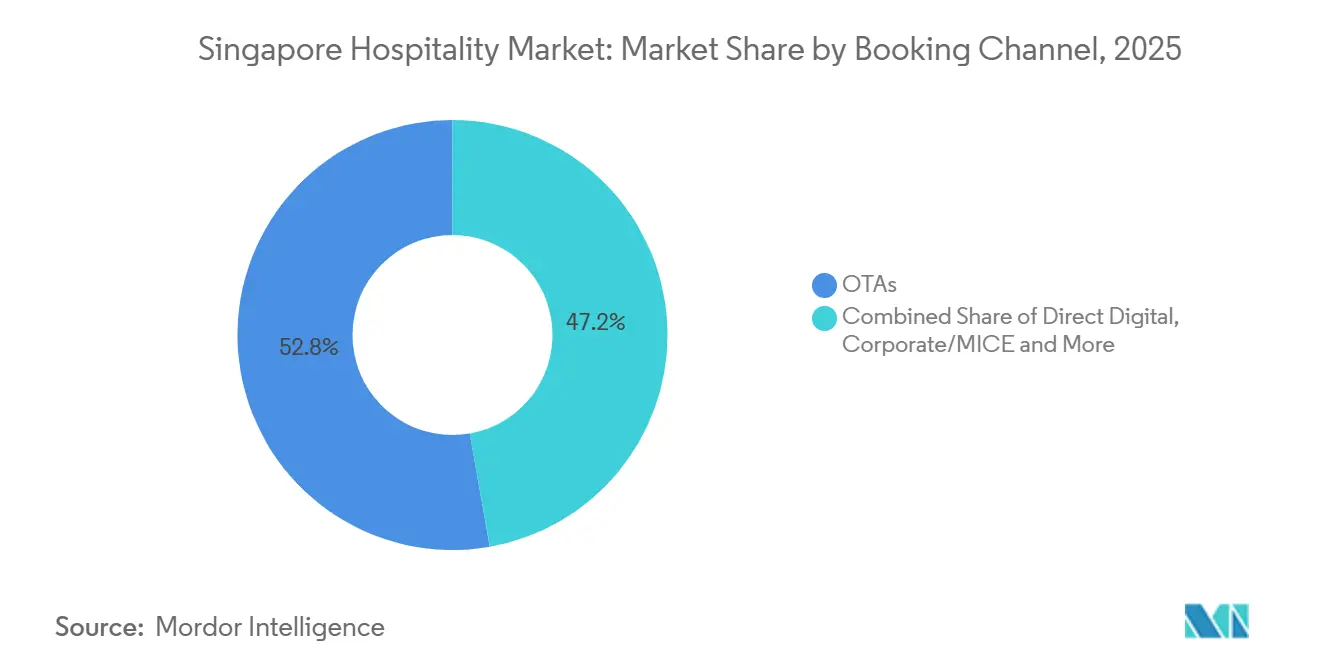
- By booking channel, OTAs captured 52.77% of the Singapore hospitality market share in 2025. Direct digital is projected to grow at a 12.68% CAGR through 2031.
- By geography, Marina Bay and Downtown Core accounted for 38.77% of the Singapore hospitality market share in 2025. Changi and East Coast are projected to grow at an 8.66% CAGR through 2031.
Note: Market size and forecast figures in this report are generated using Mordor Intelligence’s proprietary estimation framework, updated with the latest available data and insights as of January 2026.
Singapore Hospitality Market Trends and Insights
Drivers Impact Analysis*
| Driver | (~) % Impact on CAGR Forecast | Geographic Relevance | Impact Timeline |
|---|---|---|---|
| Post-pandemic rebound in inbound tourism & mega-events | + 1.8% | Global, strongest from Southeast Asia, and long-haul resumption | Medium term (2-4 years) |
| Government-backed MICE calendar expansion | + 1.2% | Marina Bay, Downtown Core, Sentosa, and Southern Waterfront | Long term (≥ 4 years) |
| Tight new-build pipeline keeps ADRs elevated | + 1.1% | National, early gains in Marina Bay, Downtown Core, Orchard Road | Long term (≥ 4 years) |
| Rapid shift to digital and mobile booking ecosystems | + 0.9% | National | Short term (≤ 2 years) |
| Conversion of offices into co-living and serviced apartments | + 0.7% | Downtown Core, Bugis, and Little India | Medium term (2-4 years) |
| Demand for ESG-certified luxury stays | + 0.6% | Marina Bay, Downtown Core, Sentosa, Southern Waterfront, and Orchard Road | Medium term (2-4 years) |
| Source: Mordor Intelligence | |||
Post-pandemic rebound in inbound tourism & mega-events
International visitor arrivals climbed to 16.53 million in 2024, an increase that confirmed Singapore’s recovery momentum and a decisive return of long-haul and regional demand. The spending mix skewed toward higher-yield segments, with traveler behavior consistent with premium experiences that support rate strength in the Singapore hospitality market. Singapore’s hosting of large-scale events continued to anchor visibility and drive citywide compression, with the Formula 1 Singapore Grand Prix underscoring the role of hallmark events in lifting week-on-week occupancy in trackside districts. The shift of the F1 race to October in 2025 highlighted that event calendars can redistribute rather than always add to monthly demand, which operators balanced through portfolio-wide revenue management strategies. Changi Airport reported a strong rebound in 2025 operating indicators, reinforcing the demand backdrop and the city’s role as a regional hub for both leisure and business travel.[1]Singapore Department of Statistics, “Tourism — Latest Data,” Singapore Department of Statistics, singstat.gov.sg
Government-backed MICE calendar expansion
Public policy continues to prioritize high-value MICE events that utilize premium room inventory mid-week and feed ancillary spending across food, entertainment, and services. Large anchor shows and conventions, together with recurring trade gatherings, are central to Singapore’s positioning as a global meetings capital and support year-round base demand for the Singapore hospitality market. The upcoming expansion at Marina Bay Sands will add a 15,000-seat entertainment arena and new premium meeting facilities slated for opening by 2031, which strengthens the city’s ability to land marquee events that require large, integrated footprints. High-profile conferences such as SIBOS 2027, among others, signal deep pipeline visibility and the confidence of international organizers in Singapore’s infrastructure and logistics readiness.[2]Ministry of Trade and Industry, “Speech by Minister Grace Fu at the Tourism Industry Conference 2025,” Ministry of Trade and Industry, mti.gov.sg This strategy complements ongoing upgrades to attractions and transport assets and is supported by proactive destination marketing from national agencies.
Tight new-build pipeline keeps ADRs elevated
The market is operating with measured additions to room supply, which has allowed average daily rates to stay above pre-2019 levels even as occupancy continues to normalize. Official hotel statistics showed occupancy and rate dynamics that favored pricing power through 2024, a pattern that operators used to calibrate yields in core submarkets. Integrated resorts displayed outsized pricing resilience given their multi-revenue model, with Marina Bay Sands’ premium positioning reflecting how non-room income can buffer lodging volatility and support rate strategy. This supply discipline also encourages capital allocation toward energy efficiency, upgrades that lower utility consumption and improve margins, which aligns with national programs that support greener buildings. The net effect is a balanced approach to growth that supports profitability and the long-term health of the Singapore hospitality market.
Rapid shift to digital & mobile booking ecosystems
Singapore’s Hotel Industry Digital Plan refresh in September 2025 reported that over 90% of hotel SMEs had adopted at least one sector-specific digital solution, up from 60% in 2021, and more than 70% of national room stock integrated with the Singapore Tourism Board’s E-Visitor Authentication system for contactless check-in, compressing average lobby processing time from 6 minutes to under 3. This acceleration supports revenue recapture as mobile-optimized brand sites and apps streamline booking and shift demand from intermediate channels. Hotels that improve page load speed and simplify mobile checkout typically see stronger direct conversion than legacy setups that create friction. As direct mix grows, operators retain more revenue per stay because they avoid third-party commissions and can apply loyalty benefits that support repeat visits. The pivot to mobile and contactless journeys also helps capture last-minute demand shaped by on-the-go research and quick decision cycles, reinforcing commercial momentum for the Singapore hospitality market.
Restraints Impact Analysis*
| Restraint | (~) % Impact on CAGR Forecast | Geographic Relevance | Impact Timeline |
|---|---|---|---|
| Acute labour shortages are inflating operating costs | - 0.8% | National, highest in Marina Bay, Downtown Core, Orchard Road | Medium term (2-4 years) |
| Slow recovery of Mainland Chinese visitation | - 0.5% | National | Medium term (2-4 years) |
| Rising competition from alternative lodging and co-living operators | - 0.4% | Downtown Core, Bugis and Little India, Rest of Singapore | Long term (≥ 4 years) |
| Cap-ex burden from new energy-efficiency mandates | - 0.3% | National | Long term (≥ 4 years) |
| Source: Mordor Intelligence | |||
Acute labor shortages inflating operating costs
The Ministry of Manpower reported 11,200 unfilled positions across accommodation and food services in 2025, with nearly half of blue-collar vacancies remaining open for more than six months, a duration that forces hotels to increase wages[3]Ministry of Manpower, “Labour Force in Singapore Advance Release 2025,” Ministry of Manpower, mom.gov.sg, offer signing bonuses, and deploy foreign workers under the M-SEP scheme, which permits up to 5% expansion beyond standard quotas. Entry-level wages now range from USD 1,325 (SGD 1,800) to USD 1,840 (SGD 2,500) monthly, and 14% of hospitality employers plan 2026 salary increments of 5% or more, outpacing the national median of 3-6%. This cost pressure is structural: Singapore's Progressive Wage Model mandates annual increases for lower-wage roles, and the government's Flexible Work Arrangements guidelines, implemented December 1, 2024, compel employers to accommodate part-time and hybrid schedules that complicate shift coverage.
Slow recovery of Mainland Chinese visitation
Mainland China remained a slower-recovering source market relative to regional flows, which created variability for operators with exposure to group tours and premium-mass gaming segments. Airlines and airport stakeholders expanded point-to-point connectivity with Chinese cities, strengthening the foundation for gradual recovery as traveler confidence improves. Hotels adjusted their source-market mix by strengthening acquisitions in Southeast Asia and India, which supported shorter booking cycles and helped backfill mid-week demand. Event-driven visitation and cruise deployments contributed to diversifying demand beyond a single source country, which is strategically important for a compact destination. The overall trend reinforced the need to sustain broad-based demand generation that supports the Singapore hospitality market through different economic cycles.
*Our forecasts treat driver/restraint impacts as directional, not additive. The impact forecasts reflect baseline growth, mix effects, and variable interactions.
Segment Analysis
By Type: Service Apartments Capture Extended-Stay Surge
Chain hotels held 61.65% of the Singapore hospitality market share in 2025, reflecting the distribution scale and loyalty ecosystems that global brands built over multiple cycles. Service apartments are projected to expand at a 9.76% CAGR through 2031, and this growth directly increases the Singapore hospitality market size for extended-stay formats that bundle residential functionality with hotel-grade services. The demand profile includes relocating executives, digital nomads, and medical travelers, all of whom prioritize space, kitchenette access, and reliable connectivity that traditional rooms often do not optimize. Independent hotels continued to differentiate through localized experiences and nimble operations, although their digital marketing and OTA bargaining positions are structurally weaker than those of chains. In practice, chains and serviced apartment platforms use scale to tender better rates on technology, sustainability upgrades, and workforce training, which supports cost control and consistency across the Singapore hospitality market.
Asset conversion has accelerated as owners re-evaluate the economics of older office blocks and pursue higher-yield hospitality uses, an approach that aligns with urban renewal and reactivation in the Downtown Core. Redevelopment projects by listed platforms illustrated this shift, including serviced residence pipelines designed around co-living concepts that anchor occupancy with community programming and flexible leases. National green-building initiatives guide design choices, incentivizing energy performance that lowers life-cycle costs and reduces exposure to future carbon pricing. Portfolio managers framed these upgrades as both compliance and brand strategy, given that sustainability certification increasingly influences enterprise procurement and corporate travel policies. The direction of travel suggests the Singapore hospitality industry will continue to converge around flexible living models that balance asset efficiency with evolving guest expectations.


By Accommodation Class: Budget Assets Gain as Luxury Sustains Premium
Luxury properties captured 47.65% of the Singapore hospitality market size in 2025, anchored by integrated resorts and iconic brands that attract high-net-worth travelers seeking premium experiences. Budget and economy properties are forecast to grow the fastest, at an 8.67% CAGR, driven by cost-conscious regional visitors who trade amenities for location and value. Upper-mid and mid-scale hotels faced persistent pressure from tighter corporate travel policies and hybrid work patterns that reduced trip frequency and shortened the length of stay. Performance within luxury diverged by sustainability credentials and integration of wellness, culinary, and event-programming that support longer stays and repeat visitation. The composition of demand across classes reinforces revenue management discipline and mix optimization across the Singapore hospitality market.
Integrated resort benchmarks remained strong in 2025, with Marina Bay Sands reporting record mass segment performance and high occupancy, which supported premium ADRs and strengthened confidence in the depth of luxury demand. At the same time, scalable green retrofits spread across mid-scale and upscale properties, which cut energy use and improved net operating income in a high-tariff environment. The emergence of co-living and serviced suites that straddle mid-scale and premium positioning allowed operators to flex pricing by season and event calendar. Properties with visible sustainability achievements and proven operational efficiency signaled resilience across cycles, an important consideration for lenders and investors. These dynamics underscore how both ends of the spectrum can expand alongside a growing core in the Singapore hospitality market.
By Booking Channel: Direct Digital Disrupts OTA Dominance
OTAs accounted for 52.77% of the Singapore hospitality market size in 2025, reflecting traveler trust in comparison engines and reviews that support leisure decisions. Direct digital is projected to grow at a 12.68% CAGR, reinforced by loyalty ecosystems, co-branded cards, and members-only rates that reduce commission leakage and improve contribution margins. Corporate and MICE channels remained critical for mid-week base load but operated under stricter enterprise budgets that required sharper yield management. Wholesale and traditional agents continued to serve specific source markets and group tours, although their relative weight moderated as younger travelers shifted further to self-service booking flows. Together, these trends shape a booking mix that supports stronger brand control and lifetime value in the Singapore hospitality market.
Digitalization accelerated under the National Hotel Industry Transformation Map, which encourages the adoption of interoperable tools that improve revenue capture and on-property efficiency. Check-in and identity verification are more automated today, creating smoother arrivals and reducing desk queues, while also lowering reliance on manual processes. Data integration across property-management, channel, and CRM systems supports targeted offers and loyalty-point accelerators that can lift direct conversion. The resulting data exhaust helps teams refine content and dynamic pricing on brand.com and app channels without overexposing discounts on third-party sites. The outcome is a healthier channel mix that enhances profitability and brand equity across the Singapore hospitality market.

Geography Analysis
Marina Bay and Downtown Core captured 38.77% of the Singapore hospitality market size in 2025, a concentration driven by flagship properties and large MICE footprints that support premium pricing power. Changi and East Coast are projected to grow at an 8.66% CAGR through 2031 as aviation and cruise deployments expand, supported by long-term infrastructure plans. Orchard Road leveraged retail and dining to draw leisure travelers, while heritage districts like Bugis and Little India attracted value-seeking visitors whose stays often align with cultural events. Sentosa and the Southern Waterfront continued to benefit from integrated attractions, though renovation cycles and asset mix evolution shaped quarterly share dynamics. The geographic pattern reflects how infrastructure and anchor attractions steer demand distribution in the Singapore hospitality market.
Cruise homeporting added a new layer of demand diversification, highlighted by the five-year deployment of Disney Adventure from December 2025, which encourages pre- and post-cruise stays. Airport performance is also critical for the East Coast corridor, where strong passenger flows underpin hotels serving early departures and late arrivals as well as crews. Future phases of airport development are expected to improve long-haul connectivity and strengthen Singapore’s role as a regional hub, a dynamic that multiplies lodging opportunities beyond the city center. These changes reinforce the case for targeted investments in Changi-adjacent neighborhoods that can capture spillovers from air and cruise growth. The regional footprint will continue to rebalance as supply, events, and transport plans come online across the Singapore hospitality market.
Competitive Landscape
Competitive intensity remains high even as pricing holds, since operators must compete on service design, sustainability, and digital experiences rather than rates alone. Integrated resorts exert an outsized influence on premium segments and event-led demand, which lifts RevPAR in adjacent submarkets during peak calendars. At the same time, a broad field of international chains and strong domestic owners keeps the market moderately fragmented, which encourages ongoing innovation in product and service. Sustainability certifications are now a commercial lever as much as a compliance task, with many enterprise bookers preferring certified hotels for their travel programs. These patterns continue to shape investment priorities and brand strategies across the Singapore hospitality market.
Technology has become a core competitive dimension, with operators deploying smart building systems, efficient kitchens, and digital guest journeys to compress costs and improve experience. Case studies include mid-scale properties that now operate low-carbon kitchens and use intelligent controls to optimize heating and cooling without sacrificing comfort. Brand ecosystems also matter, as loyalty programs can steer share from OTAs and improve repeat rates, which compound value when paired with data-driven personalization. Owners with strong balance sheets are reweighting capex toward upgrades that reduce energy usage and enhance space activation, rather than pure key additions. This orientation supports better cash flow resilience and brand differentiation in the Singapore hospitality market.
Scale continues to confer advantages in procurement and financing, with listed hospitality vehicles recycling capital to maintain competitive products and pursue accretive redeployment. Investor updates from leading platforms highlighted divestment and reinvestment strategies that tilt portfolios to higher-yield assets and flexible living models. Integrated resort disclosures for 2025 pointed to strong premium-mass performance and high occupancy, reinforcing the sustained depth of luxury demand into 2026. Portfolio-wide sustainability roadmaps also signal faster progress toward certifications, which can unlock premium corporate demand and longer-tenure agreements. The cumulative effect is a market where capital, capability, and credibility align to reinforce leadership positions in the Singapore hospitality market.
Singapore Hospitality Industry Leaders
Far East Hospitality
Pan Pacific Hotels Group
Marina Bay Sands
Resorts World Sentosa
Accor Asia Pacific
- *Disclaimer: Major Players sorted in no particular order

Recent Industry Developments
- December 2025: Disney Cruise Line’s Disney Adventure commenced its maiden voyage from Singapore and began a five-year exclusive homeporting arrangement that is expected to extend pre- and post-cruise stays.
- October 2025: IHG Hotels & Resorts named Holiday Inn Express Singapore Clarke Quay its first Low Carbon Pioneer hotel in Asia, featuring fully electric kitchens, hot water heat pumps, and intelligent building systems.
- October 2025: Las Vegas Sands reported Marina Bay Sands Q3 2025 net revenue of USD 1.436 billion with record mass gaming win and a 51.7% EBITDA margin, underscoring integrated resort resilience.
- January 2025: CapitaLand Ascott Trust’s lyf Funan Singapore began contributing revenue, supported by its co-living design and proximity to major MICE venues.


Singapore Hospitality Market Report Scope
The hospitality sector encompasses a diverse array of service-based occupations, including accommodations, theme parks, travel agencies, food and beverage services, event management, hotels, restaurants, and bars. The research covers a comprehensive background examination of the Singaporean hospitality sector, including an evaluation of industry associations, the general economy, emerging market trends by category, notable shifts in the market dynamics, and a market overview.
The Singapore Hospitality Market Report is Segmented by Type (Chain Hotels, Independent Hotels), Accommodation Class (Luxury, Mid & Upper-Mid-scale, Budget & Economy, Service Apartments), Booking Channel (Direct Digital, OTAs, Corporate / MICE, Wholesale & Traditional Agents), and Geography (Marina Bay / Downtown Core, Orchard Road, Sentosa & Southern Waterfront, Bugis & Little India, Changi & East Coast, Rest of Singapore).
By Type (Value)
| Chain Hotels |
| Independent Hotels |
By Accommodation Class (Value)
| Luxury |
| Mid & Upper-Mid-scale |
| Budget & Economy |
| Service Apartments |
By Booking Channel (Value)
| Direct Digital |
| OTAs |
| Corporate / MICE |
| Wholesale & Traditional Agents |
By Geographic Region (Value)
| Marina Bay / Downtown Core |
| Orchard Road |
| Sentosa & Southern Waterfront |
| Bugis & Little India |
| Changi & East Coast |
| Rest of Singapore |
| By Type (Value) | Chain Hotels |
| Independent Hotels | |
| By Accommodation Class (Value) | Luxury |
| Mid & Upper-Mid-scale | |
| Budget & Economy | |
| Service Apartments | |
| By Booking Channel (Value) | Direct Digital |
| OTAs | |
| Corporate / MICE | |
| Wholesale & Traditional Agents | |
| By Geographic Region (Value) | Marina Bay / Downtown Core |
| Orchard Road | |
| Sentosa & Southern Waterfront | |
| Bugis & Little India | |
| Changi & East Coast | |
| Rest of Singapore |


Key Questions Answered in the Report
What is the outlook for the Singapore hospitality market through 2031?
The Singapore hospitality market size is USD 23.28 billion in 2026 and is projected to reach USD 32.46 billion by 2031 at a 6.87% CAGR, underpinned by diversified demand across MICE, leisure, and extended stays.
Which segments are growing fastest in Singapore hospitality?
Service apartments lead by type at a 9.76% CAGR, budget and economy lead by class at an 8.67% CAGR, direct digital leads among booking channels at a 12.68% CAGR, and Changi and East Coast lead by geography at an 8.66% CAGR.
How are direct channels affecting bookings in Singapore hotels?
Direct digital channels are growing at a 12.68% CAGR through 2031 as loyalty programs, subscription offers, and brand apps shift share from OTAs while reducing commissions.
What role does sustainability play in hotel performance in Singapore?
Hotels with recognized certifications benefit from stronger corporate demand and traveller preference, with national programs supporting greener operations that improve margins and brand trust.
Which locations are most important for premium demand in Singapore?
Marina Bay and Downtown Core concentrate premium inventory and citywide MICE activity, while Changi and East Coast are set to grow fastest due to air and cruise-led connectivity.
How do mega-events and MICE shape demand in Singapore hotels?
Large events drive citywide compression and premium pricing during event windows, and a growing slate of conventions secures mid-week base load that supports year-round performance.
Page last updated on:


