Market Overview
| Study Period | 2020 - 2031 |
|---|---|
| Forecast Data Period | 2026 - 2031 |
| Historical Data Period | 2020 - 2024 |
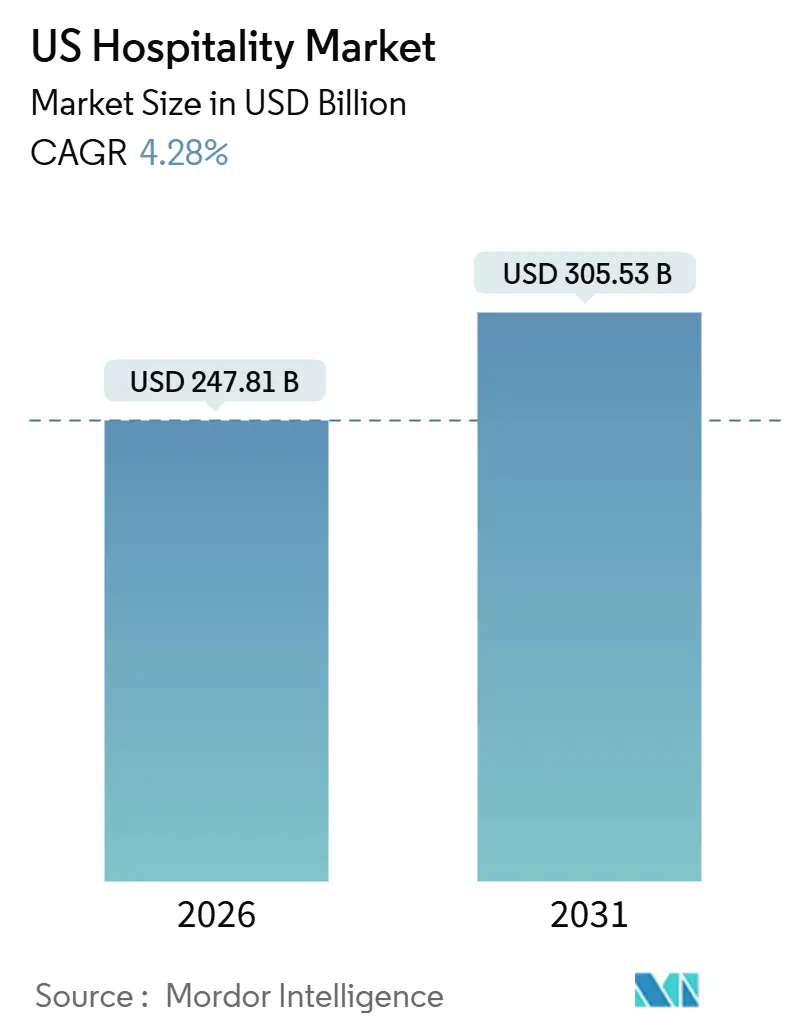
| Market Size (2026) | USD 247.81 Billion |
| Market Size (2031) | USD 305.53 Billion |
| Growth Rate (2026 - 2031) | 4.28% CAGR |
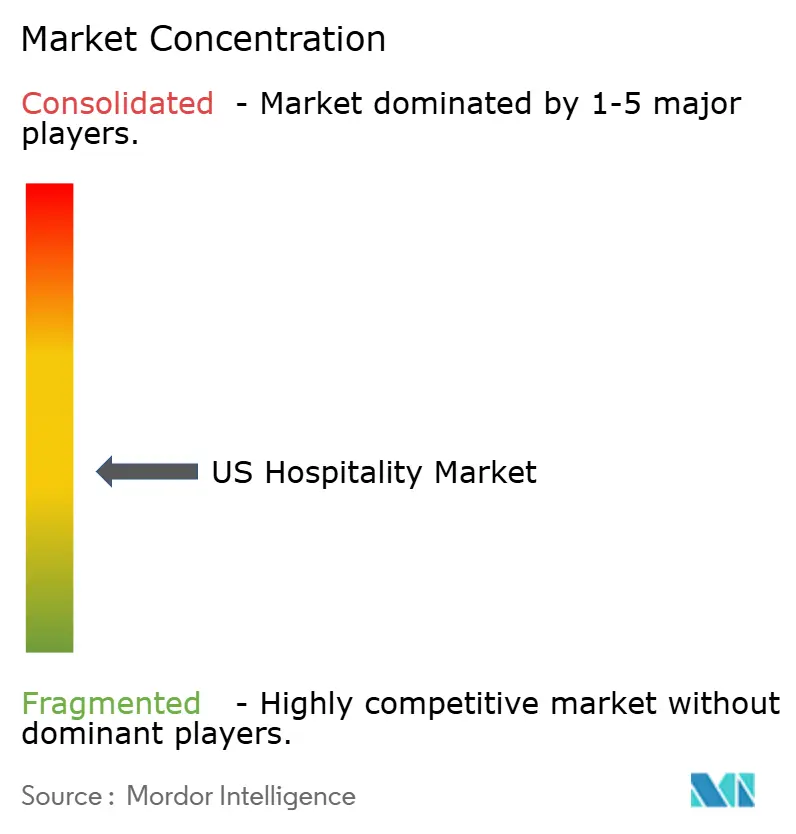
| Market Concentration | Medium |
Major Players *Disclaimer: Major Players sorted in no particular order Image © Mordor Intelligence. Reuse requires attribution under CC BY 4.0. | |
US Hospitality Market Analysis by Mordor Intelligence
The United States hospitality market stands at USD 247.81 billion in 2026 and is projected to reach USD 305.53 billion by 2031, expanding at a 4.28% CAGR. This US hospitality market size reflects steady momentum supported by healthy domestic travel activity, ongoing digital adoption in booking, and the sector’s pivot to experience-led offerings that anchor pricing power in key segments. Hotels continue to manage elevated operating expenses as staffing gaps persist, which sustains interest in asset-light models and technology that improve productivity at scale. Financial conditions remain tighter than the pre-2022 period, which moderates new-build activity and focuses growth on conversions and selective expansion by established brands. Domestic leisure spending and air travel throughput support demand normalization, which reinforces the USA hospitality market with a diversified base that cushions against regional slowdowns. The channel mix is also changing as mobile-first booking and loyalty-driven direct strategies strengthen owned demand capture without ceding control to intermediaries.
Key Report Takeaways
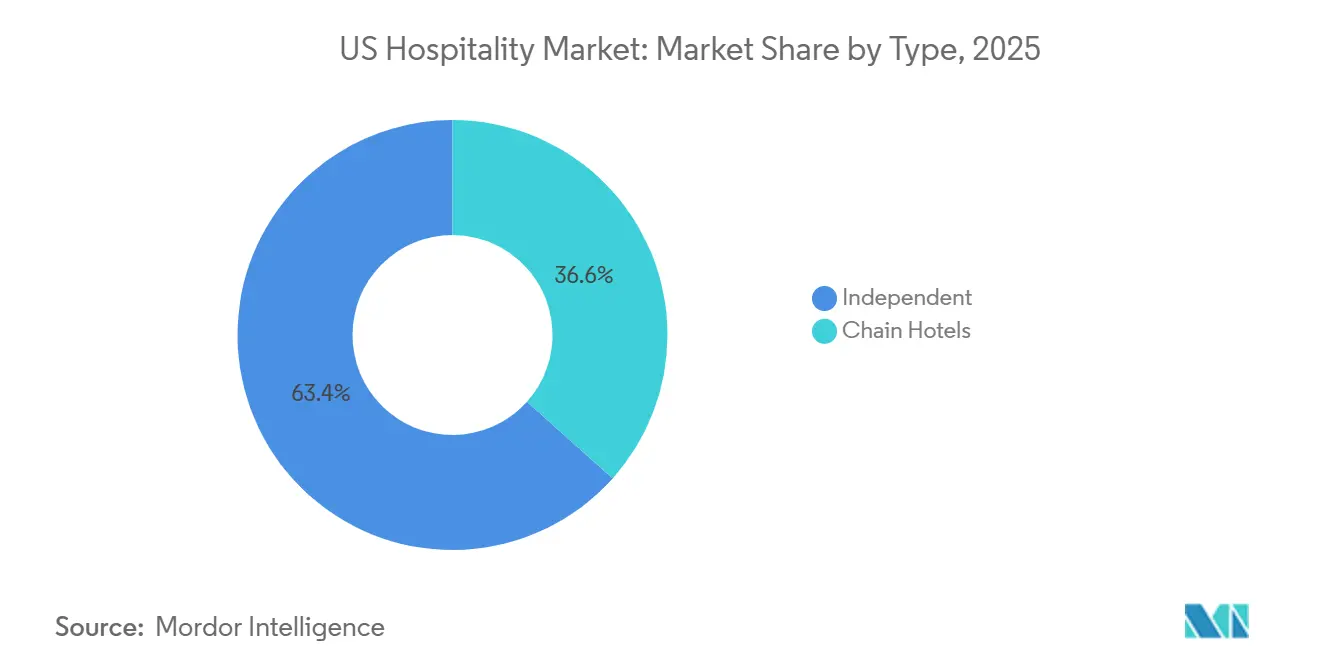
- By type, independent hotels held 63.38% of the United States hospitality market share in 2025, while chain hotels recorded the highest projected CAGR at 7.73% through 2031.
- By accommodation class, mid and upper-midscale properties accounted for 47.73% of the United States hospitality share in 2025, while luxury is forecast to expand at a 6.47% CAGR through 2031.
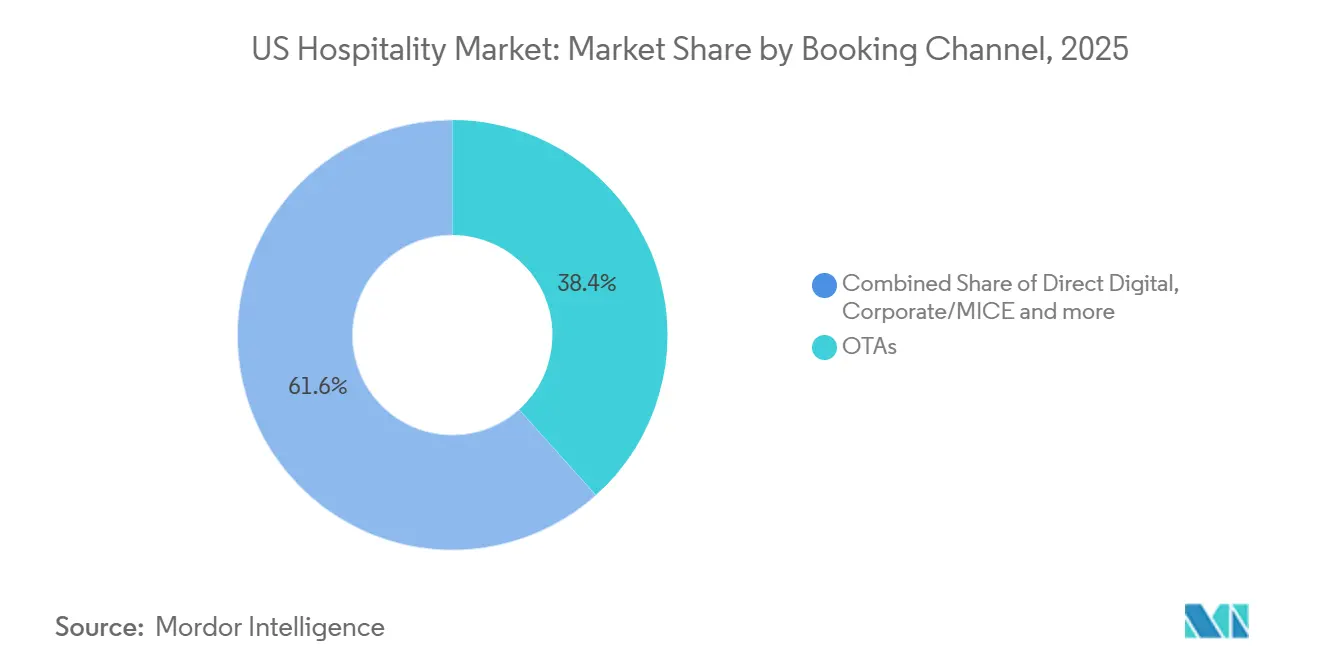
- By booking channel, OTAs captured a 38.37% share of bookings in the United States hospitality industry in 2025, while direct digital channels are projected to post the highest CAGR at 8.26% through 2031.
- By geography, the West region led with a 29.65% share of the United States hospitality industry in 2025, while the Northeast is expected to record the fastest CAGR at 8.26% through 2031.
Note: Market size and forecast figures in this report are generated using Mordor Intelligence’s proprietary estimation framework, updated with the latest available data and insights as of January 2026.
US Hospitality Market Trends and Insights
Drivers Impact Analysis*
| Driver | (~) % Impact on CAGR Forecast | Geographic Relevance | Impact Timeline |
|---|---|---|---|
| Strong Domestic Travel Demand | +1.2% | Global, with a concentration in secondary and warmer markets | Medium term (2-4 years) |
| Digitalization and Online Booking | +0.9% | Global, led by mobile penetration in urban centres | Short term (≤ 2 years) |
| Short-Term Rentals and Hybrid Models | +0.6% | United States, with concentration in urban gateway and resort markets; NYC regulatory reversal | Long term (≥ 4 years) |
| Experience-Driven Travel | +0.8% | Global, particularly high-net-worth segments in coastal and mountain resort corridors | Medium term (2-4 years) |
| Infrastructure and Airport Expansion | +0.7% | National, with early gains in Phoenix, Dallas-Fort Worth, Salt Lake City | Long term (≥ 4 years) |
| Government Support & Incentives | +0.3% | National, concentrated in FIFA World Cup host cities (Miami, Los Angeles, Dallas, Houston, Seattle) | Short term (≤ 2 years) |
| Source: Mordor Intelligence | |||
Strong Domestic Travel Demand
Domestic leisure spending remained a bright spot in 2025, with United States Travel indicating that outlays held firm as consumers prioritized trip plans and experiences despite broader cost pressures that affected discretionary budgets. Systemwide airline enplanements reached 76.8 million in September 2025, which reflects normalized travel patterns and an air demand base that helps support year-round lodging activity across primary and secondary markets.[1]U.S. Bureau of Transportation Statistics, “September 2025 US Airline Traffic Data,” U.S. DOT BTS, bts.gov Security checkpoint throughput surpassed 2.8 million daily passengers at several points in early January 2026, signalling sustained momentum at the start of the year and a positive read-through for short-haul and city-weekend lodging demand within the United States hospitality market.[2]Transportation Security Administration, “Travel Passenger Volumes,” TSA, tsa.gov As travel normalized, spending composition shifted more toward experiences and premium on-property offerings, which supported rate integrity in better-positioned assets that invest in wellness, dining, and cultural programming. This demand base helped stabilize the USA hospitality market through periods of economic uncertainty, with network effects from air capacity and road-trip patterns continuing to disperse travellers beyond traditional gateway hubs.
Digitalization and Online Booking
Mobile-first booking has become the prevailing workflow for hotel reservations, and hoteliers who align merchandising and UX to mobile journeys see higher conversion and better return on media spend. Direct engines benefit when loyalty rates are visible, when cart design reduces friction, and when retailing of add-ons is integrated at search and checkout, which supports a stronger direct mix in the United States hospitality market. Industry associations also point to digital drivers like personalization, first-party data capture, and optimized metasearch participation as core to sustaining owned bookings that reduce intermediary costs. As distribution stacks evolve into platform ecosystems, property teams apply layered tools for pricing, content, and retailing that integrate with PMS and CRM, which strengthens data-driven decisions across the customer journey. This digitalization trend supports the hospitality industry in the USA by improving the economics of demand capture and by enabling targeted offers that grow revenue per guest without sacrificing rate strategy.
Short-Term Rentals and Hybrid Models
Short-term rental regulation remains active, and national policy research confirms that local restrictions, tax changes, and registration systems continue to shape market outcomes in urban and resort communities. States and municipalities also adjust fiscal policy to address whole-home rental dynamics, illustrated by Rhode Island’s new 5% whole-home STR tax effective January 1, 2026, which sits alongside local hotel taxes and broadens parity across accommodation types that compete with hotels.[3]Rhode Island Association of Realtors, “New Short-Term Rental Laws Going into Effect January 1,” Rhode Island Realtors, rirealtors.org Hotels are responding through extended-stay offerings and serviced apartment formats that serve longer trips and corporate relocations, which diversifies demand and helps recapture share in categories where rentals previously had an advantage. As policy enforcement tightens in select jurisdictions, the United States hospitality market benefits from rechannelled demand during peak periods and events, especially where hotel inventory aligns with length-of-stay needs and proximity preferences for business and leisure travellers. Over the forecast period, the coexistence of STRs and hotels will continue to be shaped by compliance frameworks and traveller preferences, with hotels leveraging service consistency, loyalty value, and amenity access to compete in hybrid stay use cases.
Infrastructure and Airport Expansion
Federal programs that modernize airport terminals and related infrastructure help unlock long-run capacity, which supports room-night growth in gateway and secondary markets served by expanded air service. The Airport Terminals Program under the Infrastructure Investment and Jobs Act allocates USD 1 billion per year through 2026, with 2026 representing the final tranche for terminal upgrades and multimodal connections that ease bottlenecks.[4]U.S. Department of Transportation, “Airport Terminal Program,” U.S. DOT, transportation.gov Airports Council International, North America, estimates USD 173.9 billion in infrastructure needs for 2025 to 2029, and terminal projects represent a large share of those investments that directly affect traveller experience and throughput. Construction and airfield work can temporarily constrain operations, though near-term disruptions enable longer-term gains in capacity and reliability that benefit lodging demand tied to air traffic corridors. As these projects deliver, the United States hospitality market sees stronger connectivity that lifts visitation for business, meetings, and leisure across multiple regions.
Restraints Impact Analysis*
| Restraint | (~) % Impact on CAGR Forecast | Geographic Relevance | Impact Timeline |
|---|---|---|---|
| Elevated Labor Costs & Shortages in Gateway Markets | -0.7% | Global, most acute in high-wage coastal metros (New York, San Francisco, Los Angeles) | Medium term (2-4 years) |
| Rising Insurance & Climate-Risk Premiums for Coastal Properties | -0.5% | Coastal regions (Florida Gulf Coast, Louisiana, Southern California), with spillover to hurricane-prone corridors | Long term (≥ 4 years) |
| High Interest Rates Constraining Sub-300-Room New-Build Financing | -0.6% | National, with a disproportionate impact on independent developers and secondary markets | Medium term (2-4 years) |
| Regulatory Crackdown on Short-Term Rentals Compressing RevPAR | -0.4% | Urban centres with enforcement capacity (New York City, Los Angeles, San Francisco), expanding to mid-tier cities | Short term (≤ 2 years) |
| Source: Mordor Intelligence | |||
Elevated Labor Costs & Shortages in Gateway Markets
The leisure and hospitality sector continued to experience above-average unemployment rates relative to the overall economy at several points during 2025, which underscores ongoing frictions in hiring and retention across core property functions. Industry surveys point to persistent staffing shortages in hotels, with many operators citing housekeeping and guest services as the most difficult roles to fill. Wage growth and compliance complexity in high-cost cities raise operating baselines, which compress margins when room revenue growth is modest and when occupancy ebbs seasonally inside the United States hospitality market. Operators have responded with productivity improvements and targeted automation in back-of-house and guest-facing workflows, but the pace of cost relief depends on sustained gains in staffing stability and training outcomes. These labour dynamics remain most pronounced in gateway metros with higher minimum wages and scheduling requirements, which adds execution risk to independent assets with smaller teams and limited purchasing leverage.
Rising Insurance & Climate-Risk Premiums for Coastal Properties
Hotel owners report that insurance and other property-related operating expenses have risen, with coastal markets and weather-exposed regions facing the greatest pressure due to evolving risk models and carrier appetite. Broader construction and risk trends have also influenced project economics and underwriting standards in the past year, which raises diligence requirements for new-builds and complex renovations near flood or wildfire zones. Insurers continue to refine pricing in response to loss experience and forward risk assessments, and property owners often pair risk mitigation investments with adjusted deductible strategies to preserve coverage. These conditions affect valuation and financing pathways for coastal hospitality assets and increase the appeal of conversions over ground-up development in certain submarkets of the United States hospitality market. Over the long term, resilience planning and portfolio diversification remain central to managing exposure to climate-driven volatility in operating costs.
*Our forecasts treat driver/restraint impacts as directional, not additive. The impact forecasts reflect baseline growth, mix effects, and variable interactions.
Segment Analysis
By Type: Conversion Velocity Closes Independent-Brand Gap
Independent hotels held 63.38% of the base in 2025, while chain hotels are projected to grow at 7.73% through 2031, indicating that the United States hospitality market size by brand affiliation is shifting as conversions accelerate and brand systems demonstrate stronger demand capture. Brands support owners with reservation engines, loyalty ecosystems, and sales platforms that improve exposure to high-yield segments, which encourages independent owners to consider soft-brand options that preserve identity with lower transition friction. Global operators emphasize asset-light models that favour franchise and management contracts, creating scalable networks where brand standards and procurement leverage expand profitability over time for participating properties. The extended-stay category remains a resilient bridge between hotel and rental demand, and its flexible length-of-stay mix helps stabilize occupancy during shoulder periods in the United States hospitality market. As capital remains selective, the combination of conversion-readiness and loyalty access is likely to tilt owner decisions toward brands that offer speed to revenue and balanced franchise terms.
Conversion economics benefit most where brand systems can lift visibility in corporate channels and reduce distribution costs through direct marketing at scale, which can offset franchise fees through stronger occupancy and rate. Companies that reported a high proportion of openings from conversions highlighted owner demand for flexible collections that retain local character while unlocking global demand pools. Independent operators still compete effectively where product differentiation and local partnerships generate premium ADRs, although many are adopting digital tools for pricing, CRM, and retailing to protect share within the United States hospitality market. Extended-stay brands deepen their footprint by serving project crews, relocating families, and medical travel, which diversifies the mix and reduces cyclicality for both branded and independent portfolios. In the forecast window, the gap between brand and independent growth narrows as more independents adopt soft brands and as brands refine owner economics for sub-300-room conversions in secondary and tertiary markets.


By Accommodation Class: Premium Experiences Shield Luxury from Inflation
Mid and upper-midscale properties held a 47.73% share in 2025, while luxury is projected to grow at 6.47% through 2031, showing how the United States hospitality market size spans both value-focused and premium-led demand pools that together stabilize performance across cycles. Mid-tier brands benefit from consistent business travel, road-trip stays, and family travel, where rate integrity and included amenities remain central to purchase decisions. Luxury demand is buoyed by travellers who prioritize unique experiences and wellness-oriented stays, which supports ADR premiums and targeted pipeline expansion in high-barrier destinations within the United States hospitality market. As air capacity improves and event calendars fill, upper-midscale through upper-upscale assets gain from repeat corporate and group demand, while luxury resorts benefit from longer leisure stays tied to milestone travel. This barbell demand profile helps balance market risk and underpins the long-term growth narrative across classes.
Extended-stay offerings inside the midscale and upscale tiers continue to perform as durable profit centres, and they complement traditional room demand with longer-stay revenue that stabilizes occupancy during off-peak windows. Luxury portfolios invest in curated experiences and exclusive access programming, which secures loyalty from top-spend travellers and keeps rate discipline intact even as broader market growth moderates. Mid and upper-midscale brands, meanwhile, optimize direct booking, mobile UX, and email remarketing to hold share against OTA channels and preserve contribution margins within the United States hospitality industry. Lodging choices that merge convenience with amenity value continue to win repeat business at moderate price points, which supports a balanced trajectory for the class mix. The resulting class spread gives owners multiple levers to align product with local demand and to pursue incremental ADR through upgrades and package retailing.
By Booking Channel: Direct Digital Momentum Challenges OTA Dominance
OTAs captured 38.37% of bookings in 2025, yet direct digital channels are projected to post the fastest growth at 8.26% through 2031, which indicates a decisive push by brands and independents to strengthen owned demand capture within the United States hospitality market. Direct engines that deploy dynamic offers, loyalty recognition, and frictionless checkout increase conversion rates and lift revenue retention compared with intermediary channels. Mobile design and merchandising drive disproportionate gains as travellers plan and book on smartphones in greater numbers, which makes performance marketing and metasearch strategy central to the channel mix. Voice continues to matter for higher consideration stays and complex itineraries, and teams that instrument the voice channel capture incremental bookings and upsells at attractive conversion rates. Hotels that balance OTA reach with stronger direct loyalty funnels are best positioned to improve contribution margins and reduce reliance on discount-driven placements inside the hospitality industry in the USA.
Corporates and small groups increasingly expect self-service tools for simple meetings and short-lead events, and suppliers that enable digital RFPs and instant book for basic space and catering win a growing share of MICE demand. Direct booking benefits scale when CRM, PMS, and distribution platforms share data, which supports personalization and revenue optimization that protects rate while improving the guest journey. The United States hospitality industry is also adopting total-revenue retailing that bundles parking, late checkout, F&B credits, and experiences, which raises order value and reduces cancellation risk in direct channels. Vendors and associations highlight the importance of first-party data capture and consent frameworks that comply with privacy rules while enabling lifecycle marketing. As these practices become standard, channel profitability improves and strengthens the long-term economics of demand generation.

Geography Analysis
The West region led with a 29.65% share in 2025, while the Northeast is projected to deliver the fastest growth at 8.26% through 2031, which shows how regional dynamics balance rate leadership with growth pipelines across the United States hospitality market. California’s statewide lodging demand remains supported by diversified visitor flows and a strong events outlook, which helps stabilize performance as the international mix continues to recover. In Chicago, hotels set a record for summer room demand in 2025, underscoring resilient urban travel tied to conventions and leisure in a market that benefits from air hub connectivity. San Diego’s consistent convention calendar and diversified economic base supported solid occupancy in mid-2025 as hotels leveraged business travel and year-round leisure demand. These examples highlight how market positioning and air access shape city-level performance inside the United States hospitality market.
Northeast performance is buoyed by destination strength in New York and Boston, along with the institutional and medical anchors that stabilize demand through academic and healthcare calendars. As airport modernizations progress, airside and landside improvements expand throughput for large and medium hubs that feed business and leisure visitation into Northeastern corridors. In the West, coastal and tech-centric markets continue to lead on ADR, although financing conditions and operating costs temper new-supply risk, which preserves pricing power for well-located assets. The Southeast benefits from in-migration and warm-weather leisure, and select Florida markets sustain strong resort demand that supports ADR even as growth normalizes from prior peaks. Across regions, air travel strength and event calendars are pivotal to the dispersion of demand that underpins the United States hospitality market over the forecast period.
Competitive Landscape
The sector remains fragmented across tens of thousands of properties, which limits any single operator’s ability to set pricing across markets and reinforces the importance of distribution, loyalty, and owner economics. Leading companies highlight asset-light growth models that scale through management and franchise agreements, and they continue to emphasize conversion momentum as a core source of net unit growth. Reports note that a significant share of openings at some global operators derive from conversions, reflecting owners' appetite for established systems that deliver reservation flow and procurement leverage in the United States hospitality market. Direct booking strategies that leverage loyalty recognition remain central to distribution economics, which helps brands and independents improve contribution margins while sustaining rate. At the same time, extended-stay platforms diversify the mix and stabilize occupancy through longer-stay customers ranging from project crews to relocating families.
Strategic moves in 2025 emphasized lifestyle growth and brand extensions that align with traveller preferences for design-forward and experience-rich stays. Wyndham introduced Dazzler Select by Wyndham to expand lifestyle presence in urban and resort destinations, which complements its broader brand portfolio and strengthens appeal with younger demographics. Choice Hotels highlighted strong development momentum and portfolio integration initiatives that expand its reach in extended-stay and upscale segments, while reinforcing its franchise capabilities with owners. Ultra-luxury operators showcased curated experiences and bespoke travel programs that deepen loyalty and justify ADR premiums in top-tier destinations within the United States hospitality market. These moves underscore a broad competitive focus on differentiated products, scaled distribution, and owner value propositions supported by technology investments.
Digital tools for merchandising, inventory management, and retailing are now table stakes for efficient growth. Vendors and associations stress the importance of first-party data, mobile UX, and integrated tech stacks that allow hotels to personalize offers, raise order value, and improve conversion in direct channels. The sector’s operating playbook also prioritizes resilience planning that addresses cost variability in labour and property-related expenses, which favours scalable brands and independent operators with strong local positioning. As financial conditions gradually ease, conversion pipelines and selective development in high-barrier markets are expected to lead to net supply additions, with owner decisions guided by brand support, fee structures, and total return potential in the United States hospitality market. Overall, competitive intensity remains high, and success correlates with distribution strength, conversion-readiness, and experience design that captures premium willingness to pay.
US Hospitality Industry Leaders
Marriott International
Hilton Worldwide
Wyndham Hotels & Resorts
InterContinental Hotels Group (IHG)
Choice Hotels International Inc.
- *Disclaimer: Major Players sorted in no particular order

Recent Industry Developments
- October 2025: Wyndham Hotels & Resorts launched Dazzler Select by Wyndham to expand in lifestyle-led city and resort locations with a focus on design, local culture, and flexible social spaces.
- October 2025: The Hilton Jacksonville at Mayo Clinic, an eight-story, 252-room hotel on the Mayo Clinic Florida campus, commenced operations with a ribbon-cutting ceremony. Developed by Concord Hospitality Enterprises and Whitman Peterson in partnership with Mayo Clinic, the 148,000-square-foot property is Jacksonville's first new full-service hotel in nearly 20 years, offering premium hospitality near the hospital.
- July 2025: Marriott International completed its acquisition of citizenM (citizenM Operations Holding B.V.) for approximately USD 355 million, adding the design-focused, tech-enabled lifestyle brand to its portfolio to attract younger travellers (Millennials/Gen Z) with its unique blend of art, communal spaces, and efficient design, expanding Marriott's presence in key urban markets and integrating citizenM's 37 global properties into the Marriott Bonvoy loyalty program after full system integration.
- January 2025: Choice Hotels International celebrated a year of development success, highlighting expansion initiatives and brand momentum across key segments in the United States hospitality market.


US Hospitality Market Report Scope
The hospitality industry encompasses businesses and establishments primarily providing accommodation, food and beverage services, entertainment, event planning, and other related services to travelers, tourists, and local patrons. The US hospitality industry is segmented by type and segment. By type, the market is segmented into chain hotels and independent hotels. The market is segmented into service apartments, budget, and economy hotels, mid and upper-mid-scale hotels, and luxury hotels. The report offers market size and forecasts for the US hospitality industry in value (USD) for all the above segments.
By Type
| Chain Hotels |
| Independent Hotels |
By Accommodation Class
| Luxury |
| Mid & Upper-Midscale Hotels |
| Budget & Economy |
| Service Apartments |
By Booking Channel
| Direct Digital |
| OTAs |
| Corporate/MICE |
| Wholesale & Traditional Agents |
By Geography
| Northeast |
| Southeast |
| Midwest |
| Southwest |
| West |
| By Type | Chain Hotels |
| Independent Hotels | |
| By Accommodation Class | Luxury |
| Mid & Upper-Midscale Hotels | |
| Budget & Economy | |
| Service Apartments | |
| By Booking Channel | Direct Digital |
| OTAs | |
| Corporate/MICE | |
| Wholesale & Traditional Agents | |
| By Geography | Northeast |
| Southeast | |
| Midwest | |
| Southwest | |
| West |


Key Questions Answered in the Report
What is the current size and growth outlook for the United States hospitality market?
The US hospitality market size stands at USD 247.81 billion in 2026 and is projected to reach USD 305.53 billion by 2031 at a 4.28% CAGR.
Which booking channels are expected to gain the most share through 2031 in the United States hospitality industry?
Direct digital channels are projected to grow the fastest with an 8.26% CAGR, while OTAs held a 38.37% share in 2025.
Which United States region is likely to grow the fastest over the forecast period?
The Northeast is projected to deliver the fastest growth at an 8.26% CAGR through 2031, while the West led with a 29.65% share in 2025.
How are airport investments influencing the United States hospitality market?
The FAA’s Airport Terminals Program funds terminal upgrades through 2026, and ACI–NA estimates USD 173.9 billion in airport infrastructure needs for 2025 to 2029, which strengthens air access and supports hotel demand.
Which accommodation classes are leading performance in the United States?
Mid and upper-midscale held a 47.73% share in 2025, while luxury is projected to grow at 6.47% through 2031, reflecting a barbell of value and experience-driven demand.
Page last updated on:


