Sustainable And Recyclable Packaging Equipment Market Size and Share
Market Overview
| Study Period | 2019 - 2030 |
|---|---|
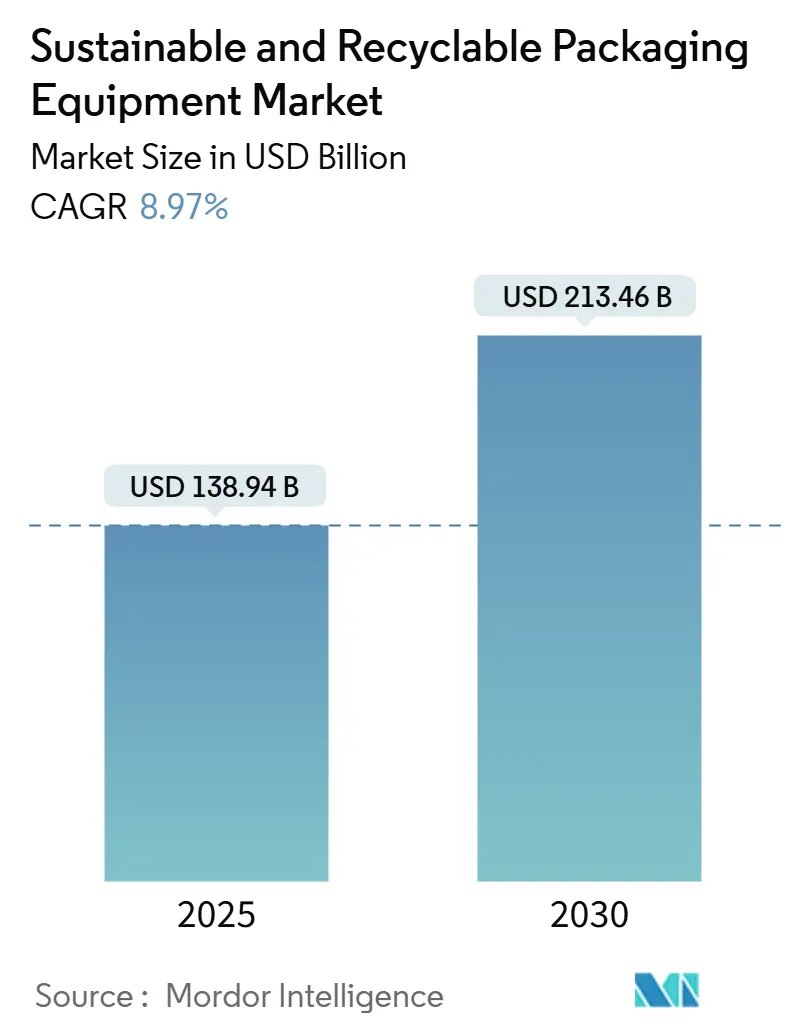
| Market Size (2025) | USD 138.94 Billion |
| Market Size (2030) | USD 213.46 Billion |
| Growth Rate (2025 - 2030) | 8.97% CAGR |
| Fastest Growing Market | Asia Pacific |
| Largest Market | Asia Pacific |
| Market Concentration | Medium |
Major Players *Disclaimer: Major Players sorted in no particular order Image © Mordor Intelligence. Reuse requires attribution under CC BY 4.0. | |
Sustainable And Recyclable Packaging Equipment Market Analysis by Mordor Intelligence
The sustainable and recyclable packaging equipment market size reached USD 138.94 billion in 2025 and is forecast to achieve USD 213.46 billion by 2030, advancing at an 8.97% CAGR through the period. Regulatory mandates on recycled-content handling, expanding circular-economy investments, and intense corporate ESG commitments are reshaping capital-spending priorities.[1]European Commission, “Packaging and Packaging Waste Regulation-Recycled Content Requirements,” EUROPA.EU Brands are shortening equipment replacement cycles, equipment makers are redesigning machines for fibre and mono-material substrates, and investors are rewarding vendors that embed advanced automation and AI in every node of the packaging line. Competitive dynamics are sharpening as conglomerates acquire robotics specialists, while technology firms move downstream into packaging applications. Growth headwinds persist in the form of high upfront retrofit costs, fragmented recycling infrastructure in several emerging economies, and shortages of skilled technicians able to commission and maintain fully‐automatic systems.
Key Report Takeaways
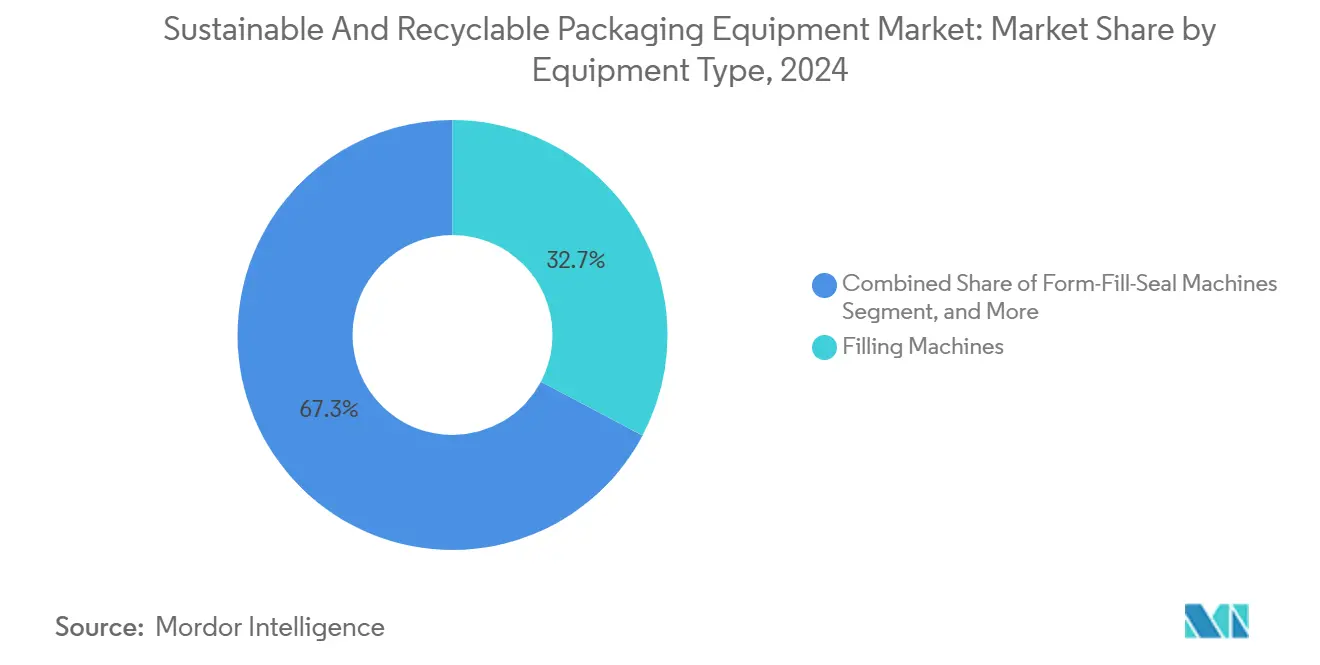
- By equipment type, the filling machines segment captured 32.74% of the sustainable and recyclable packaging equipment market share in 2024.
- By automation level, the sustainable and recyclable packaging equipment market size for fully automatic systems is projected to grow at a 10.52% CAGR between 2025–2030.
- By machine function, the primary packaging segment captured 39.73% of the sustainable and recyclable packaging equipment market share in 2024.
- By end-user industry, the food applications segment captured 41.23% of the sustainable and recyclable packaging equipment market share in 2024.
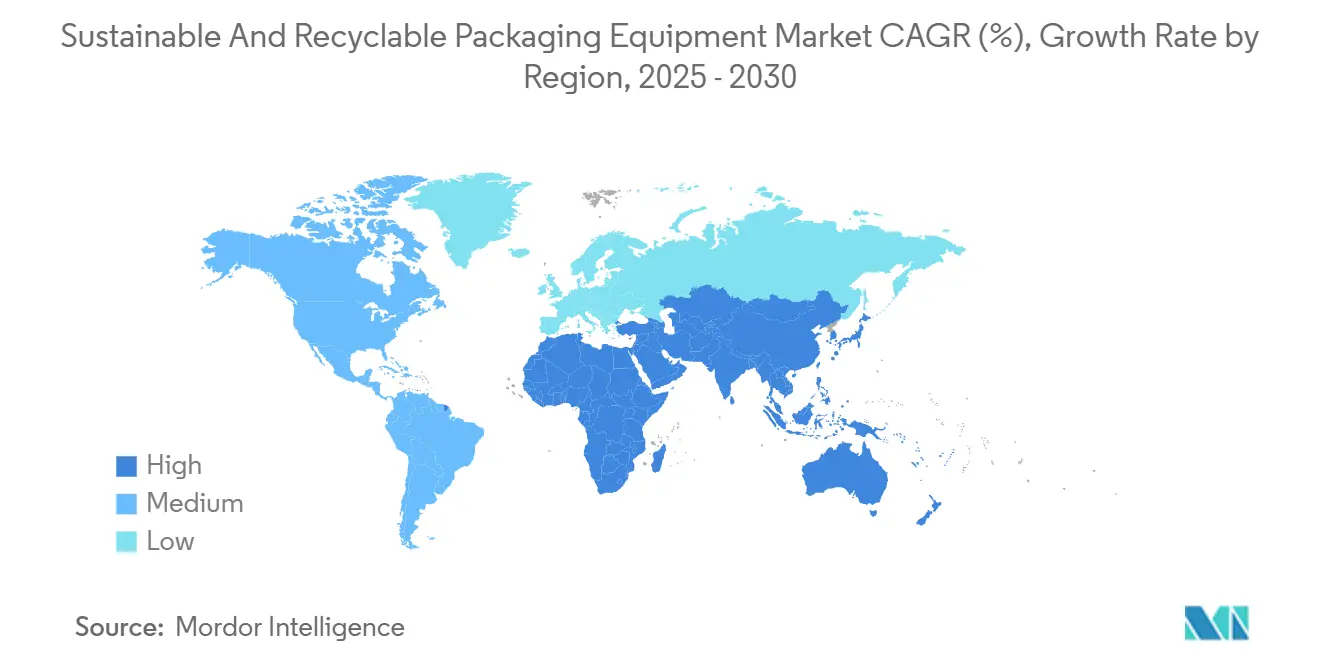
- By region, the sustainable and recyclable packaging equipment market size for Asia-Pacific is projected to grow at a 10.37% CAGR between 2025–2030.
Global Sustainable And Recyclable Packaging Equipment Market Trends and Insights
Drivers Impact Analysis*
| Driver | (~) % Impact on CAGR Forecast | Geographic Relevance | Impact Timeline |
|---|---|---|---|
| Regulatory mandates on recycled-content machinery | +2.1% | Europe and North America, expanding to Asia-Pacific | Medium term (2-4 years) |
| Shift to fibre and mono-material packaging lines | +1.8% | Global, early adoption in EU and North America | Long term (≥ 4 years) |
| Brand ESG targets driving rapid CAPEX cycles | +1.6% | Global, concentrated in developed markets | Short term (≤ 2 years) |
| Automation retrofits that cut material waste | +1.4% | North America and EU, spill-over to Asian hubs | Medium term (2-4 years) |
| AI-enabled quality-inspection boosting yield | +1.2% | Asian manufacturing, expanding globally | Long term (≥ 4 years) |
| Reshoring and near-shoring of packaging plants | +0.9% | North America and EU, selective Asia-Pacific | Medium term (2-4 years) |
| Source: Mordor Intelligence | |||
Regulatory mandates on recycled-content machinery
Governments that legislated minimum recycled-content thresholds are dictating how equipment must handle variable-quality feedstock. The European Union’s Packaging and Packaging Waste Regulation requires capability for 65% recycled content by 2030, and California’s SB-54 compels 25% recycled content by 2032. Manufacturers are therefore redesigning dosing, sealing and vision systems so lines accommodate contamination, color variance and fluctuating mechanical properties. Companies are deploying identical lines across plants to avoid multi-standard complexity, converting what began as a compliance task into a global specification baseline. The result is a USD 8 billion retrofit wave now underway, pulling forward orders that might otherwise have landed late in the decade.
Shift to fibre and mono-material packaging lines
Fibre-based and mono-material flexible formats require distinct melting points, sealing pressures and barrier-coating technologies compared with legacy multi-layer plastics. In 2024 Tetra Pak invested USD 200 million to create fibre-carton production lines able to eliminate polymer barriers entirely.[2]Tetra Pak International S.A., “Annual Report 2024 – Sustainable Packaging Solutions,” TETRAPAK.COM Equipment OEMs report 30% higher design complexity, but early-mover orders rose 45% year-over-year as brands phase out mixed-material laminates. The European Single-Use Plastics Directive is a catalyst, yet North American converters are equally active, anticipating export-market rules.
Brand ESG targets driving rapid CAPEX cycles
Consumer-goods majors accelerated replacement cycles from 10-12 years to 6-8 years, channeling capital into lines that improve recycled-content handling and lower energy intensity. Unilever allocated USD 1.2 billion in 2024, while Procter & Gamble committed USD 800 million, straining OEM capacity and lengthening delivery to 18 months. This temporary demand spike exceeds the sustainable and recyclable packaging equipment market’s organic trajectory, illustrating how investor pressure can override traditional depreciation logic.
Automation retrofits that cut material waste
Retrofit kits servo-driven drives, real-time tension controls and closed-loop dosing allow incumbent lines to cut raw-material over-use by 6-10% and pay back within two years. North American food processors led initial deployments, and Europe quickly followed as energy-savings regulation tightened. Spill-over to Asian contract-packing hubs is now visible as multinational customers harmonize procurement policies.
Restraints Impact Analysis*
| Restraint | (~) % Impact on CAGR Forecast | Geographic Relevance | Impact Timeline |
|---|---|---|---|
| High upfront cost of sustainability retrofits | -1.9% | Global, particularly SMEs in emerging markets | Short term (≤ 2 years) |
| Fragmented recycling infrastructure in emerging markets | -1.3% | Emerging markets, spill-over effects globally | Long term (≥ 4 years) |
| Safety and performance limits of new materials | -0.8% | Global, concentrated in regulated industries | Medium term (2-4 years) |
| Skilled-labor shortages for advanced lines | -0.7% | North America and EU, expanding to Asia-Pacific | Medium term (2-4 years) |
| Source: Mordor Intelligence | |||
High upfront cost of sustainability retrofits
Sustainability-ready lines command 25-40% premiums compared with legacy machines. Payback can stretch to five years where feedstock savings are marginal or energy is subsidized. Small and medium enterprises in currency-volatile regions struggle to secure green financing despite multilateral lenders’ initiatives. OEMs now offer leasing and modular upgrades, yet adoption remains slow among cash-constrained converters.
Fragmented recycling infrastructure in emerging markets
Uneven collection and contamination rates complicate equipment design. For instance, packaging processors in India must size washing and sorting modules for rural collection rates as low as 15% while simultaneously meeting urban feedstock throughput of 65%. This lowest-common-denominator engineering inflates total cost of ownership and discourages rapid diffusion of high-spec machinery.
*Our forecasts treat driver/restraint impacts as directional, not additive. The impact forecasts reflect baseline growth, mix effects, and variable interactions.
Segment Analysis
By Equipment Type: Filling Machines Anchor Installed Base While Form-Fill-Seal Gains Momentum
Filling machines maintain a 32.74% foothold because liquids and semi-liquids still represent high-volume, hygiene-critical applications. Within subsegments, servo-controlled fillers that minimize product giveaway are outselling mechanical cam systems as processors chase gram-level accuracy. The sustainable and recyclable packaging equipment market size for filling solutions is projected to expand steadily as dairy, beverage and pharmaceutical users layer recycled-content handling into existing SKUs. Parallel to that, form-fill-seal (FFS) units show 11.27% CAGR as e-commerce drives demand for lightweight, flexible pouches that integrate forming, dosing and sealing steps. FFS lines reduce footprint by up to 30% and allow quick changeovers between bio-based films, improving operational agility. Labeling and coding equipment growth is linked to traceability mandates for recycled content verification, reinforcing the move toward fully digital presses.
FFS vendors are integrating ultrasonic sealing heads to accommodate mono-material laminates whose melting windows differ from multi-layer composites. Investments by OEMs such as Syntegon USD 150 million earmarked for AI-enabled fillers signal that material-handling complexities are being tackled through algorithmic control rather than mechanical over-engineering. Sealing and wrapping equipment face downward pressure in applications where binding agents and shrink films are replaced with paper-based alternatives, yet demand revives when those machines evolve to process compostable films certified under ISO 14855.


By Automation Level: Semi-Automatic Prevalence Meets Fully Automatic Upswing
Semi-automatic solutions occupy 46.32% of the sustainable and recyclable packaging equipment market share because they marry affordability and operator oversight. SMEs in South America and Southeast Asia embrace these lines to manage diverse SKU portfolios without massive capital commitments. However, fully automatic systems are advancing at 10.52% CAGR as labor costs climb and hygiene regulations tighten. Pharmaceutical fillers installed in 2025 feature zero-touch changeovers and inline sterilization, virtually eliminating human intervention. Hybrid architectures dominate the upgrade path: motion-controlled platforms handle core processes, whereas manual visual checks cover cosmetics-critical surfaces until vision AI becomes mainstream.
Beckhoff reports 35% rise in demand for modular motion controllers that let processors add or remove robotic pick-and-place stations incrementally. The skilled-labor shortage in North America incentivizes facilities to accelerate full automation, yet many opt for staged deployments to manage integration risk. As payback periods compress with reducer overfill and defect scrap, full automation gains traction beyond high-volume categories
By Machine Function: Primary Packaging Visibility Versus Secondary Logistics Efficiency
Primary equipment forming, filling, capping, sealing captures 39.73% share because it directly interfaces with the product and the consumer. Sustainability credentials, such as recycled content logos or fiber-based aesthetics, are communicated here. Nonetheless, secondary packaging is growing fast as e-commerce obliges distribution centers to right-size corrugated cartons using AI algorithms that trim board usage by 8-12%. Vendors now offer integrated primary-secondary cells where a single HMI coordinates pouch forming and case packing, shrinking line length and reducing pallet movements.
Tertiary Packaging, though niche, supports closed-loop pallet, tote and dunnage systems championed by automotive and electronics OEMs. As reverse-logistics platforms mature, tertiary lines will need to de-nest, sanitize and re-stack reusable assets, further expanding the sustainable and recyclable packaging equipment market. For now, uptake remains limited by missing return flows in many consumer channels.

By End-User Industry: Food Retains Lead While E-Commerce Surges
Food applications deliver 41.23% of 2024 revenue, buoyed by stringent safety standards and retailer scorecards that score suppliers on recycled content. Retort-pouch upgrades in ready-meals and aseptic fillers for plant-based beverages are headline areas. E-commerce and logistics, however, is the fastest-growing end-user at 11.53% CAGR. Fulfillment centers seek paper-based cushioning dispensers, on-demand box makers and print-on-box coding to cut void fill and shipping emissions.
Beverage processors continue to transition away from PVC shrink sleeves toward mono-material PET and tethered-cap requirements, demanding new applicators and inspection systems. Pharmaceutical equipment installations rise on the back of serialization and traceability mandates, now extended to recycled blister packs. Personal-care converters explore small-batch, high-graphic lines for refill formats, reshaping job scheduling and necessitating rapid clean-in-place cycles. Industrial component makers, such as auto parts suppliers, adopt returnable totes with RFID tags, triggering investment in wash-dry inspection cells that align with circular packaging KPIs.
Geography Analysis
Asia-Pacific owns 38.29% of global revenue and is projected to grow at 10.37% CAGR to 2030, underpinned by China’s USD 15 billion circular-economy infrastructure fund and India’s Production-Linked Incentive program for sustainable machinery. Regional OEM clusters supply drive motors and sensors at competitive cost, enabling local integrators to bundle turnkey lines for exporters. Rising wages in China and Thailand accelerate demand for robotic palletizers, an area where Japanese and Korean vendors have a regional foothold.
North America benefits from the U.S. Inflation Reduction Act, which grants tax credits for energy-efficient equipment and domestic manufacturing.[3] U.S. Internal Revenue Service, “Inflation Reduction Act Manufacturing Incentives,” IRS.GOV Plant expansions linked to reshoring of consumer-goods brands propel fresh orders. Canada’s Extended Producer Responsibility schemes feed a secondary market for retrofit modules that verify recycled content at the filler. Europe, meanwhile, leads regulatory ambition; 65% recycled-content mandates force converters to upgrade earlier than peers elsewhere, and that expertise later diffuses worldwide. European OEMs consequently capture price premiums for compliance-ready lines.
South America experiences equipment import jumps tied to agrifood export growth. Brazil logged a 25% increase in sustainable filler imports in 2024 as soy-drink processors pivot to fibre cartons. Middle East and Africa attract greenfield investments in beverage and personal-care factories, but infrastructure gaps energy reliability, recycling collection dampen immediate uptake. Multilateral agencies channel concessional finance into these markets, yet currency swings elevate repayment risk and slow order books.

Competitive Landscape
The sustainable and recyclable packaging equipment market features mid-level concentration. Incumbents such as Tetra Pak, Krones and Syntegon wield service networks and installed bases that lock in repeat upgrades. Technology specialists FANUC, Beckhoff, ABB win share where advanced robotics and AI modules define purchasing criteria.
Consolidation is brisk: Coesia acquired flexible-packaging expert Hugo Beck for USD 180 million in 2025 to bolster e-commerce portfolios, and Krones bought SACMI’s beverage unit for USD 280 million to secure tether-cap capability. Strategic playbooks fall into three camps: integrated line vendors, automation technology providers, and cost-focused regional OEMs.
Start-ups push material-agnostic extruders and digital twin software, forcing incumbents to add cloud-based OEE dashboards via partnerships like Syntegon’s USD 200 million pact with Microsoft. White space persists in modular retrofit kits for SME converters lacking cash for whole-line replacement. The race now centers on who can bundle compliance, efficiency and data analytics into one platform without bloating capex.
Sustainable And Recyclable Packaging Equipment Industry Leaders
Syntegon Technology GmbH
Coesia S.p.A.
Tetra Pak International S.A.
Krones AG
IMA Industria Macchine Automatiche S.p.A.
- *Disclaimer: Major Players sorted in no particular order

Recent Industry Developments
- September 2025: Tetra Pak committed USD 400 million for a Vietnam facility producing fibre-based carton equipment, targeting 100% recycled-content capability.
- August 2025: Krones closed a USD 280 million purchase of SACMI’s beverage packaging division, adding AI quality-control modules.
- July 2025: FANUC launched an AI robotics platform that cuts defects up to 30% and optimizes material use.
- June 2025: Syntegon and Microsoft formed a USD 200 million alliance to deliver cloud-based monitoring and predictive maintenance.


Global Sustainable And Recyclable Packaging Equipment Market Report Scope
| Filling Machines |
| Sealing Machines |
| Form-Fill-Seal Machines |
| Wrapping Machines |
| Other Equipment Types |
| Manual |
| Semi Automatic |
| Fully Automatic |
| Primary Packaging |
| Secondary Packaging |
| Tertiary Packaging |
| Food |
| Beverage |
| Pharmaceutical |
| Personal Care and Cosmetics |
| E-commerce and Logistics |
| Others End-user Industry |
| North America | United States | |
| Canada | ||
| Mexico | ||
| South America | Brazil | |
| Argentina | ||
| Chile | ||
| Rest of South America | ||
| Europe | United Kingdom | |
| Germany | ||
| France | ||
| Italy | ||
| Spain | ||
| Russia | ||
| Rest of Europe | ||
| Asia-Pacific | China | |
| India | ||
| Japan | ||
| South Korea | ||
| Australia | ||
| Rest of Asia-Pacific | ||
| Middle East and Africa | Middle East | Saudi Arabia |
| United Arab Emirates | ||
| Turkey | ||
| Rest of Middle East | ||
| Africa | South Africa | |
| Nigeria | ||
| Rest of Africa | ||
| By Equipment Type | Filling Machines | ||
| Sealing Machines | |||
| Form-Fill-Seal Machines | |||
| Wrapping Machines | |||
| Other Equipment Types | |||
| By Automation Level | Manual | ||
| Semi Automatic | |||
| Fully Automatic | |||
| By Machine Function | Primary Packaging | ||
| Secondary Packaging | |||
| Tertiary Packaging | |||
| By End-user Industry | Food | ||
| Beverage | |||
| Pharmaceutical | |||
| Personal Care and Cosmetics | |||
| E-commerce and Logistics | |||
| Others End-user Industry | |||
| By Geography | North America | United States | |
| Canada | |||
| Mexico | |||
| South America | Brazil | ||
| Argentina | |||
| Chile | |||
| Rest of South America | |||
| Europe | United Kingdom | ||
| Germany | |||
| France | |||
| Italy | |||
| Spain | |||
| Russia | |||
| Rest of Europe | |||
| Asia-Pacific | China | ||
| India | |||
| Japan | |||
| South Korea | |||
| Australia | |||
| Rest of Asia-Pacific | |||
| Middle East and Africa | Middle East | Saudi Arabia | |
| United Arab Emirates | |||
| Turkey | |||
| Rest of Middle East | |||
| Africa | South Africa | ||
| Nigeria | |||
| Rest of Africa | |||


Key Questions Answered in the Report
What is the projected value of the sustainable and recyclable packaging equipment market by 2030?
The market is forecast to reach USD 213.46 billion by 2030 on the back of an 8.97% CAGR.
Which region currently leads sales of sustainable and recyclable packaging equipment?
Asia-Pacific accounted for 38.29% of global revenue in 2024 and is also the fastest-growing region.
Which equipment type is expanding the quickest?
Form-fill-seal machines show the highest growth at 11.27% CAGR through 2030, driven by flexible e-commerce formats.
How are regulatory mandates influencing new machinery design?
EU and U.S. laws require lines that can process high recycled-content substrates, pushing OEMs to redesign dosing, sealing and vision systems.
Why are fully automatic systems gaining traction?
Rising labor costs and hygiene rules in high-volume sectors shorten ROI on robotics, accelerating adoption of fully automatic packaging lines.
What is the main financing obstacle for SMEs adopting sustainable equipment?
25-40% price premiums and limited access to green loans extend payback periods, deterring smaller converters from immediate retrofits.
Page last updated on:


