Sustainable Plastic Packaging Market Size and Share
Market Overview
| Study Period | 2020 - 2031 |
|---|---|
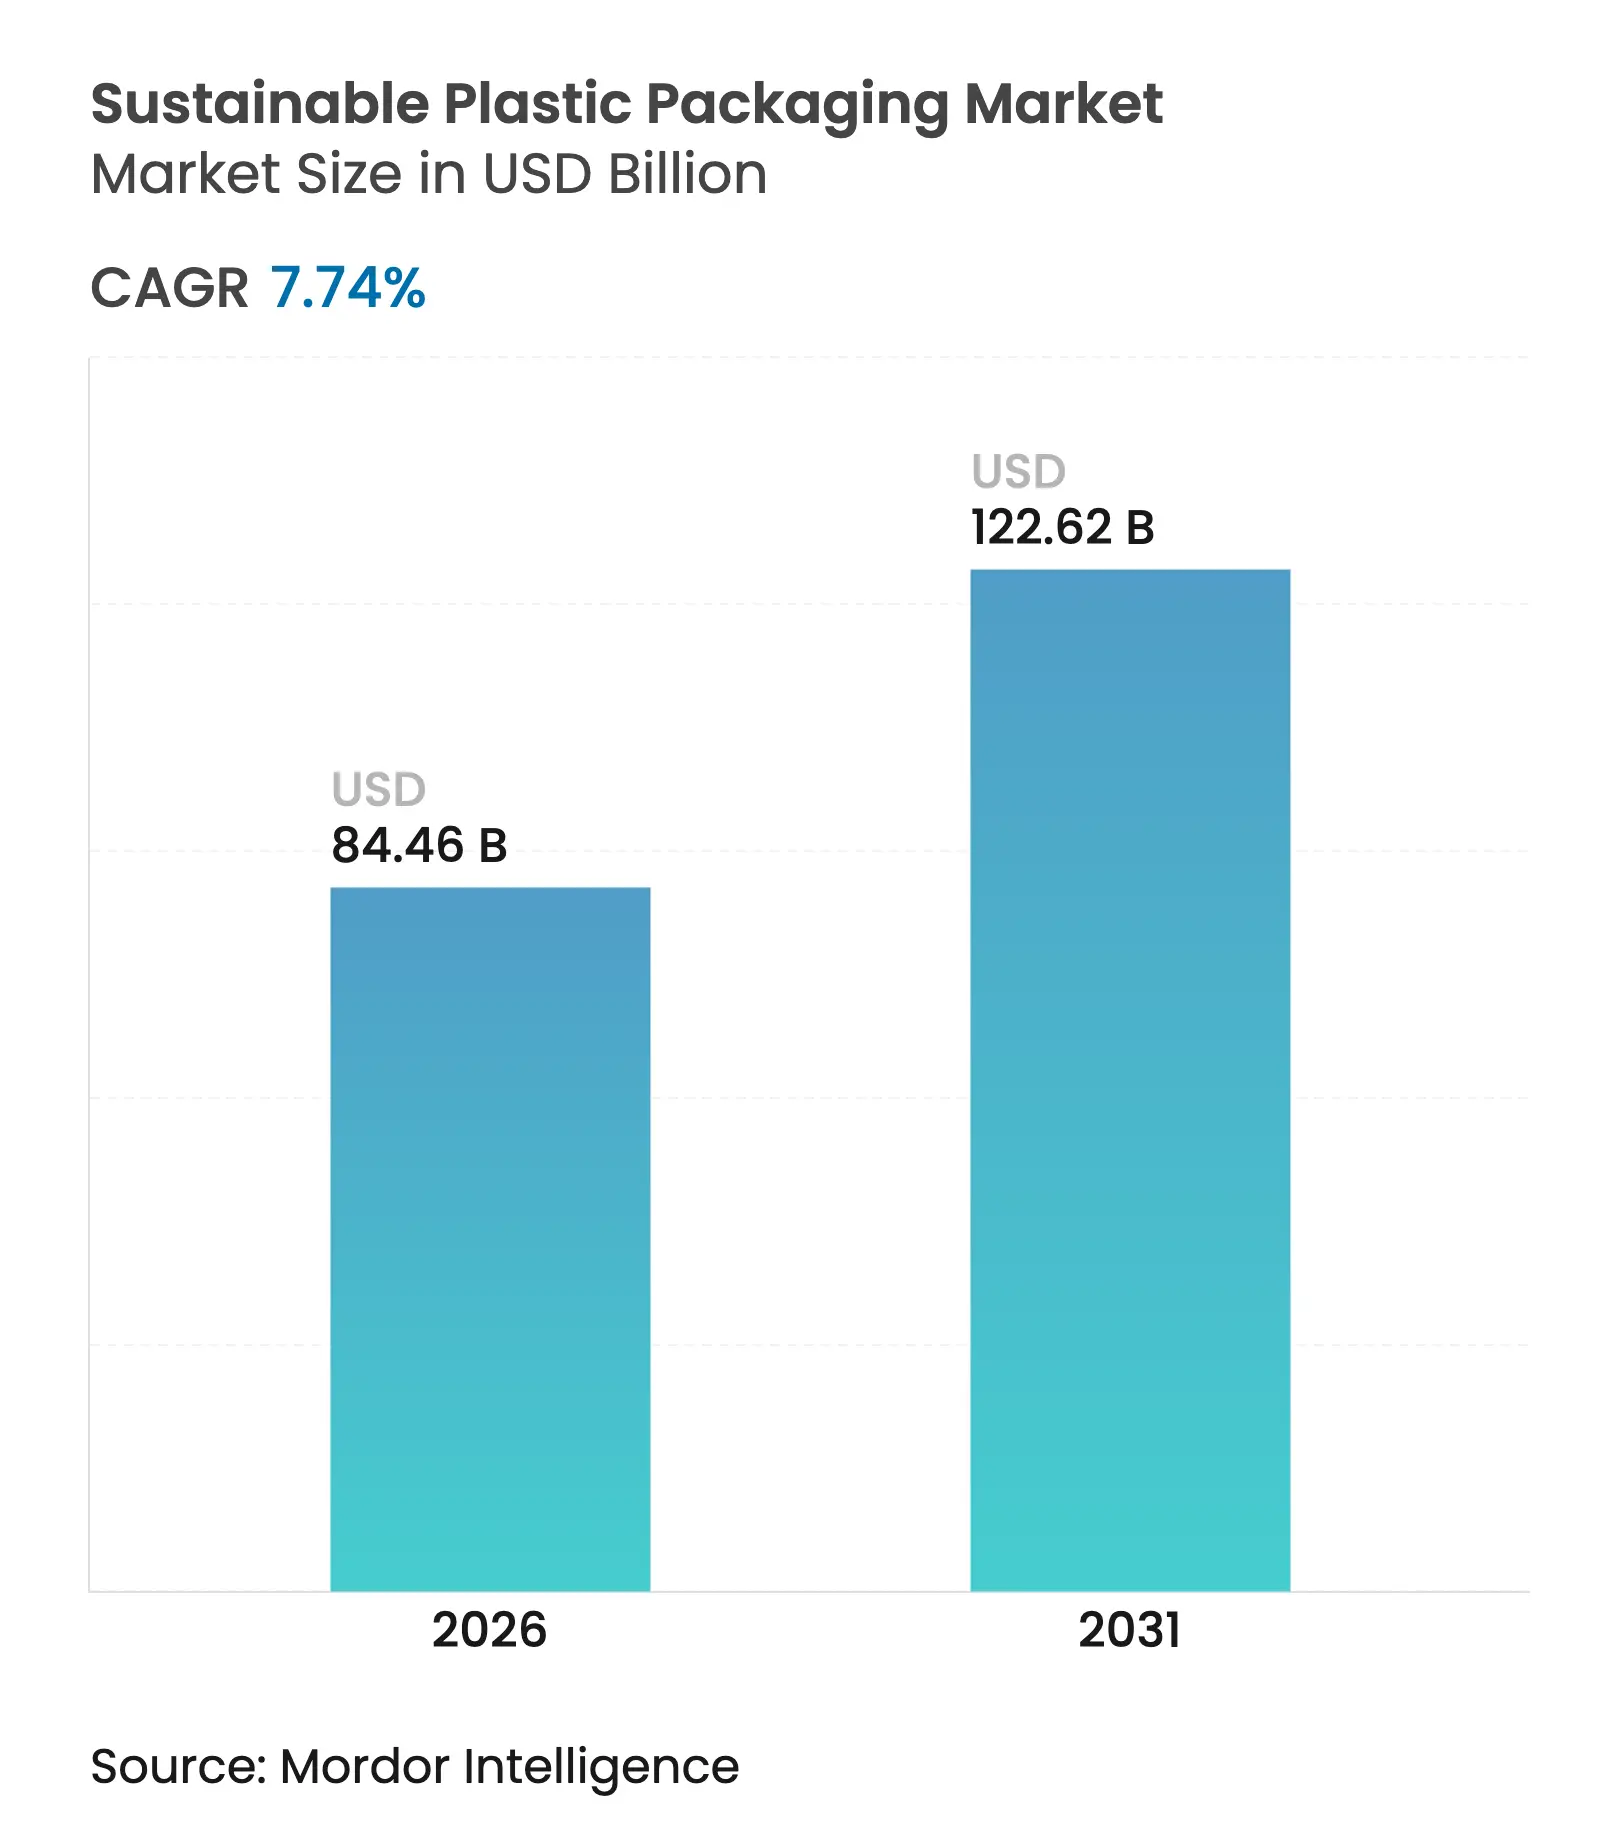
| Market Size (2026) | USD 84.46 Billion |
| Market Size (2031) | USD 122.62 Billion |
| Growth Rate (2026 - 2031) | 7.74 % CAGR |
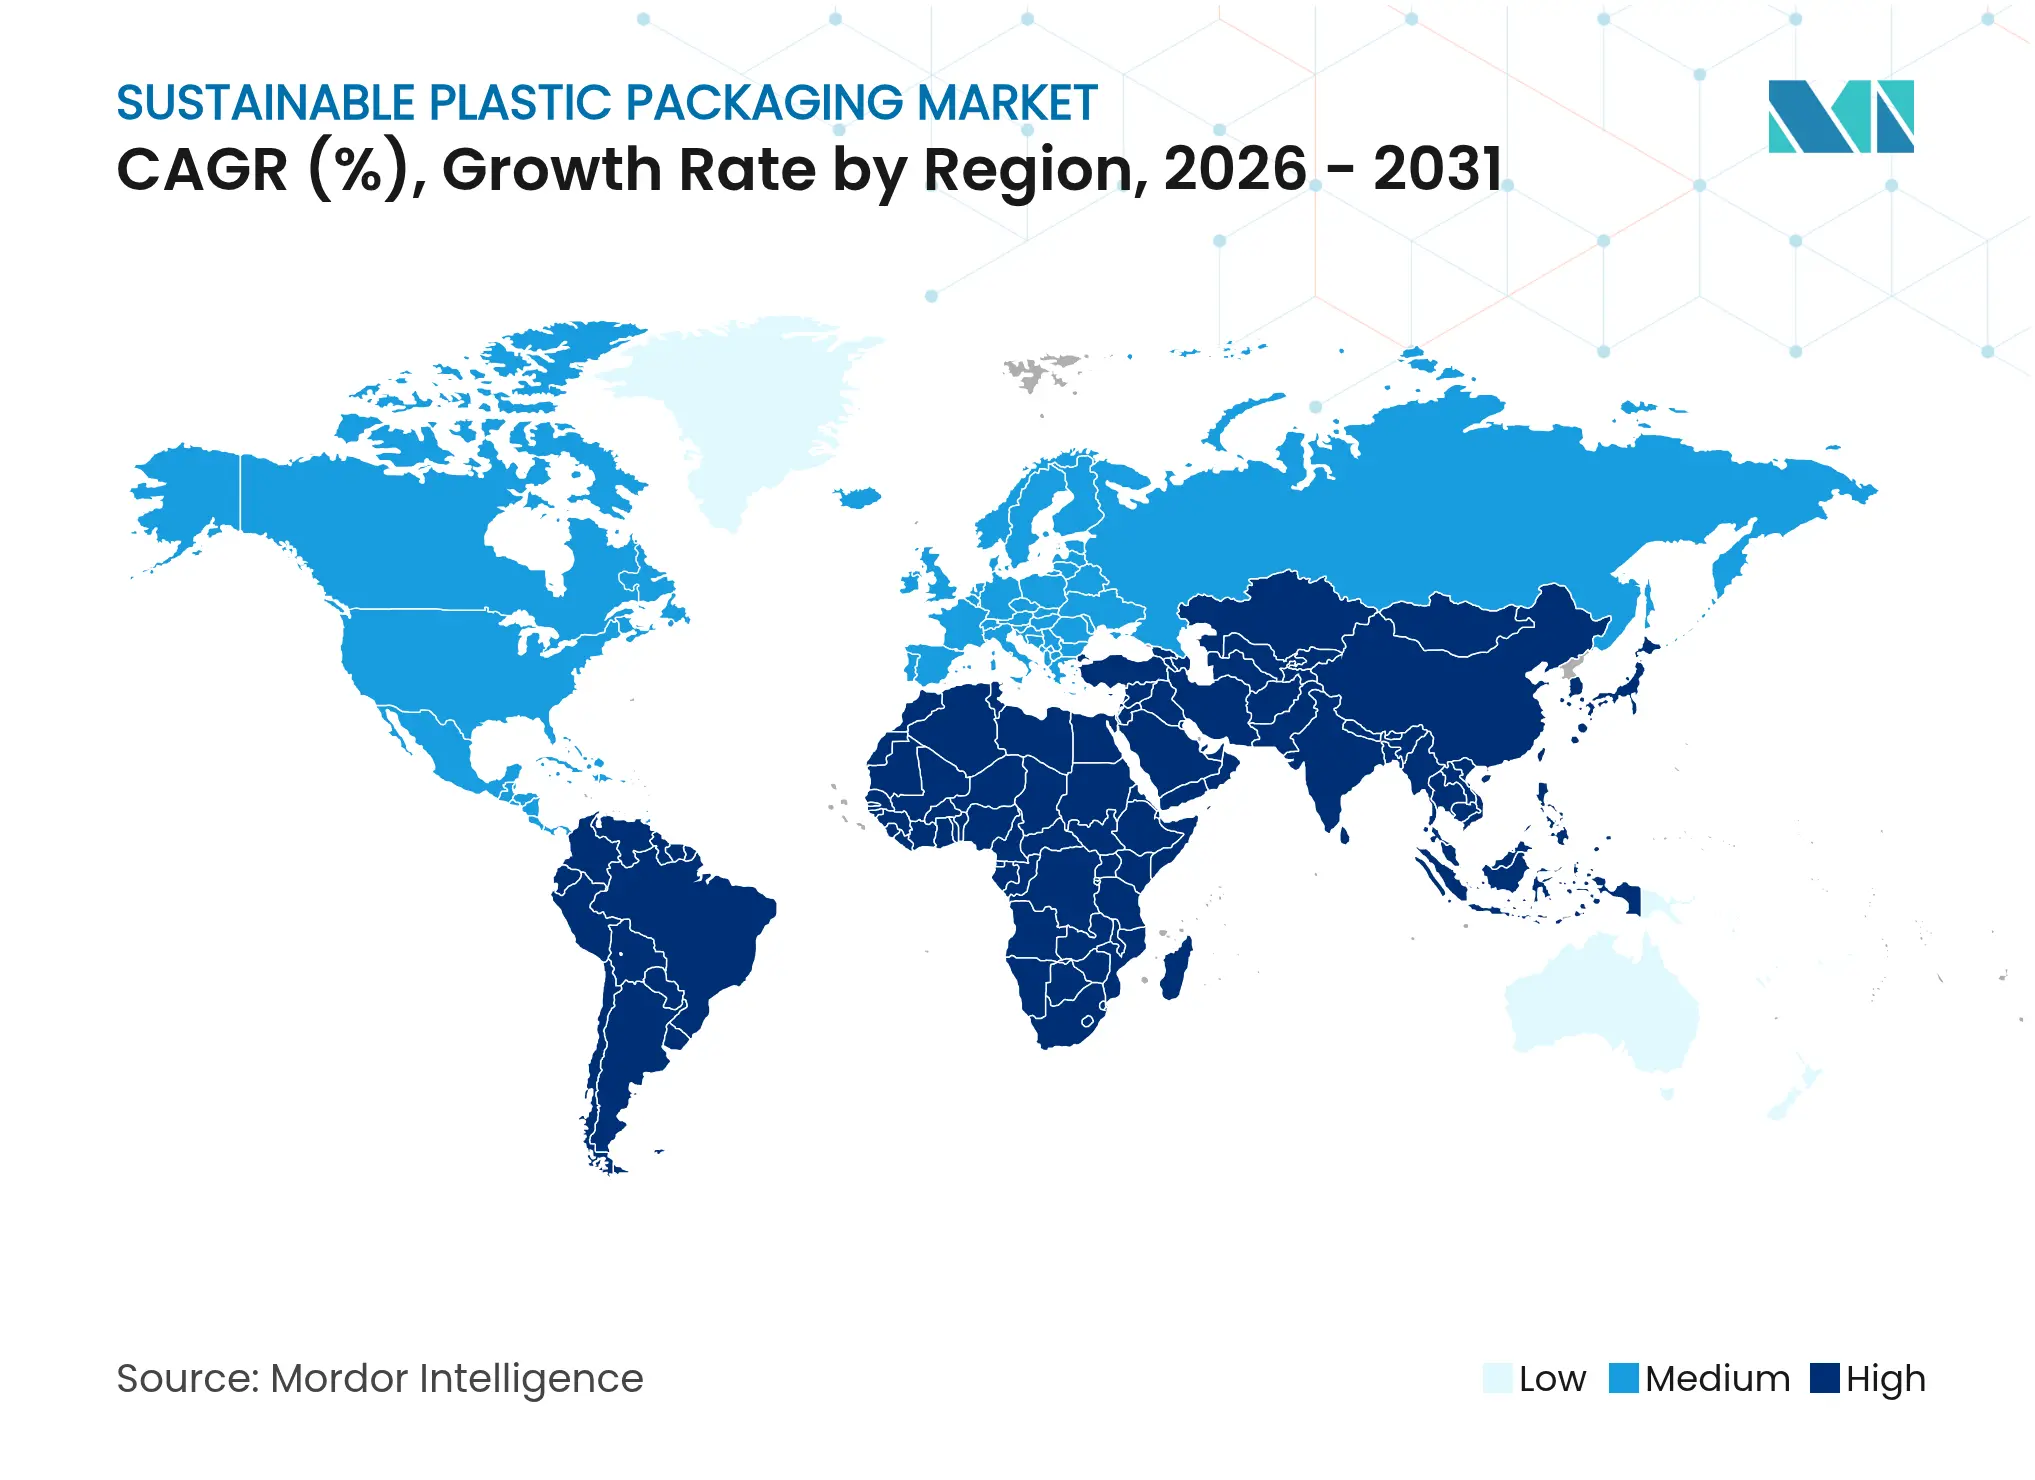
| Fastest Growing Market | Asia Pacific |
| Largest Market | Europe |
| Market Concentration | Low |
Major Players *Disclaimer: Major Players sorted in no particular order. Image © Mordor Intelligence. Reuse requires attribution under CC BY 4.0. |
Sustainable Plastic Packaging Market Analysis by Mordor Intelligence
Sustainable plastic packaging market size in 2026 is estimated at USD 84.46 billion, growing from 2025 value of USD 78.39 billion with 2031 projections showing USD 122.62 billion, growing at 7.74% CAGR over 2026-2031. Intensifying global regulations, especially the EU Packaging and Packaging Waste Regulation that targets full recyclability by 2030, are raising baseline demand for circular materials. Brand-owner targets to halve virgin-plastic use, rapid PFAS phase-outs in 12 US states, and the roll-out of chemical-recycling approvals for food-grade PET have shifted capital toward rPET and bio-polymer capacity expansions. Cost-parity breakthroughs—most notably enzyme-based depolymerization validated by the US National Renewable Energy Laboratory—signal a path to equal or lower costs than virgin resin, strengthening the long-term competitiveness of circular formats. Meanwhile, e-commerce growth is reshaping protective-packaging designs, pulling demand for lightweight mono-material structures that lower logistics emissions and align with Extended Producer Responsibility (EPR) fees.
Key Report Takeaways
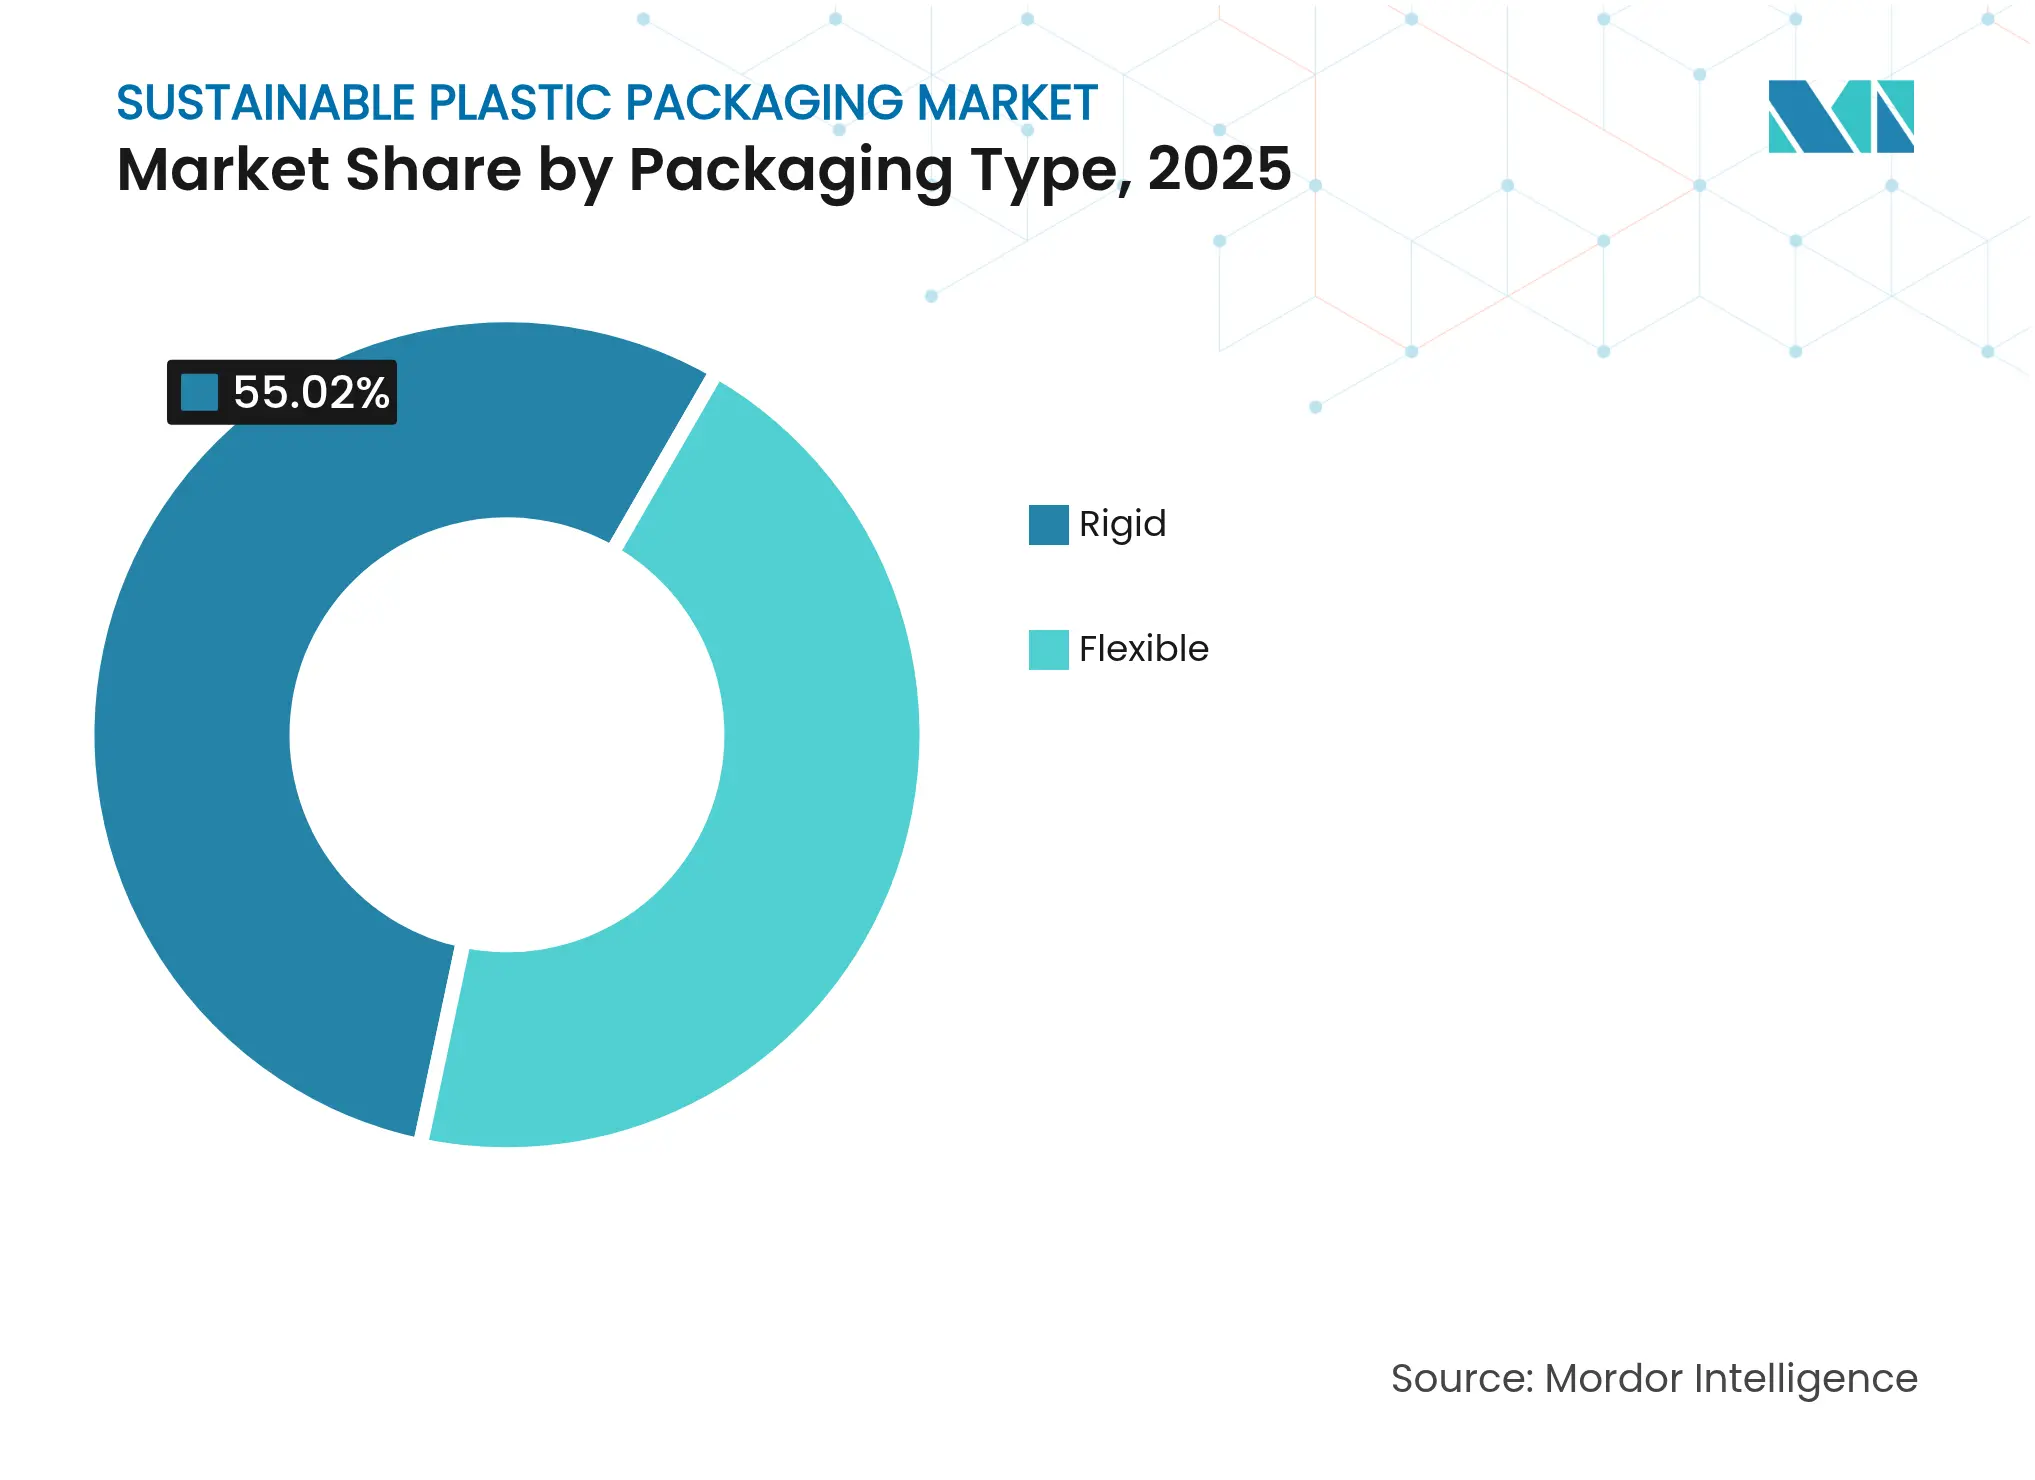
- By packaging type, rigid formats led with 55.02% of the sustainable plastic packaging market share in 2025, while flexible formats are forecast to expand at a 9.12% CAGR to 2031.
- By packaging format, primary packaging held 59.76% share of the sustainable plastic packaging market size in 2025, whereas tertiary packaging is advancing at an 10.92% CAGR through 2031.
- By process type, recyclable systems retained 40.55% share in 2025; refill and concentrate systems record the highest projected CAGR at 12.08% to 2031.
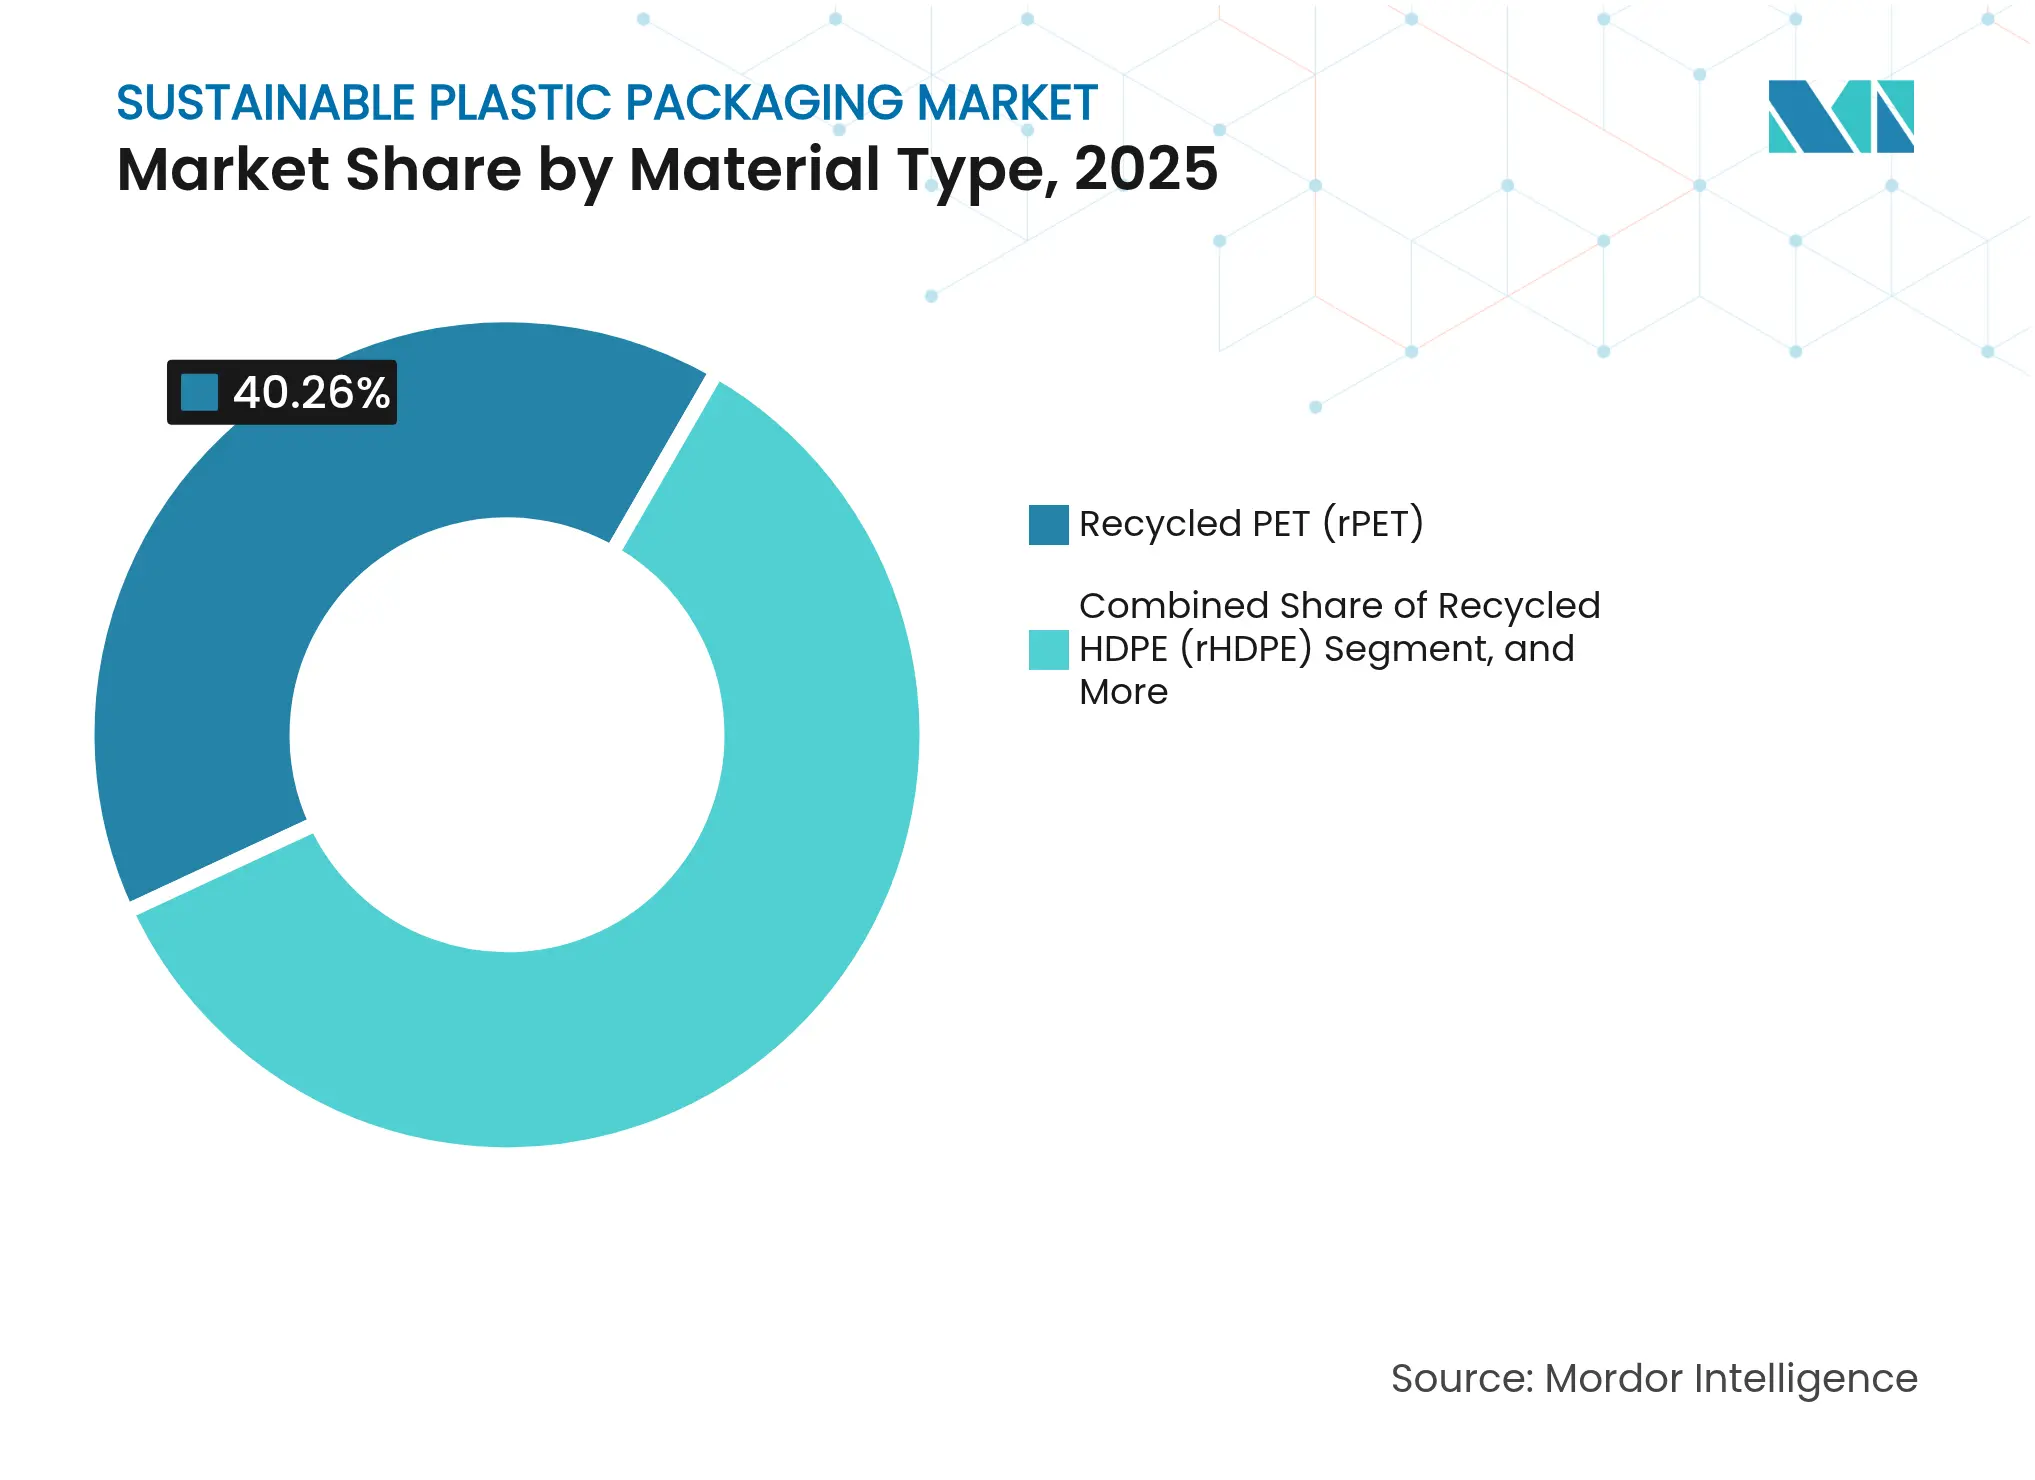
- By material, rPET commanded 40.26% share in 2025 and PHA exhibits the fastest 12.41% CAGR outlook.
- By end-use industry, food & beverage accounted for 35.42% in 2025; healthcare & pharmaceuticals is rising at an 11.47% CAGR.
- By geography, Europe captured 37.84% revenue share in 2025, whereas Asia-Pacific is projected to grow at a 10.43% CAGR through 2031.
Note: Market size and forecast figures in this report are generated using Mordor Intelligence's proprietary estimation framework, updated with the latest available data and insights as of 2026.
Global Sustainable Plastic Packaging Market Trends and Insights
Drivers Impact Analysis
| Driver | (~) % Impact on CAGR Forecast | Geographic Relevance | Impact Timeline | |||
|---|---|---|---|---|---|---|
Stringent single-use plastic regulations
Stringent single-use plastic regulations
| +2.1% | Global; EU and North America leading | Medium term (2-4 years) |
(~) % Impact on CAGR Forecast
:
+2.1%
|
Geographic Relevance
:
Global; EU and North America leading
|
Impact Timeline
:
Medium term (2-4 years)
|
Rising consumer eco-consciousness
Rising consumer eco-consciousness
| +1.8% | Global; strongest in developed markets | Long term (≥ 4 years) | |||
Brand-owner circular-economy targets
Brand-owner circular-economy targets
| +1.5% | Global; concentrated in multinationals | Medium term (2-4 years) | |||
E-commerce protective-packaging shift
E-commerce protective-packaging shift
| +1.2% | Global; APAC and North America core | Short term (≤ 2 years) | |||
Chemical recycling enabling food-grade rPET
Chemical recycling enabling food-grade rPET
| +0.9% | North America & EU; expanding to APAC | Medium term (2-4 years) | |||
Net-zero Scope-3 pressures on bio-based resin
Net-zero Scope-3 pressures on bio-based resin
| +0.7% | Global; large corporations | Long term (≥ 4 years) | |||
| Source: Mordor Intelligence | ||||||
Stringent Single-Use Plastic Regulations
Mandatory recycled-content quotas in the EU and India compel converters to secure rPET supply and redesign packs for full recyclability. Ganesha Ecopet’s 42,000-tonne bottle-to-bottle expansion exemplifies how regulations create captive feedstock demand that lifts the sustainable plastic packaging market. PFAS bans add design constraints, accelerating adoption of new barrier chemistries that align with the EU’s 25 ppb limits effective 2026. QR-code traceability rules further force digital labeling upgrades, reinforcing life-cycle data transparency across the sustainable plastic packaging market.
Rising Consumer Eco-Consciousness
Survey data show 73% of US shoppers perceive compostable packaging as sustainable. Brand responses range from Kraft Heinz’s 100% rPET mayonnaise bottles that eliminate 14 million lb of virgin resin annually to Palmolive’s Shake & Clean concentrate that cuts plastic waste by 75%. Younger cohorts’ willingness to refill drives subscription models like På(fyll), which reports 80% CO₂ reductions versus single use. Consumer pressure, therefore, remains a sustaining tailwind for the sustainable plastic packaging market through 2030.
Brand-Owner Circular-Economy Targets
Unilever aims to cut virgin-plastic use 50% by 2025, pushing supply chains toward refillable deodorant formats and fully recycled body-wash containers. Coca-Cola and PepsiCo finance chemical-recycling pilots to secure rPET feedstock, while Tetra Pak invests in mono-material barrier papers. Such commitments underwrite long-term offtake agreements that stabilize returns on capital for recyclers and bio-polymer plants, deepening the sustainable plastic packaging market’s investment base.
E-commerce Protective-Packaging Shift
Surging e-commerce volumes demand mono-material cushioning, molded-pulp inserts, and origami-style mailers that eliminate additional dunnage. Corrugated cardboard and molded pulp substitute traditional stretch film in secondary and tertiary layers, aligning with retailers’ climate-neutral shipping pledges. SIG’s bag-in-box lines for concentrates extend shelf life while reducing total material weight, demonstrating how logistics and sustainability goals converge within the sustainable plastic packaging market.
Restraints Impact Analysis
| Restraint | (~) % Impact on CAGR Forecast | Geographic Relevance | Impact Timeline | |||
|---|---|---|---|---|---|---|
Cost premium vs. conventional packaging
Cost premium vs. conventional packaging
| −1.4% | Global; pronounced in price-sensitive markets | Short term (≤ 2 years) |
(~) % Impact on CAGR Forecast
:
−1.4%
|
Geographic Relevance
:
Global; pronounced in price-sensitive markets
|
Impact Timeline
:
Short term (≤ 2 years)
|
Inadequate waste-management infrastructure
Inadequate waste-management infrastructure
| −0.8% | APAC, MEA, Latin America | Long term (≥ 4 years) | |||
LCA scrutiny of certain bio-polymers
LCA scrutiny of certain bio-polymers
| −0.6% | North America & EU; expanding globally | Medium term (2-4 years) | |||
Feedstock volatility for advanced recycling
Feedstock volatility for advanced recycling
| −0.4% | Global; chemical-recycling hubs | Short term (≤ 2 years) | |||
| Source: Mordor Intelligence | ||||||
Cost Premium vs. Conventional Packaging
Circular grades often cost 15-30% more due to scale limits and collection costs. Governments counter this barrier via funds such as Australia’s USD 140 million Recycling Modernisation Fund that subsidizes reprocessing capacity. US EPA modeling indicates USD 36.5-43.4 billion in infrastructure upgrades could equalize finished resin costs over time by boosting yield and lowering transport inefficiencies.[1]U.S. Environmental Protection Agency, “Financial Estimates to Modernize Material Recovery Infrastructure,” epa.gov Cost-relief policies therefore remain pivotal in sustaining the sustainable plastic packaging market’s trajectory.
Inadequate Waste-Management Infrastructure
Many developing regions lack curb-side collection and sortation for multilayer flexibles. Queensland’s USD 30 million resource-recovery grants seek 80% waste diversion by 2030 and illustrate the capital intensity required to unlock true circularity. Fluorescent PRISM labels that facilitate 96% purity in PET sortation show how technology can mitigate infrastructure gaps in the sustainable plastic packaging market.
Segment Analysis
By Packaging Type: Rigid Dominance Meets Flexible Innovation
Rigid formats delivered 55.02% of the sustainable plastic packaging market in 2025 due to beverage bottles, food jars, and pharma vials that require high-barrier performance. Sidel’s IntelliADJUST in-line inspection improves chill-fill bottle integrity while maximizing rPET inclusion, reinforcing rigid leadership within the sustainable plastic packaging market.Rigid solutions also exploit existing deposit-return systems, further raising closed-loop collection rates and protecting brand equity.
Flexible packaging, expanding at a 9.12% CAGR, capitalizes on material-efficiency and shelf-ready printing advantages. Klöckner Pentaplast’s 95% PE barrier film reduces thickness by 75% yet retains seal integrity, illustrating how mono-material science unlocks flexibles’ recyclability. Lightweight pouches slash transport emissions, and e-commerce retailers prioritize flat-mailer designs that cut dimensional weight. As a result, flexibles steadily chip away at rigid applications such as sauces and cleaning liquids through concentrate sachets.
Note: Segment shares of all individual segments available upon report purchase
By Packaging Format: Primary Focus Drives Tertiary Growth
Primary packs held 59.76% of the sustainable plastic packaging market size in 2025, as brand visibility and direct food contact demand compliant materials and premium printing. PFAS bans spur R&D toward bio-based coatings, encouraging converters to switch to aqueous and mineral-based barriers. Consumer-facing packs also integrate digital ID codes, aiding traceability and deposit returns.
Tertiary formats, led by corrugated and molded-pulp cushioning, are projected to grow 10.92% CAGR through 2031. The boom in parcel shipping forces logistics players to cut void-fill while preserving damage rates. Recyclable stretch-wrap alternates and shrink-film elimination programs exemplify tertiary innovation. Retail distribution centers trial mono-material LDPE films that melt back into pallet-strap feedstock, cementing tertiary layers as a strategic growth lever inside the sustainable plastic packaging market.
By Process Type: Recyclable Foundation Enables Refill Revolution
Recyclable process types commanded 40.55% share in 2025, bolstered by PET bottle-to-bottle loops. Fluorescent sortation technologies now push recycled PET purity levels to 96%, expanding food-grade applications and ensuring regulatory compliance.
Refill and concentrate systems rise at a 12.08% CAGR, illustrating how waste-prevention outpaces traditional recycle-after-use logic. Mean Green’s dual-chamber cleaner replaces four conventional bottles, cutting material and freight costs by more than 60%. Grocery chains pilot stainless-steel dispenser stations, and direct-to-consumer beauty brands ship water-free tablets, embedding reuse deeper in the sustainable plastic packaging market’s value chain.

Recognized by Experts. Trusted by Leaders.
A trusted intelligence partner to global decision-makers across 90+ countries.


By Material Type: rPET Leadership Faces Bioplastic Challenge
rPET delivered 40.26% of the sustainable plastic packaging market share in 2025 thanks to bottle collection infrastructure, FDA letters of no-objection, and large converters’ investment pipelines such as Indorama’s 100-kiloton Indian joint venture. Recycled HDPE gains traction in personal-care refills, cementing recycled-content credibility among mainstream categories.
PHA’s 12.41% CAGR outlook is driven by marine biodegradability and compostable certification that mitigate micro-plastic leakage. PLA’s runway benefits from Balrampur Chini’s USD 240 million, 75,000-tonne plant that turns sugarcane stock into industrial bioplastic, diversifying feedstock risk. The material spectrum thus widens as converters chase regulatory carve-outs and consumer premiums, keeping the sustainable plastic packaging market dynamic.
Note: Segment shares of all individual segments available upon report purchase
By End-Use Industry: Food & Beverage Stability Meets Healthcare Innovation
Food & beverage preserved 35.42% share in 2025. Deposit schemes for carbonated beverages, FDA resin certifications, and supermarket sustainability pledges maintain steady demand. Plant-based bottle pilots by leading soft-drink groups amplify consumer awareness, bolstering adoption rates for recycled and bio-based content.
Healthcare & pharmaceuticals, expanding at an 11.47% CAGR, leverages wood-based bottles from UPM-SELENIS and closed-loop vial recovery by SCHOTT Pharma. Strict sterility norms push multilayer barrier innovation, and as regulators accept validated recycling loops for medical plastics, healthcare emerges as a high-margin frontier within the sustainable plastic packaging market.
Geography Analysis
Europe retained 37.84% revenue share in 2025. EPR fees, the PPWR 2030 recyclability mandate, and PFAS limits converge to accelerate design-for-recycling. Companies such as Axens commercialize Rewind® PET technology that scales chemical recycling across EU clusters, ensuring feedstock security. Deposit-return programs in Germany and the Nordics collect more than 90% of beverage containers, reinforcing the region’s circular infrastructure advantage.
Asia-Pacific posts a 10.43% CAGR to 2031, propelled by India’s recycled-content rules, significant middle-class consumption growth, and capacity expansions for rPET and biopolymers. Balrampur Chini’s PLA plant and multiple bottle-grade rPET lines indicate capital flows that embed circularity early in the region’s development curve. China’s 2025 white-list for advanced recycling and Japan’s tax incentives for bio-based polymers further catalyze the sustainable plastic packaging market in APAC.
North America shows steady uptake as 12 states enact PFAS bans and the US EPA mobilizes USD 117 million for recycling grants. Brand programs such as Palmolive’s refillable concentrate and Kraft Heinz’s 100% rPET jars build consumer trust. South America and the Middle East & Africa contribute incremental growth but must overcome collection deficits; targeted aid and private-public partnerships aim to bridge these gaps and unlock latent demand for the sustainable plastic packaging market.

Competitive Landscape
Market Concentration
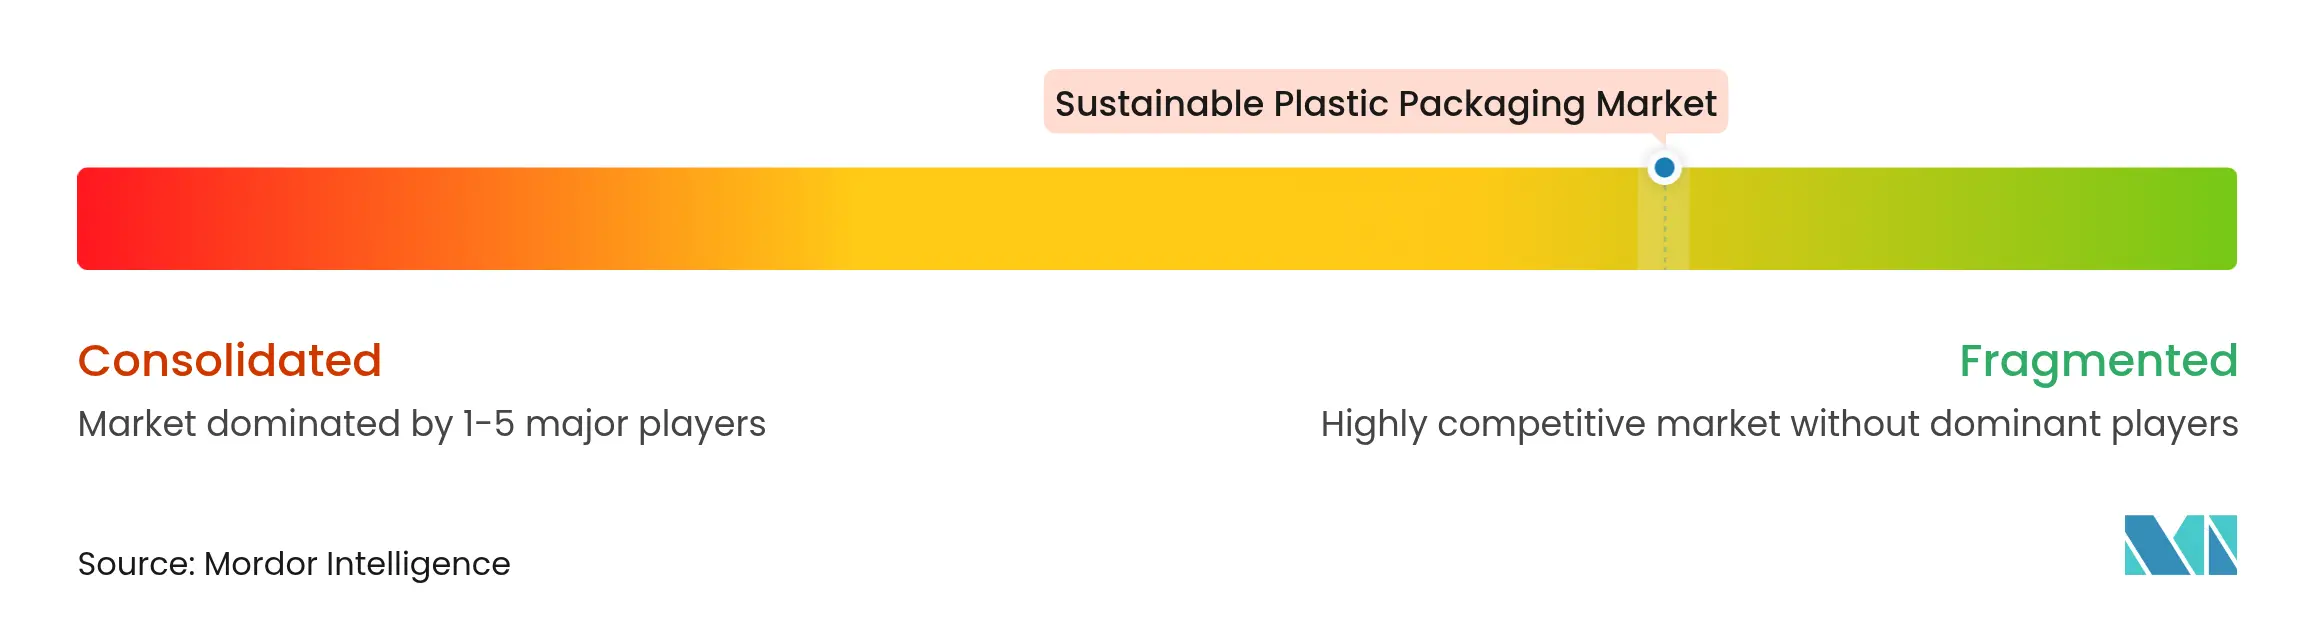
Competition remains moderate, with diversified incumbents and agile specialists coexisting. Amcor, Huhtamaki, and Sealed Air leverage global footprints and integrated resin sourcing to service multinational brands. Sealed Air’s net-zero 2040 pledge and 54% bio-based meat trays underscore its move toward value-based differentiation.[3]Sealed Air Corporation, “Net-Zero Carbon Emissions Goal,” sealedair.comVertical integration protects margin in volatile resin markets and accelerates speed-to-market for new substrates.
Disruptors such as Denovia, Mura Technology, and Alterra pursue chemical-recycling breakthroughs that slash energy input or accelerate depolymerization. Neste’s alliance with Alterra and Technip Energies to standardize 600-kiloton advanced-recycling facilities reduces project-development risk and expands hard-to-recycle feedstock coverage.
Niche players specializing in refill hardware, enzymatic recycling, or PHA fermentation capture high-margin contracts with personal-care and healthcare brands. Retailers integrate forward-contracts to guarantee post-consumer resin supply, demonstrating how feedstock security has become a strategic lever inside the sustainable plastic packaging market. As chemical-recycling yields climb and enzyme-based PET costs achieve parity, traditional price leadership gives way to technology-led competition.
Sustainable Plastic Packaging Industry Leaders

*Disclaimer: Major Players sorted in no particular order
Recent Industry Developments
- June 2025: National Renewable Energy Laboratory research shows enzyme-based PET recycling can reach cost parity with virgin materials.
- May 2025: Dow and Mura Technology outline a 600-kiloton HydroPRS™ advanced-recycling build-out across the US and EU.
- April 2025: Lavazza introduces Tablì, a packaging-free single-serve coffee system requiring no secondary packaging.
- March 2025: University of Oxford scientists devise fluoride-recovery from PFAS, creating a dual environmental and resource benefit.
Table of Contents for Sustainable Plastic Packaging Industry Report
1. INTRODUCTION
- 1.1Study Assumptions and Market Definition
- 1.2Scope of the Study
2. RESEARCH METHODOLOGY
3. EXECUTIVE SUMMARY
4. MARKET LANDSCAPE
- 4.1Market Overview
- 4.2Market Drivers
- 4.2.1Stringent single-use plastic regulations
- 4.2.2Rising consumer eco-consciousness
- 4.2.3Brand owner circular-economy targets
- 4.2.4E-commerce protective-packaging shift
- 4.2.5Chemical recycling enabling food-grade rPET
- 4.2.6Net-zero Scope-3 pressures on bio-based resins
- 4.3Market Restraints
- 4.3.1Cost premium vs. conventional packaging
- 4.3.2Inadequate waste-management infrastructure
- 4.3.3LCA scrutiny of certain bio-polymers
- 4.3.4Feedstock volatility for advanced recycling
- 4.4Supply-Chain Analysis
- 4.5Regulatory Landscape
- 4.6Technological Outlook
- 4.7Porter’s Five Forces Analysis
- 4.7.1Threat of New Entrants
- 4.7.2Bargaining Power of Buyers
- 4.7.3Bargaining Power of Suppliers
- 4.7.4Threat of Substitutes
- 4.7.5Intensity of Competitive Rivalry
- 4.8Investment Analysis
5. MARKET SIZE AND GROWTH FORECASTS (VALUE)
- 5.1By Packaging Type
- 5.1.1Rigid
- 5.1.2Flexible
- 5.2By Packaging Format
- 5.2.1Primary
- 5.2.2Secondary
- 5.2.3Tertiary
- 5.3By Process Type
- 5.3.1Recyclable
- 5.3.2Reusable
- 5.3.3Compostable/Biodegradable
- 5.3.4Refill and Concentrate Systems
- 5.4By Material Type
- 5.4.1Recycled PET (rPET)
- 5.4.2Recycled HDPE (rHDPE)
- 5.4.3Polylactic Acid (PLA)
- 5.4.4Polyhydroxyalkanoates (PHA)
- 5.4.5Other Material Types
- 5.5By End-Use Industry
- 5.5.1Food and Beverage
- 5.5.2Personal Care and Cosmetics
- 5.5.3Healthcare and Pharmaceuticals
- 5.5.4Home Care and Industrial
- 5.5.5E-commerce Fulfilment
- 5.5.6Other End-Use Industry
- 5.6By Geography
- 5.6.1North America
- 5.6.1.1United States
- 5.6.1.2Canada
- 5.6.1.3Mexico
- 5.6.2Europe
- 5.6.2.1Germany
- 5.6.2.2United Kingdom
- 5.6.2.3France
- 5.6.2.4Italy
- 5.6.2.5Spain
- 5.6.2.6Russia
- 5.6.2.7Rest of Europe
- 5.6.3Asia-Pacific
- 5.6.3.1China
- 5.6.3.2India
- 5.6.3.3Japan
- 5.6.3.4South Korea
- 5.6.3.5Australia and New Zealand
- 5.6.3.6Rest of Asia-Pacific
- 5.6.4Middle East and Africa
- 5.6.4.1Middle East
- 5.6.4.1.1United Arab Emirates
- 5.6.4.1.2Saudi Arabia
- 5.6.4.1.3Turkey
- 5.6.4.1.4Rest of Middle East
- 5.6.4.2Africa
- 5.6.4.2.1South Africa
- 5.6.4.2.2Nigeria
- 5.6.4.2.3Egypt
- 5.6.4.2.4Rest of Africa
- 5.6.5South America
- 5.6.5.1Brazil
- 5.6.5.2Argentina
- 5.6.5.3Rest of South America
6. COMPETITIVE LANDSCAPE
- 6.1Market Concentration
- 6.2Strategic Moves
- 6.3Market Share Analysis
- 6.4Company Profiles (includes Global level Overview, Market level overview, Core Segments, Financials, Strategic Information, Market Rank/Share, Products and Services, Recent Developments)
- 6.4.1Amcor Plc
- 6.4.2ALPLA
- 6.4.3Huhtamaki
- 6.4.4Mondi Group
- 6.4.5Sealed Air
- 6.4.6Tetra Pak
- 6.4.7Pactiv Evergreen
- 6.4.8Novolex
- 6.4.9Dart Container
- 6.4.10International Paper
- 6.4.11Smurfit Westrock
- 6.4.12Stora Enso
- 6.4.13Klöckner Pentaplast
- 6.4.14Plastipak
- 6.4.15BioPak
- 6.4.16Genpak
- 6.4.17Sidel Group
- 6.4.18Taghleef Industries
7. MARKET OPPORTUNITIES AND FUTURE OUTLOOK
- 7.1White-space and Unmet-need Assessment
Global Sustainable Plastic Packaging Market Report Scope
Sustainable plastic packaging refers to packaging materials and designs that minimize environmental impact throughout their lifecycle. This includes using recycled or bio-based plastics, reducing material usage, improving recyclability, and ensuring proper disposal or reuse. The goal is to create packaging solutions that meet functional requirements while addressing plastic waste and pollution concerns. These packaging solutions often incorporate innovative technologies and materials to enhance sustainability. For example, some sustainable plastic packaging uses biodegradable polymers that break down naturally in the environment. Others are designed for easy disassembly and recycling, promoting a circular economy approach. Sustainable plastic packaging also optimizes production processes to reduce energy consumption and greenhouse gas emissions.
Sustainable plastic packaging market by packaging type (rigid, flexible), by packaging format (primary, secondary, and tertiary), by process (recyclable, reusable, and biodegradable), by end-user verticals (food and beverage, personal care, and healthcare, industrial and other end-user industries) and by Geography (North America [United States, Canada], Europe [Germany, United Kingdom, France, Rest of Europe], Asia [China, Japan, India, Australia and New Zealand, Rest of Asia], Latin America [Brazil, Mexico, Columbia, Rest of Latin America], Middle East and Africa [United Arab Emirates, Saudi Arabia, South Africa and Rest of Middle East & Africa]) The market sizes and forecasts are provided in terms of value in (USD) for all the above segments.