Returnable Packaging Market Size and Share
Market Overview
| Study Period | 2020 - 2031 |
|---|---|
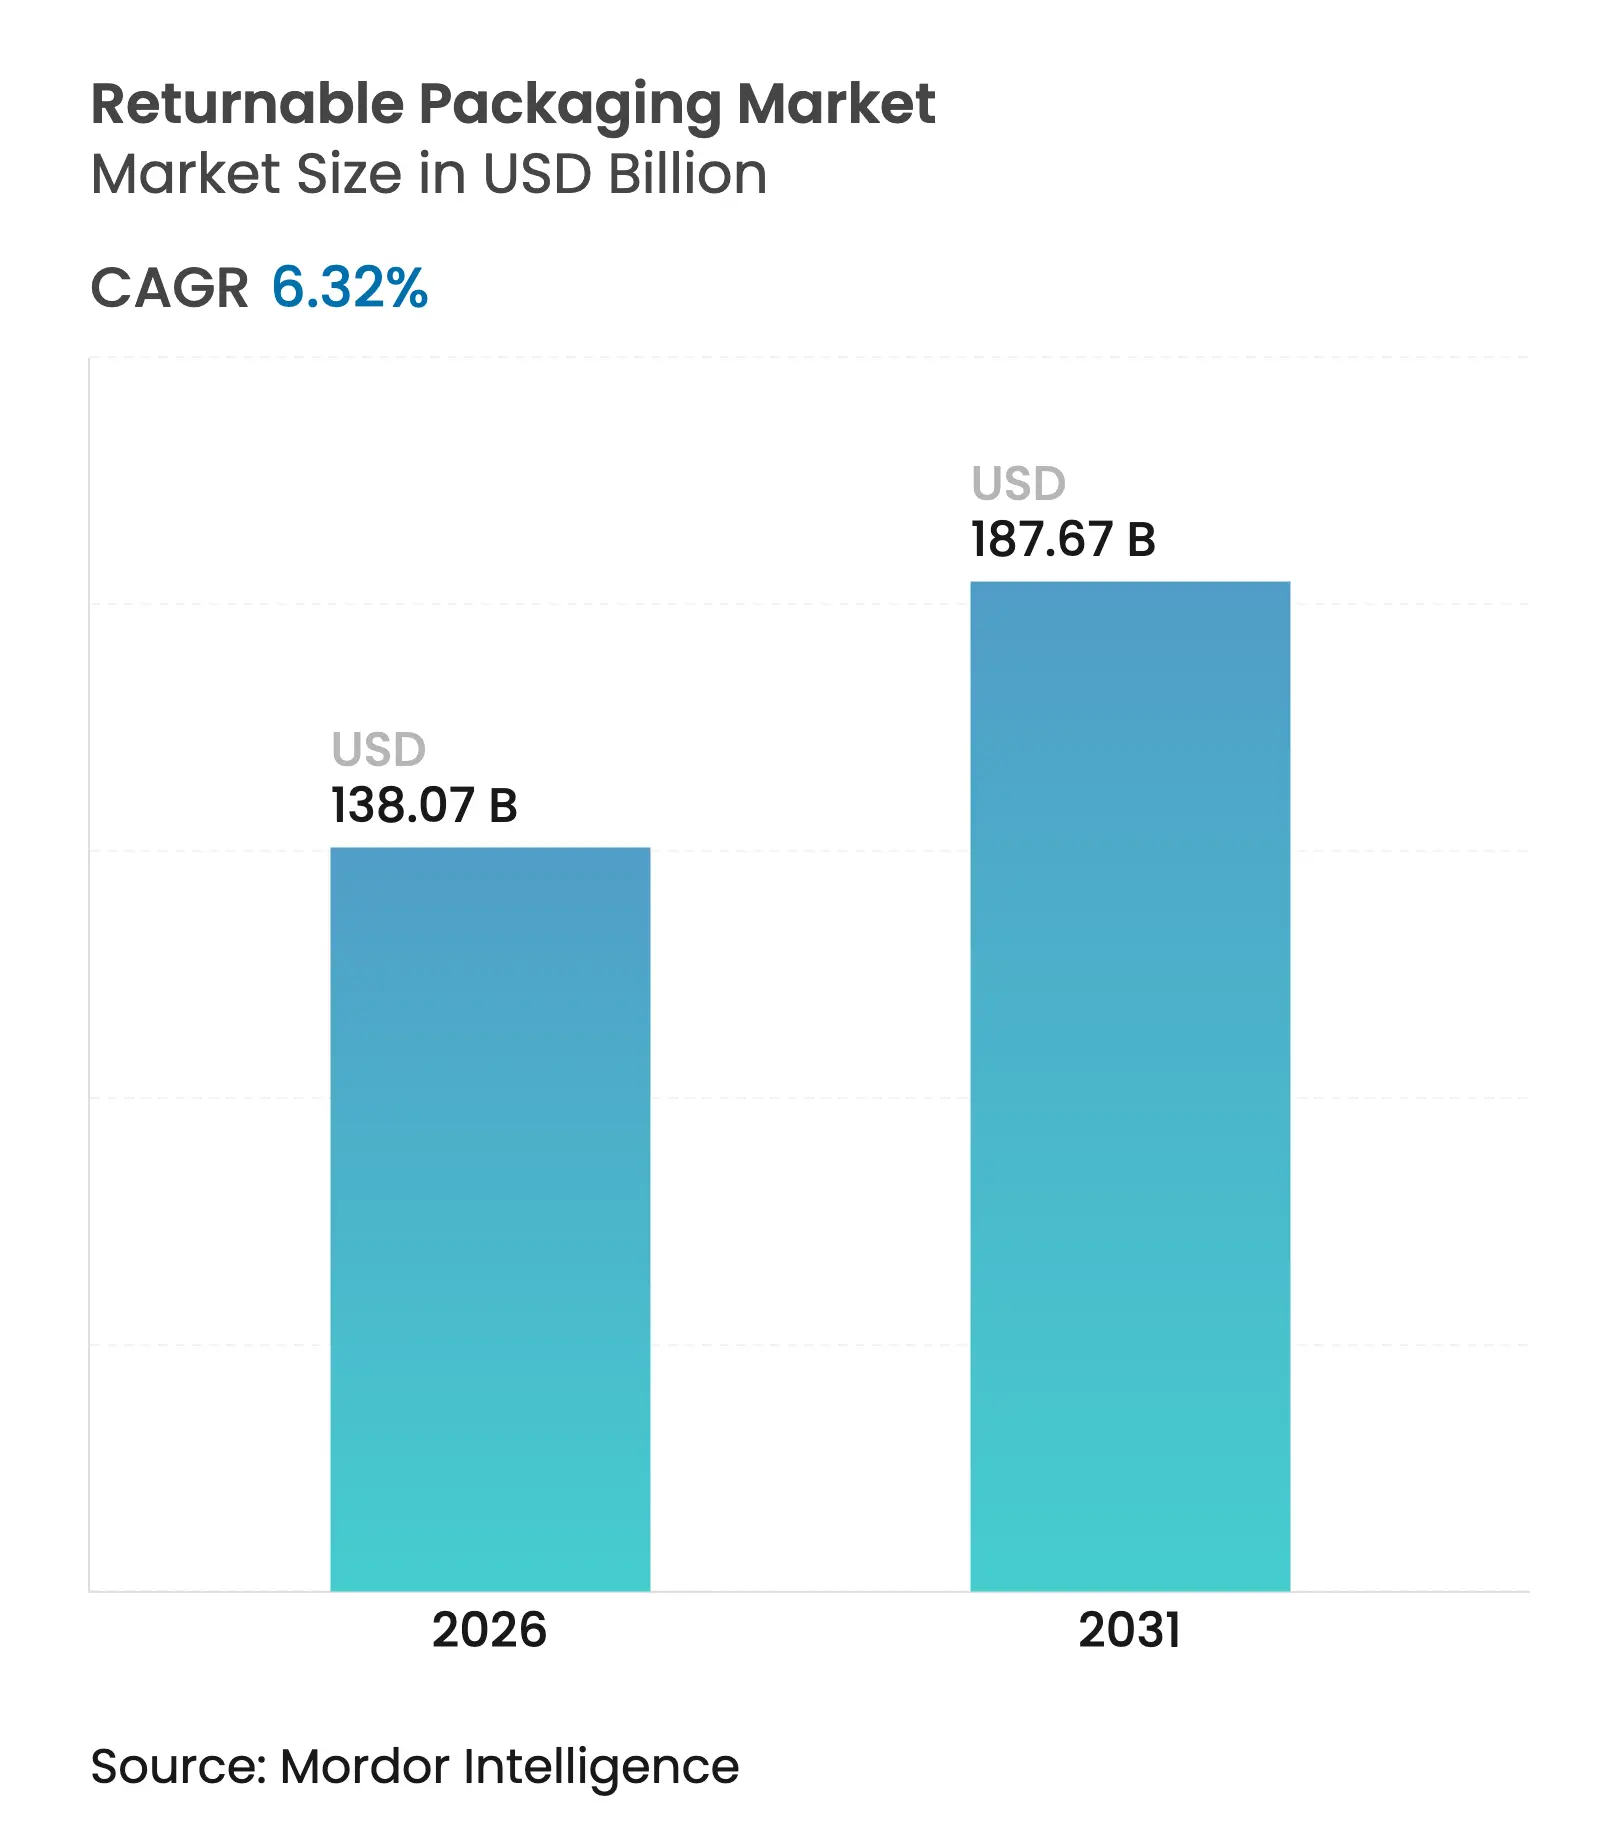
| Market Size (2026) | USD 138.07 Billion |
| Market Size (2031) | USD 187.67 Billion |
| Growth Rate (2026 - 2031) | 6.32 % CAGR |
| Fastest Growing Market | Asia |
| Largest Market | North America |
| Market Concentration | Low |
Major Players *Disclaimer: Major Players sorted in no particular order. Image © Mordor Intelligence. Reuse requires attribution under CC BY 4.0. |
Returnable Packaging Market Analysis by Mordor Intelligence
Returnable packaging market size in 2026 is estimated at USD 138.07 billion, growing from 2025 value of USD 129.86 billion with 2031 projections showing USD 187.67 billion, growing at 6.32% CAGR over 2026-2031. Strong demand from automotive, food processing, and rapidly scaling e-commerce logistics keeps the returnable packaging market on a steady upward trajectory. Regulatory enforcement of Extended Producer Responsibility, the shift toward asset-light supply chains, and widespread deployment of RFID- and IoT-enabled tracking elevate total cost-of-ownership savings above legacy single-use options. Composite materials gain traction as performance enhancements stretch service life, while pooling-as-a-service broadens access for smaller shippers. Overall, digitization and sustainability mandates jointly reposition returnable systems as core supply-chain infrastructure, widening the adoption base across sectors.
Key Report Takeaways
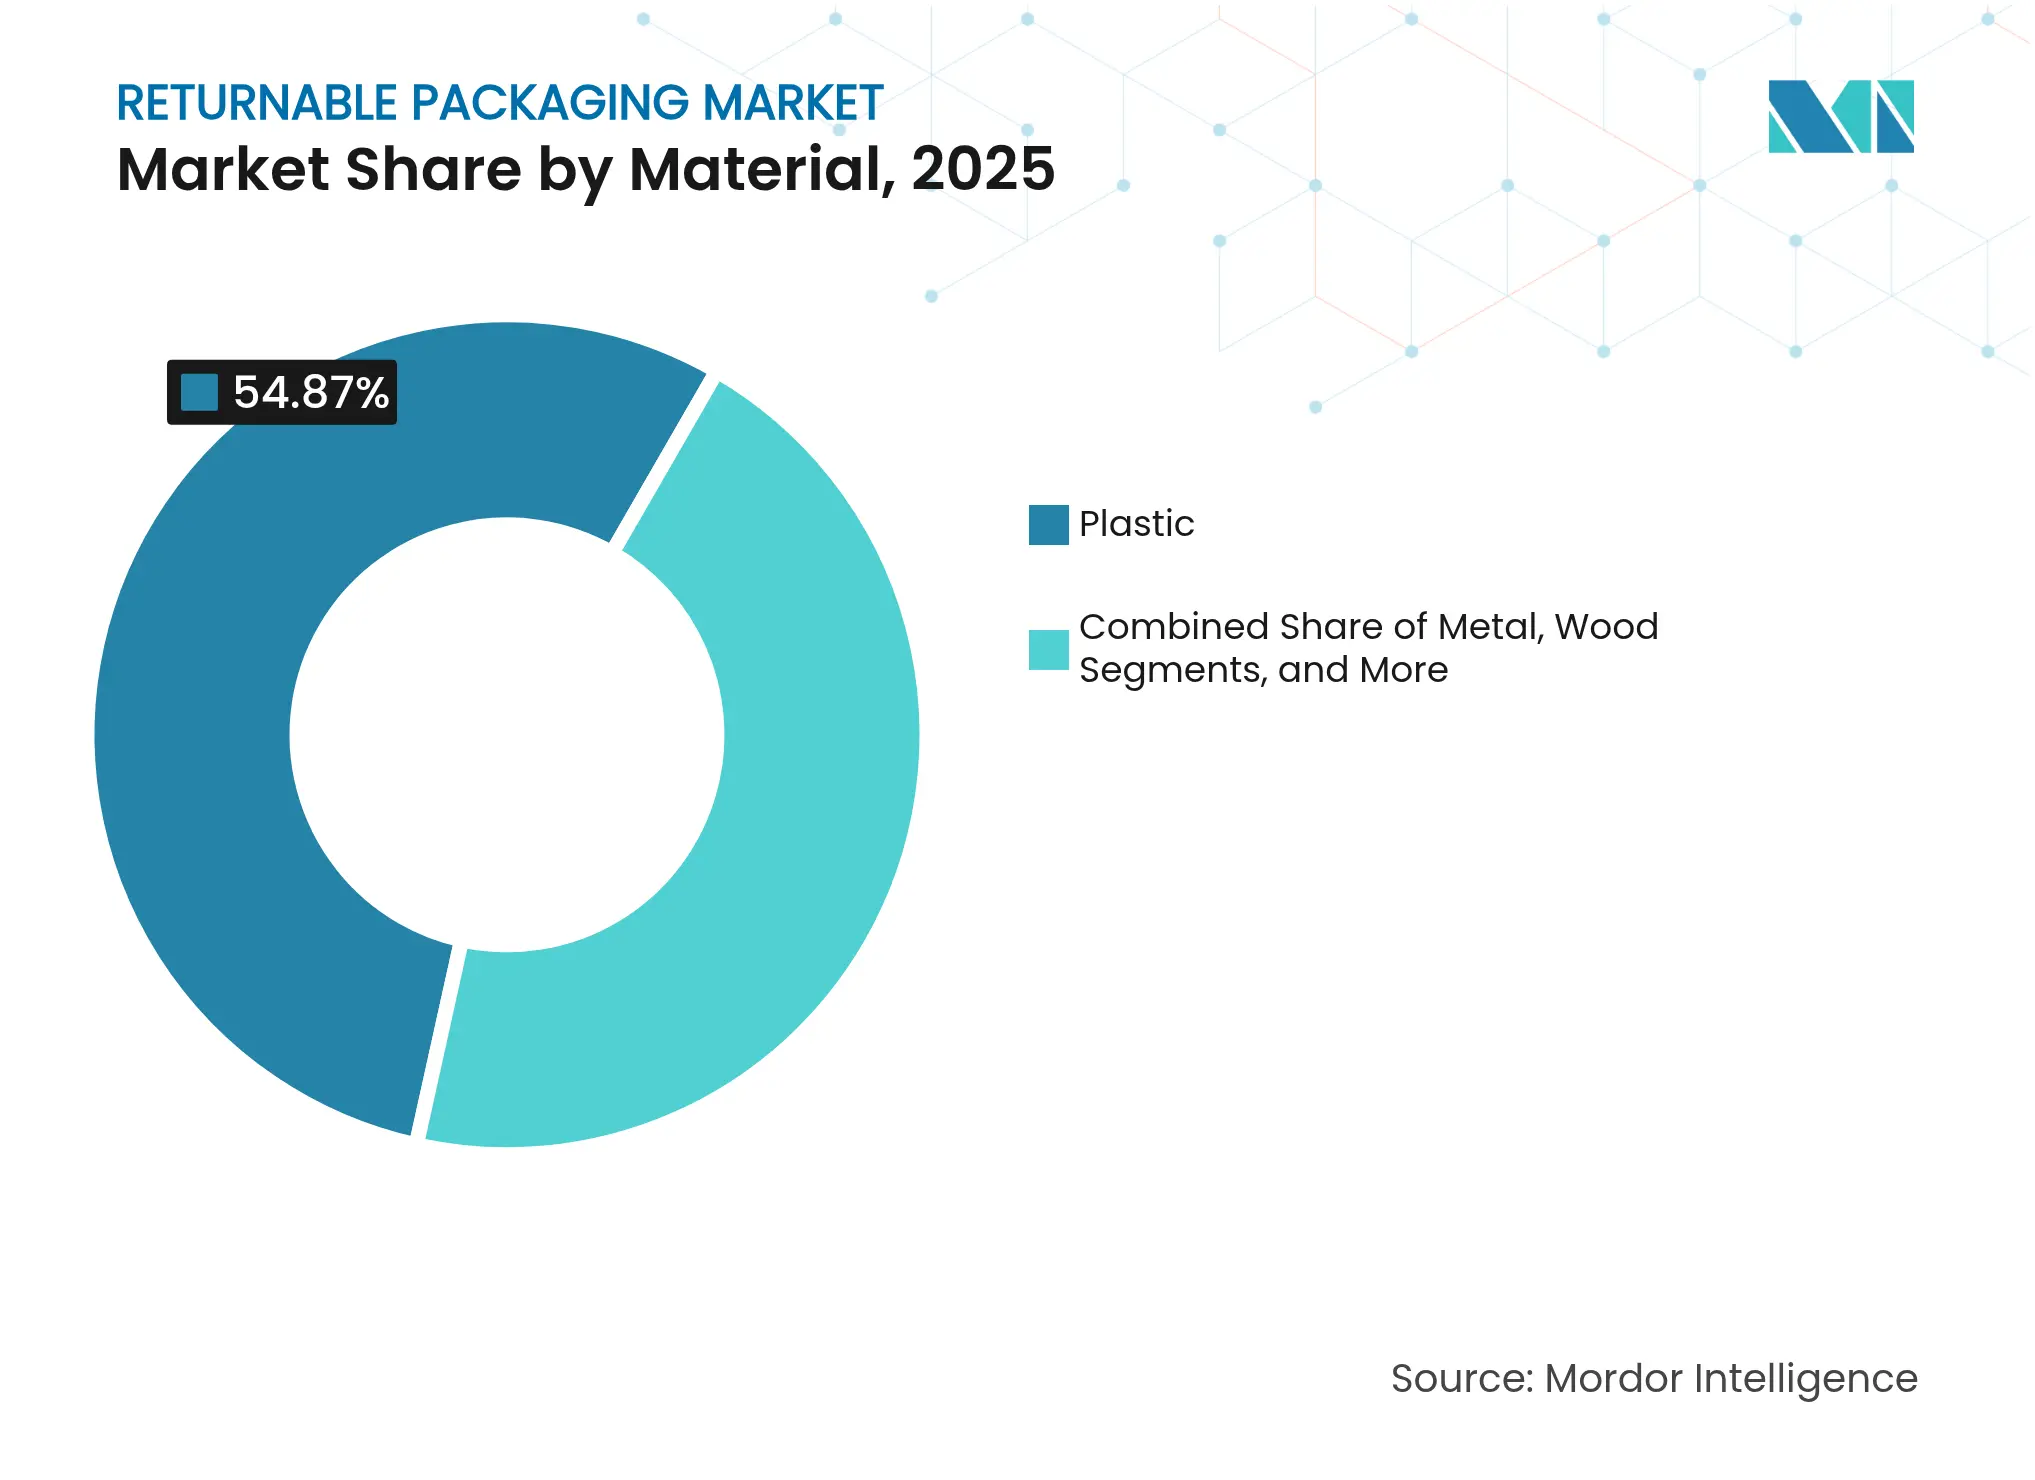
- By material, plastic led with 54.87% of returnable packaging market share in 2025; composite materials are projected to expand at a 9.10% CAGR to 2031.
- By product type, pallets commanded 35.12% share of the returnable packaging market size in 2025, while Intermediate Bulk Containers are advancing at an 8.45% CAGR through 2031.
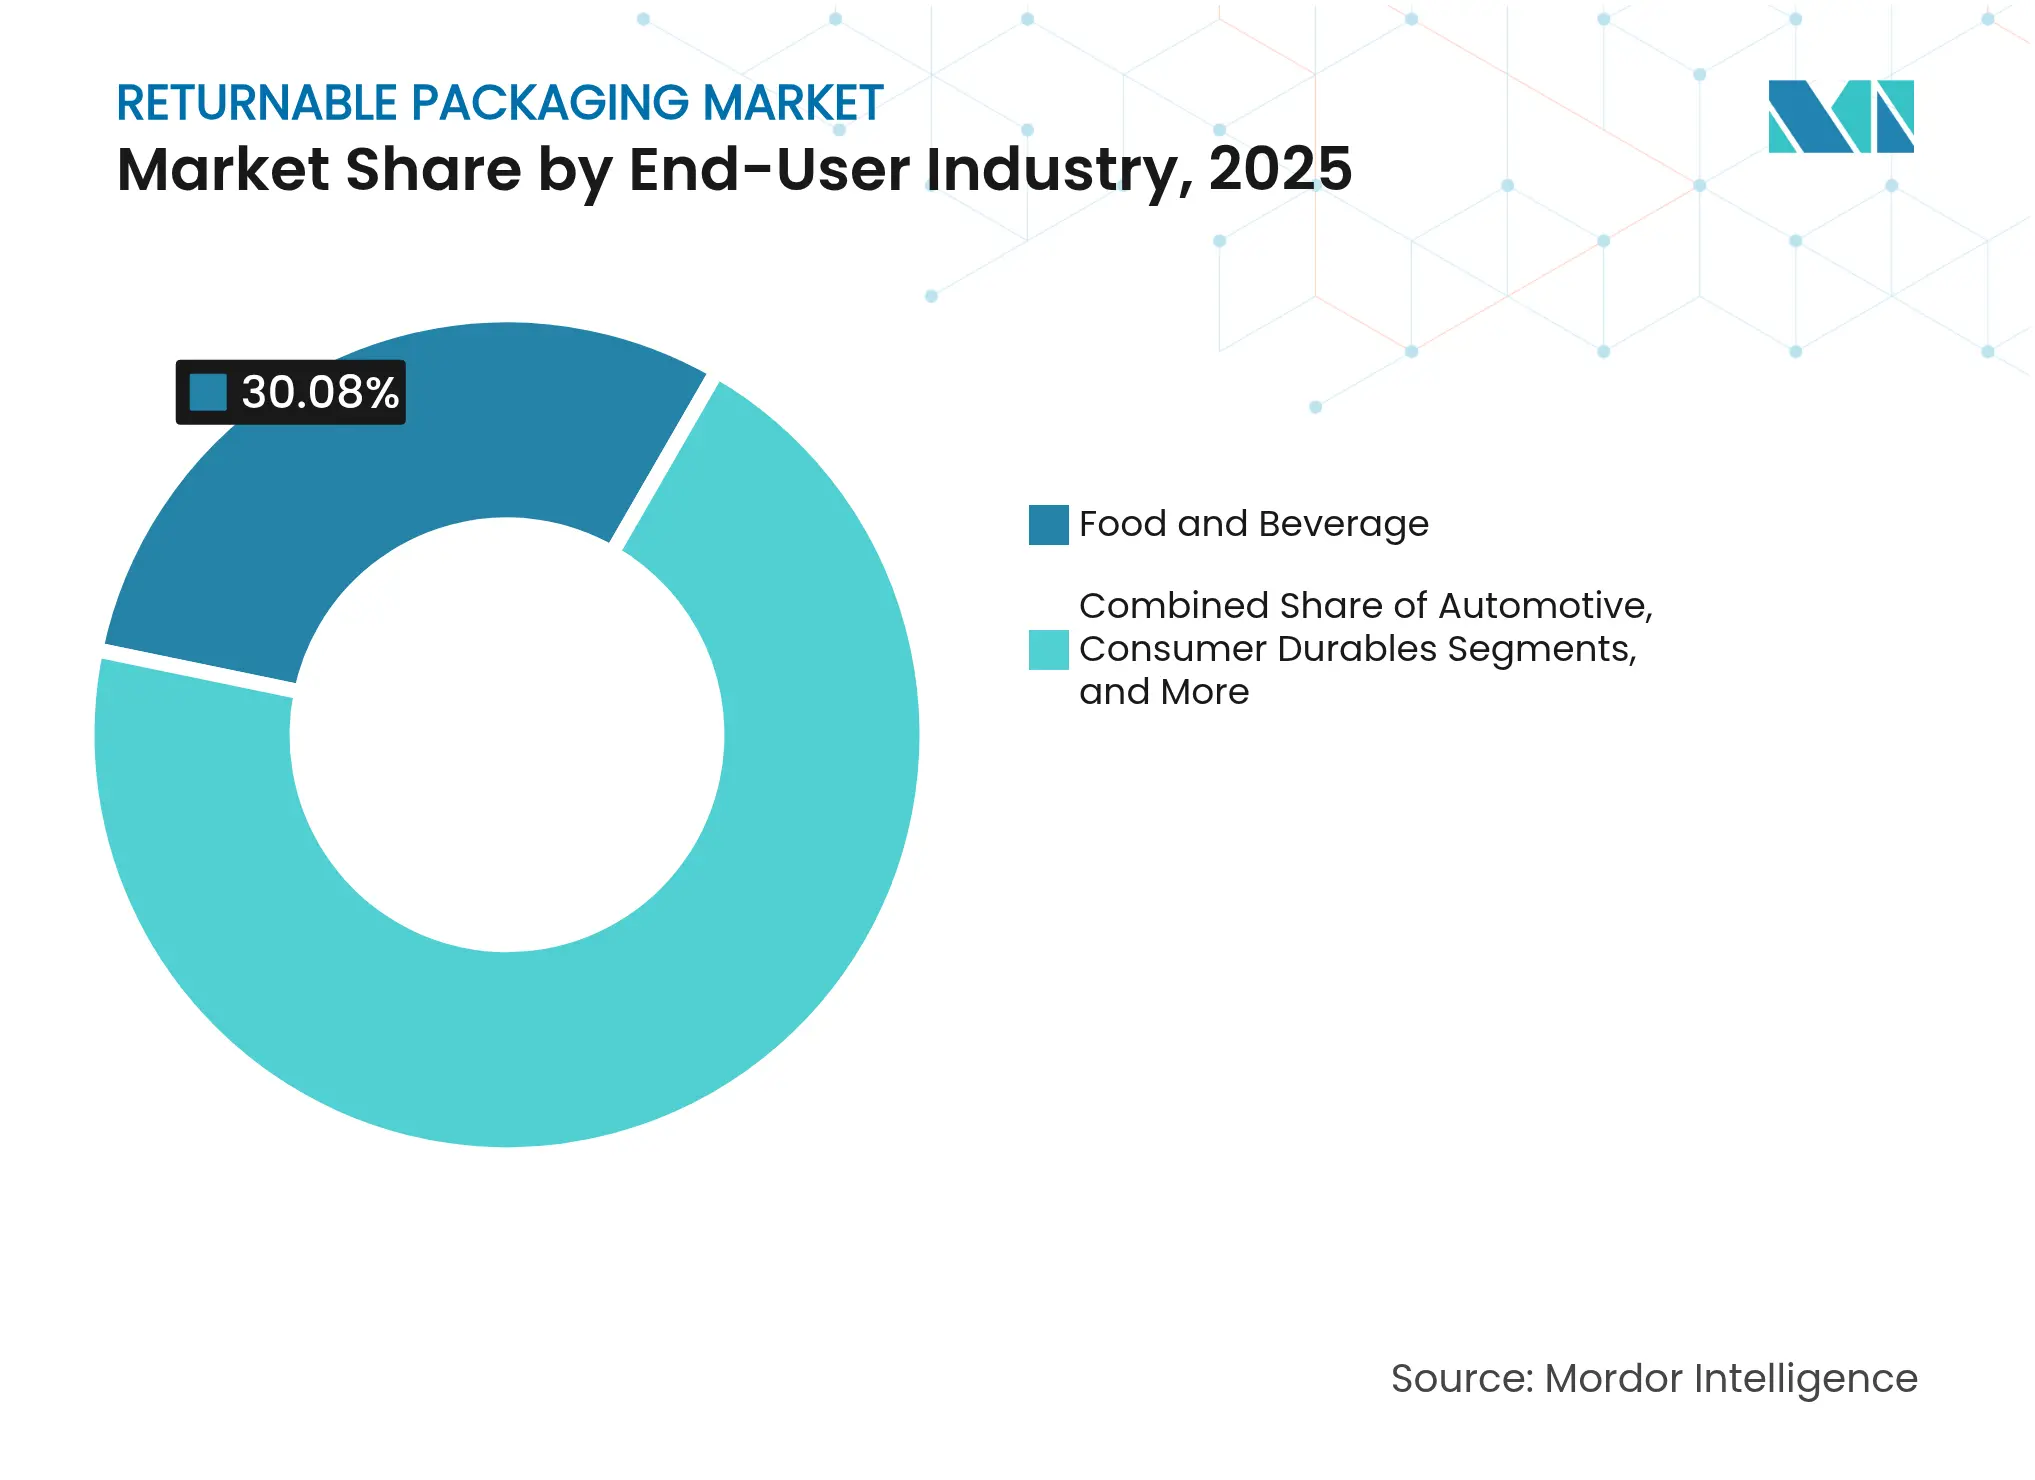
- By end-user industry, food and beverage held 30.08% of returnable packaging market share in 2025, whereas healthcare and pharmaceuticals show the highest CAGR at 8.91% through 2031.
- By ownership model, company-owned assets retained 49.55% share of the returnable packaging market in 2025; hybrid managed-services models are growing at an 7.95% CAGR through 2031.
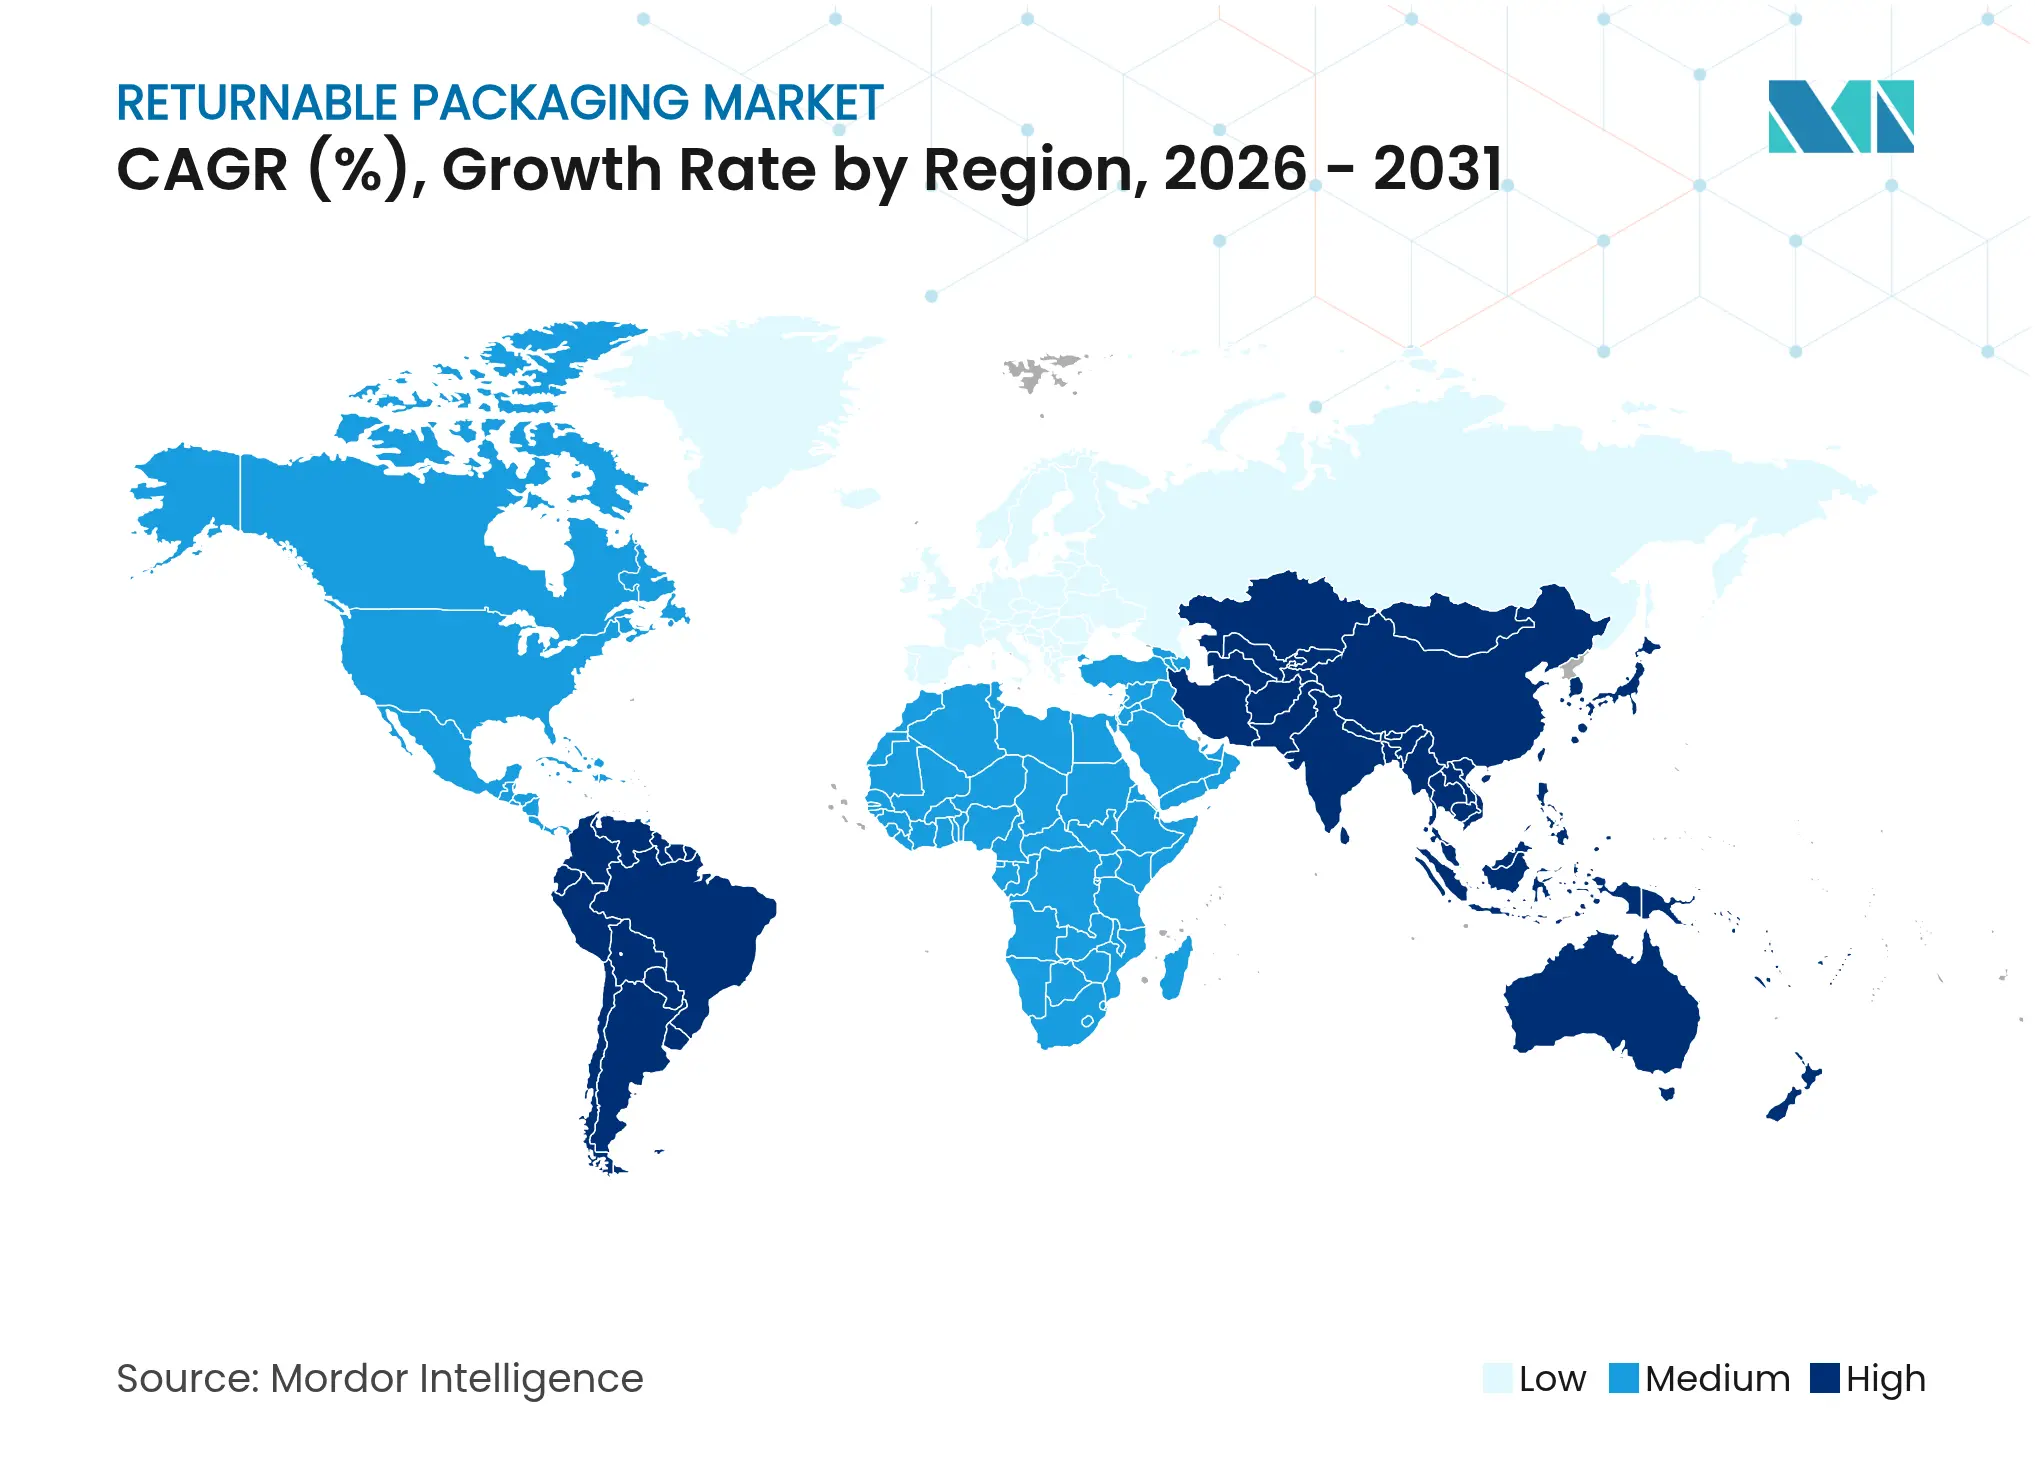
- By geography, North America accounted for 37.92% of the returnable packaging market in 2025; Asia-Pacific is forecast to grow fastest at a 9.23% CAGR to 2031.
Note: Market size and forecast figures in this report are generated using Mordor Intelligence's proprietary estimation framework, updated with the latest available data and insights as of 2026.
Global Returnable Packaging Market Trends and Insights
Drivers Impact Analysis
| Driver | (~) % Impact on CAGR Forecast | Geographic Relevance | Impact Timeline | |||
|---|---|---|---|---|---|---|
Cost
savings and operational efficiency
Cost
savings and operational efficiency
| +1.8% | Global, strongest in North America and Europe | Medium term (2-4 years) |
(~) %
Impact on CAGR Forecast
:
+1.8%
|
Geographic Relevance
:
Global,
strongest in North America and Europe
|
Impact Timeline
:
Medium
term (2-4 years)
|
Automotive
demand for durable containers
Automotive
demand for durable containers
| +1.2% | North America, Europe, Asia-Pacific manufacturing hubs | Long term (≥ 4 years) | |||
Sustainability-focused
regulation (EPR, SUP bans)
Sustainability-focused
regulation (EPR, SUP bans)
| +1.5% | Europe primary, expanding to North America and Asia-Pacific | Short term (≤ 2 years) | |||
E-commerce
reverse-logistics networks
E-commerce
reverse-logistics networks
| +0.9% | Global, concentrated in urban centers | Medium term (2-4 years) | |||
RFID/IoT-enabled
asset tracking
RFID/IoT-enabled
asset tracking
| +0.7% | North America and Europe early adoption, Asia-Pacific following | Long term (≥ 4 years) | |||
Pooling-as-a-service
business models
Pooling-as-a-service
business models
| +0.6% | Global, mature markets leading | Medium term (2-4 years) | |||
| Source: Mordor Intelligence | ||||||
Cost Savings and Operational Efficiency
Enterprises rank lifecycle economics above acquisition price, redirecting capital toward durable containers that keep circulating for 20–30 cycles, well beyond the 8–12 cycles typical of standard plastic bins. Renault’s European program already manages 5 million reusable packs and targets a 30% carbon cut by 2030, underscoring how maintenance routines preserve asset productivity. Better cube utilization and reduced handling labor compound savings across large networks, making the returnable packaging market attractive to procurement teams focused on total cost of ownership.
Automotive Demand for Durable Containers
Vehicle manufacturers deploy standardized, RFID-enabled bins to protect high-value power-train parts while meeting just-in-time delivery windows. A CHEP project with a North American OEM cut packaging-related costs and improved asset recovery rates, illustrating how specialized containers add measurable value on the shop floor.[1]CHEP, “CHEP uses track-and-trace technology on its reusable pallets,” chep.com Growing electric-vehicle output accelerates demand for designs that mitigate electromagnetic interference and mechanical vibration, expanding the returnable packaging market across battery and electronics sub-tiers.
Sustainability-Focused Regulation (EPR, SUP Bans)
The EU Packaging and Packaging Waste Regulation mandates recyclability by 2028 and prescribes recycled-content thresholds, lifting total compliance costs for disposables and prompting a pivot toward reusables. In France, RFID-tracked in-store reuse systems helped a leading QSR chain hit 99% inventory accuracy under single-use bans, proving that traceability is achievable at scale.[2]McDonald’s France, “Reusable Containers with RFID,” rfidjournal.com Such legislation accelerates the returnable packaging market as compliance deadlines close in.
E-commerce Reverse-Logistics Networks
E-retailers now integrate QR-based drop-off hubs and fit-to-size pack algorithms that slash material use while promoting reusable envelopes. Start-ups like Movopack raised EUR 2 million (USD 2.34 million) to meet a EU-wide target where 10% of e-commerce packs must be reusable by 2030. As parcel volumes soar, the returnable packaging market benefits from every percentage point improvement in cycle returns.
Restraints Impact Analysis
| Restraint | (~) % Impact on CAGR Forecast | Geographic Relevance | Impact Timeline | |||
|---|---|---|---|---|---|---|
Complex
return-logistics coordination
Complex
return-logistics coordination
| -1.1% | Global, acute in emerging markets | Medium term (2-4 years) |
(~) %
Impact on CAGR Forecast
:
-1.1%
|
Geographic Relevance
:
Global,
acute in emerging markets
|
Impact Timeline
:
Medium
term (2-4 years)
|
High
upfront CAPEX for durable assets
High
upfront CAPEX for durable assets
| -0.8% | Asia-Pacific and emerging markets primarily | Short term (≤ 2 years) | |||
Hygiene
risk in pharma and sensitive FandB
Hygiene
risk in pharma and sensitive FandB
| -0.6% | Global, regulatory-dependent | Long term (≥ 4 years) | |||
Lack
of global size-standard interoperability
Lack
of global size-standard interoperability
| -0.4% | Global, cross-border trade impact | Long term (≥ 4 years) | |||
| Source: Mordor Intelligence | ||||||
Complex Return-Logistics Coordination
Coordinating reverse flows across multi-tier supply chains remains a bottleneck. FDA Rule 21 CFR 211.204 obliges drug makers to document storage history and destroy any suspect returns, limiting reuse potential in pharma.[3]U.S. Food & Drug Administration, “21 CFR 211.204 — Returned drug products,” ecfr.gov Smaller firms struggle with the IT and partner alignment needed to retrieve containers internationally, tempering growth in parts of the returnable packaging market that lack robust tracking infrastructure.
High Upfront CAPEX for Durable Assets
Durable crates cost more than single-trip boxes at point of purchase, and 2025 resin and corrugated price surges widened the gap. Rental programs alleviate cash pressure, yet typical ownership payback spans 18–36 months, which can dissuade enterprises with volatile volumes or tight credit, slowing certain segments of the returnable packaging market.
Segment Analysis
By Material: Plastic Dominance Faces Composite Innovation
Plastic containers captured 54.87% of returnable packaging market share in 2025 on the strength of mature tooling, low unit costs, and widespread pallet-pool networks. Their lightweight profiles lower freight expense, and recycling streams are well established, giving the segment a stable volume base. However, regulators increasingly question plastic footprints, nudging shippers toward higher-performing constructs.
Composite solutions post the fastest 9.10% CAGR by leveraging glass-fiber-reinforced polymers and high-barrier laminates that stretch service life past 25 cycles and resist chemical attack. This premium durability supports a total cost profile that rivals plastic within three turns, fuelling the returnable packaging market size expansion for high-value automotive and chemical cargoes. Metal retains niche users that prioritize fire resistance and UN markings for hazardous goods, while wood pallets persist where automation is limited but face scrutiny on hygiene and moisture absorption.
Note: Segment shares of all individual segments available upon report purchase
By Product Type: Pallets Lead While IBCs Accelerate
Pallets maintained 35.12% share of the returnable packaging market in 2025, a reflection of near-universal forklift interfaces and dense depot networks. Pallet pools offer rapid swap turnaround, and standardized footprints streamline global trade lanes. The segment undergoes incremental upgrades such as embedded RFID tags and recycled-polymer blends that lift load tracking without disrupting legacy rack systems.
Intermediate Bulk Containers register an 8.45% CAGR as chemical, dairy, and pharmaceutical shippers adopt foldable, 1,000-liter formats that cut return freight costs. This growth directly expands the returnable packaging market size in liquid and powder logistics, sectors that demand sealed handling and quick sanitation times. Dunnage sets, trays, and crates address discrete-part protection needs in electronics and auto components, where damage claims justify more complex geometries and cushioning inserts.
By End-User Industry: Food Sector Stability Meets Healthcare Growth
Food and beverage held 30.08% of returnable packaging market share in 2025, supported by closed-loop milk bottle programs and bakery crate rotations that average six trips per month. Retailers value standardized totes that align with automated back-of-store sorters and cut shrinkage from flimsy corrugated cases.
Healthcare and pharmaceuticals advance at a 8.91% CAGR as contamination-free handling gains urgency. Polypropylene bins compatible with autoclave or dry-heat sterilization improve GMP compliance and drive new revenue streams inside the returnable packaging market. Automotive lines continue to rely on custom kitting boxes that protect scratch-sensitive fascia parts, while e-commerce fulfils apparel returns with zipper pouches rated for 20 cycles.
Note: Segment shares of all individual segments available upon report purchase
By Ownership Model: Asset-Light Strategies Gain Momentum
Company-owned fleets retained 49.55% share of the returnable packaging market in 2025 because heavy users still view containers as strategic equipment that delivers long-run cost savings. Proprietary pools allow customized sizes and immediate availability, ensuring production continuity.
Hybrid managed-services models record the highest 7.95% CAGR as firms outsource maintenance, washing, and repositioning tasks while retaining balance-sheet ownership. This structure merges control with expert know-how, letting operators focus on core processing while specialists manage return flows. Rental pools remain essential for seasonally spiky businesses such as beverages and agriculture, indicating that flexibility remains a cornerstone of the returnable packaging market.
Geography Analysis
North America generated 37.92% of the returnable packaging market size in 2025 on the back of entrenched automotive OEMs and an extensive grocery crate network. High labor costs encourage automation, underpinning demand for RFID-ready pallets that feed directly into warehouse execution systems. Consolidated retail chains further strengthen the region’s closed-loop economics by centralizing washing stations and maximizing round-trip frequencies.
Europe follows with strict regulatory backing. Mandatory recyclability deadlines and EPR fees drive early migration to reusable transit packaging, embedding service fees into consumer-goods cost structures. National programs such as France’s Anti-Waste framework spur quick-service chains to swap disposables for traceable trays, resulting in measurable waste reductions and efficiency gains that ripple across intra-EU supply corridors.
Asia-Pacific represents the fastest-growing theater, delivering a 9.23% CAGR to 2031. Manufacturing relocations to Southeast Asia and aggressive green-policy adoption in China converge to expand the returnable packaging market. New express-parcel rules affecting 175 billion annual deliveries oblige carriers to invest in durable satchels with embedded QR codes. Meanwhile, India’s EPR mandate for 30% recycled content extends demand for reusable alternatives across consumer goods, and Japan’s positive list regulation on food-contact containers lifts interest in high-purity polypropylene crates.

Competitive Landscape
Market Concentration
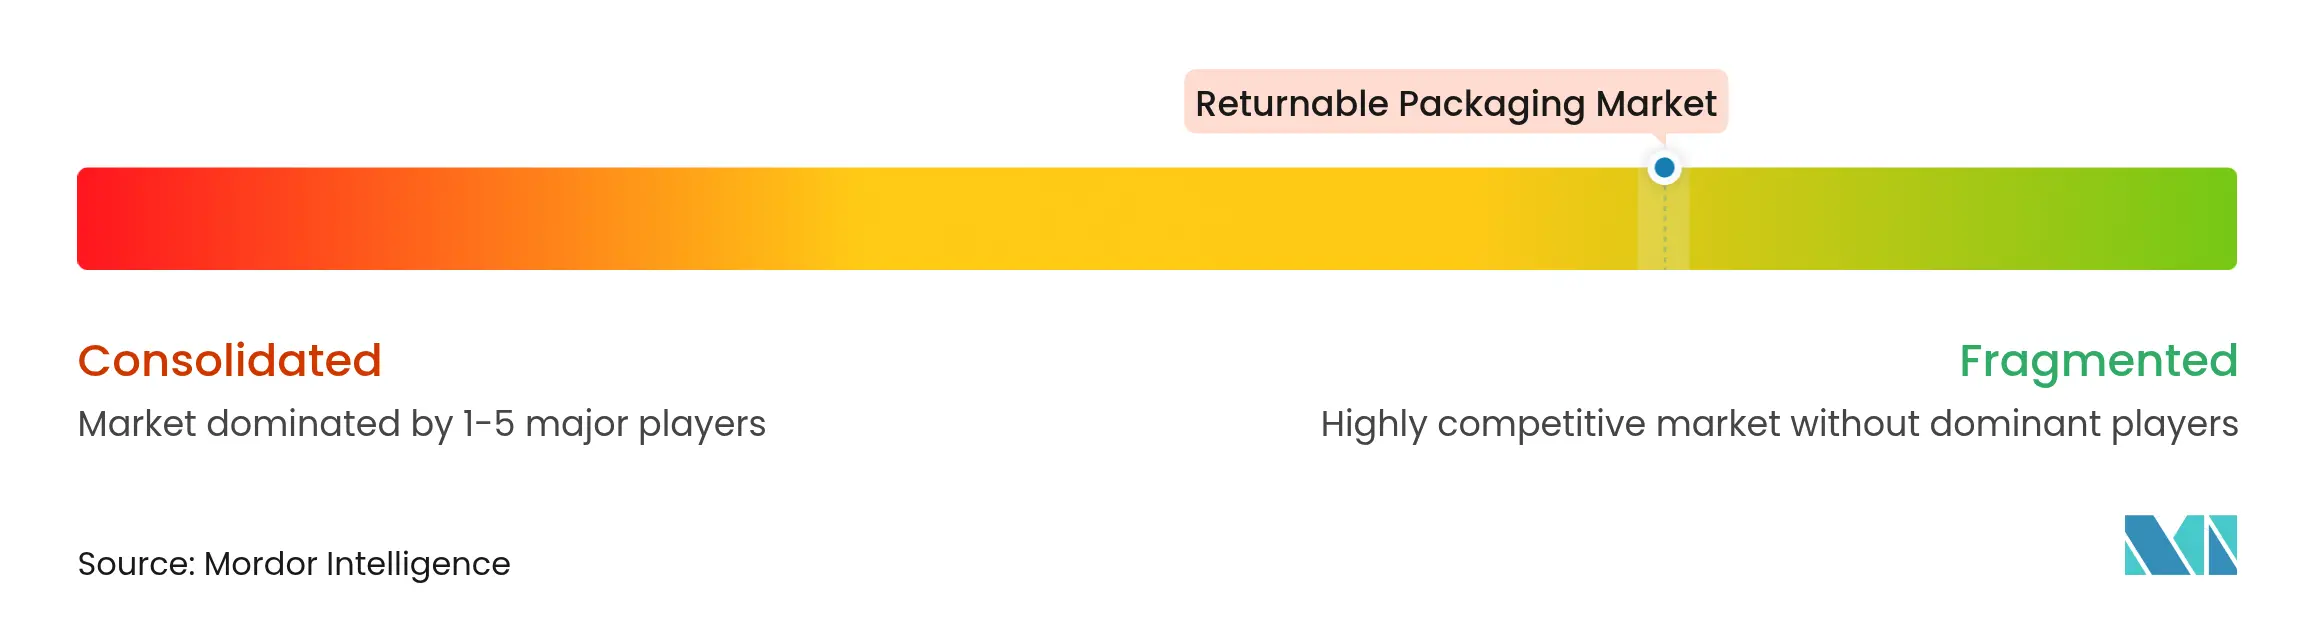
The returnable packaging market exhibits fragmentation, with pallet-pooling majors and specialized crate manufacturers controlling critical infrastructure. Brambles’ CHEP division operates 347 million platforms through 750 service centers worldwide, exemplifying the scale needed to meet OEM uptime standards while leveraging data analytics for predictive positioning.
Consolidation accelerates as firms seek vertical integration. Koch Ag & Energy Solutions’ acquisition of IFCO scales pool density and broadens cross-continent reach. Schoeller Allibert’s merger with IPL aligns molding capacity with digital service portfolios, targeting sectors that demand turnkey washing and repair cycles.
Technology enables fresh differentiation. Providers embed 4G trackers and low-power Bluetooth beacons to cut loss rates and verify reverse-logistics milestones. New entrants focus on circular-economy niches—such as multi-layer film crates or antimicrobial polymer blends—seizing share where incumbent portfolios still rely on traditional HDPE. Competitive intensity now hinges on a dual capability: robust fleet density and data science skills that optimize every trip inside the returnable packaging market.
Returnable Packaging Industry Leaders

*Disclaimer: Major Players sorted in no particular order
Recent Industry Developments
- July 2025: DNP Group developed aluminum-free PTP plastic film for pharmaceutical packaging, aiming at cumulative sales of JPY 1 billion by 2030.
- June 2025: Co-op Shizenha introduced a reusable bottle loop for universal tsuyu products, installing wash and redistribution infrastructure.
- April 2025: Sonoco completed a USD 1.8 billion divestiture of Thermoformed and Flexibles Packaging to TOPPAN, concentrating on sustainable solutions.
- March 2025: Renault launched a circular packaging strategy to cut supply-chain carbon by 30% by 2030 while managing 5 million returnable packs.
- February 2025: ORBIS opened a 660,000-sq-ft Greenville, Texas plant, adding 190 jobs for reusable pallet and tote production.
Table of Contents for Returnable Packaging Industry Report
1. INTRODUCTION
- 1.1Study Assumptions and Market Definition
- 1.2Scope of the Study
2. RESEARCH METHODOLOGY
3. EXECUTIVE SUMMARY
4. MARKET LANDSCAPE
- 4.1Market Overview
- 4.2Market Drivers
- 4.2.1Cost savings and operational efficiency
- 4.2.2Automotive demand for durable containers
- 4.2.3Sustainability-focused regulation (EPR, SUP bans)
- 4.2.4E-commerce reverse-logistics networks
- 4.2.5RFID/IoT-enabled asset tracking
- 4.2.6Pooling-as-a-service business models
- 4.3Market Restraints
- 4.3.1Complex return-logistics coordination
- 4.3.2High upfront CAPEX for durable assets
- 4.3.3Hygiene risk in pharma and sensitive FandB
- 4.3.4Lack of global size-standard interoperability
- 4.4Supply-Chain Analysis
- 4.5Regulatory Landscape
- 4.6Technological Outlook
- 4.7Recycling and Sustainability Landscape
- 4.8Porter's Five Forces Analysis
- 4.8.1Bargaining Power of Suppliers
- 4.8.2Bargaining Power of Buyers
- 4.8.3Threat of New Entrants
- 4.8.4Threat of Substitutes
- 4.8.5Intensity of Competitive Rivalry
5. MARKET SIZE AND GROWTH FORECASTS
- 5.1By Material
- 5.1.1Plastic
- 5.1.2Metal
- 5.1.3Wood
- 5.1.4Composite
- 5.1.5Glass
- 5.2By Product Type
- 5.2.1Pallets
- 5.2.2Crates
- 5.2.3Intermediate Bulk Containers (IBCs)
- 5.2.4Drums and Barrels
- 5.2.5Dunnage
- 5.2.6Trays and Bins
- 5.2.7Other Product Type
- 5.3By End-User Industry
- 5.3.1Automotive
- 5.3.2Consumer Durables
- 5.3.3Food and Beverage
- 5.3.4Healthcare and Pharmaceuticals
- 5.3.5Chemicals and Petrochemicals
- 5.3.6Agriculture
- 5.3.7Retail and E-commerce
- 5.3.8Others
- 5.4By Ownership Model
- 5.4.1Pooled / Leased
- 5.4.2Company-Owned Assets
- 5.4.3Hybrid (Managed Services)
- 5.5By Geography
- 5.5.1North America
- 5.5.1.1United States
- 5.5.1.2Canada
- 5.5.1.3Mexico
- 5.5.2Europe
- 5.5.2.1Germany
- 5.5.2.2United Kingdom
- 5.5.2.3France
- 5.5.2.4Italy
- 5.5.2.5Spain
- 5.5.2.6Russia
- 5.5.2.7Rest of Europe
- 5.5.3Asia-Pacific
- 5.5.3.1China
- 5.5.3.2India
- 5.5.3.3Japan
- 5.5.3.4South Korea
- 5.5.3.5Australia and New Zealand
- 5.5.3.6Rest of Asia-Pacific
- 5.5.4Middle East and Africa
- 5.5.4.1Middle East
- 5.5.4.1.1United Arab Emirates
- 5.5.4.1.2Saudi Arabia
- 5.5.4.1.3Turkey
- 5.5.4.1.4Rest of Middle East
- 5.5.4.2Africa
- 5.5.4.2.1South Africa
- 5.5.4.2.2Nigeria
- 5.5.4.2.3Egypt
- 5.5.4.2.4Rest of Africa
- 5.5.5South America
- 5.5.5.1Brazil
- 5.5.5.2Argentina
- 5.5.5.3Rest of South America
6. COMPETITIVE LANDSCAPE
- 6.1Market Concentration
- 6.2Strategic Moves
- 6.3Market Share Analysis
- 6.4Company Profiles (includes Global level Overview, Market level overview, Core Segments, Financials as available, Strategic Information, Market Rank/Share for key companies, Products and Services, and Recent Developments)
- 6.4.1Brambles Ltd (CHEP)
- 6.4.2IFCO Systems
- 6.4.3Schoeller Allibert
- 6.4.4Tosca Services
- 6.4.5Orbis Corporation
- 6.4.6Rehrig Pacific Company
- 6.4.7NEFAB Group
- 6.4.8Myers Industries Inc.
- 6.4.9Georg Utz Holding AG
- 6.4.10Cabka Group NV
- 6.4.11LEAP India Pvt Ltd
- 6.4.12IPL Plastics Inc.
- 6.4.13PalletOne Inc.
- 6.4.14Craemer Group
- 6.4.15Monoflo International
- 6.4.16SSI Schaefer Systems
- 6.4.17Loop Industries
- 6.4.18Atlas Box & Crating
- 6.4.19RePak Solutions Inc.
- 6.4.20DS Smith Plc
7. MARKET OPPORTUNITIES AND FUTURE OUTLOOK
- 7.1White-space and Unmet-Need Assessment
Global Returnable Packaging Market Report Scope
Returnable packaging encompasses containers, crates, pallets, and other forms of packaging intended for multiple uses. Typically integrated into a closed-loop supply chain, these items can be returned, cleaned, and reused for future shipments or storage. The research also examines underlying growth influencers and significant industry vendors, all of which help to support market estimates and growth rates throughout the anticipated period. The market estimates and projections are based on the base year factors and arrived at top-down and bottom-up approaches.
The returnable packaging market is segmented by material (Plastic, Metal and Wood), by product type (Pallets, Crates, IBCs, Drums & Barrels and Other Products), by end-use industry (Automotive, Consumer Durables, Food & Beverage, Healthcare and Other End-Use Industries) and by geography (North America, Europe, Asia Pacific, South America and Middle East and Africa), The market sizing and forecasts are provided in terms of value (USD) for all the above segments.