Textile Recycling Market Size and Share
Market Overview
| Study Period | 2020 - 2031 |
|---|---|
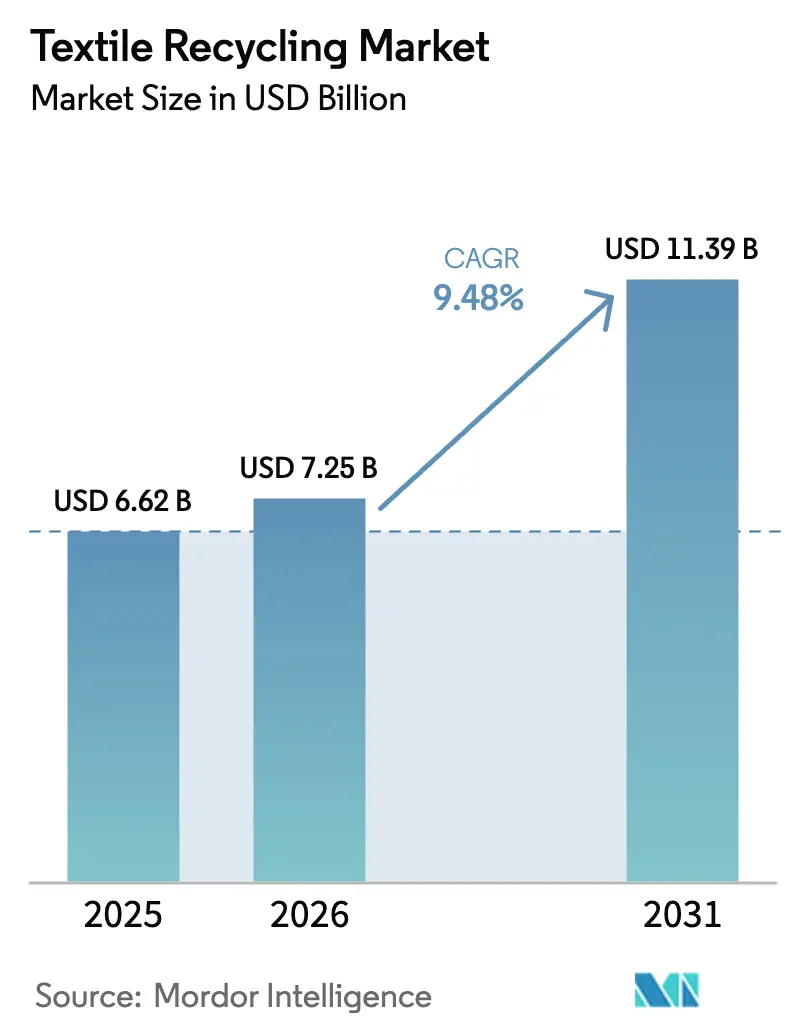
| Market Size (2026) | USD 7.25 Billion |
| Market Size (2031) | USD 11.39 Billion |
| Growth Rate (2026 - 2031) | 9.48% CAGR |
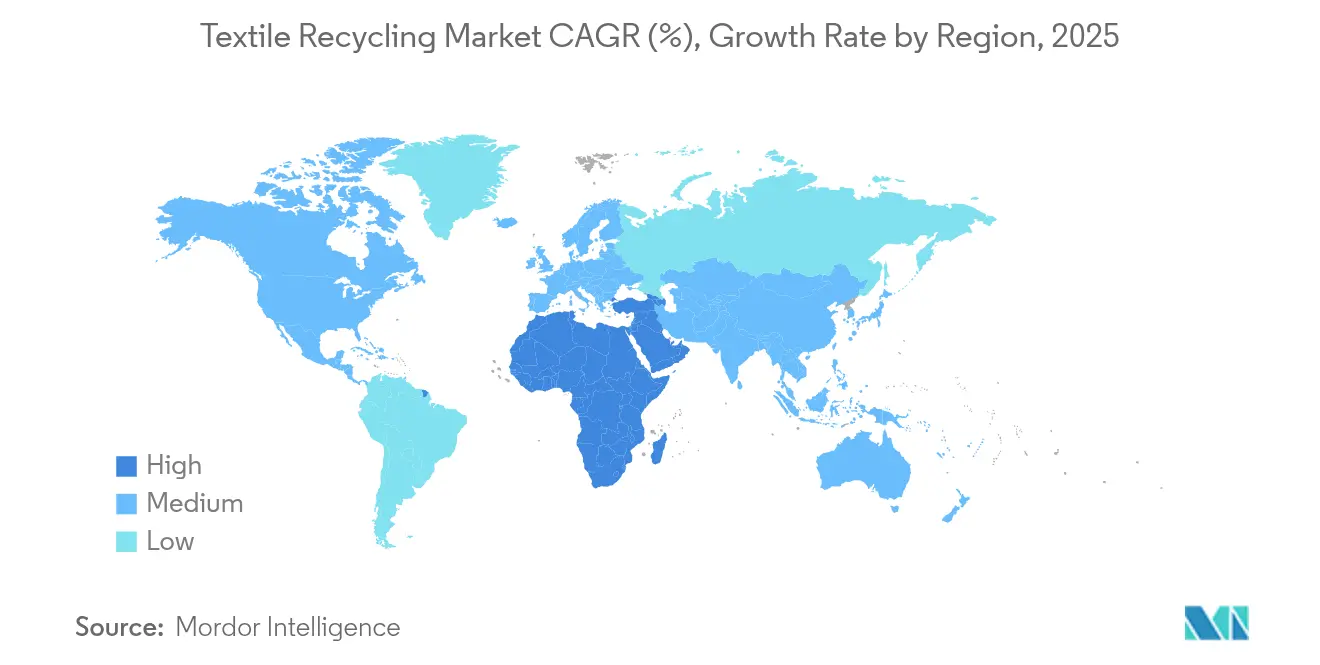
| Fastest Growing Market | Middle East and Africa |
| Largest Market | Asia Pacific |
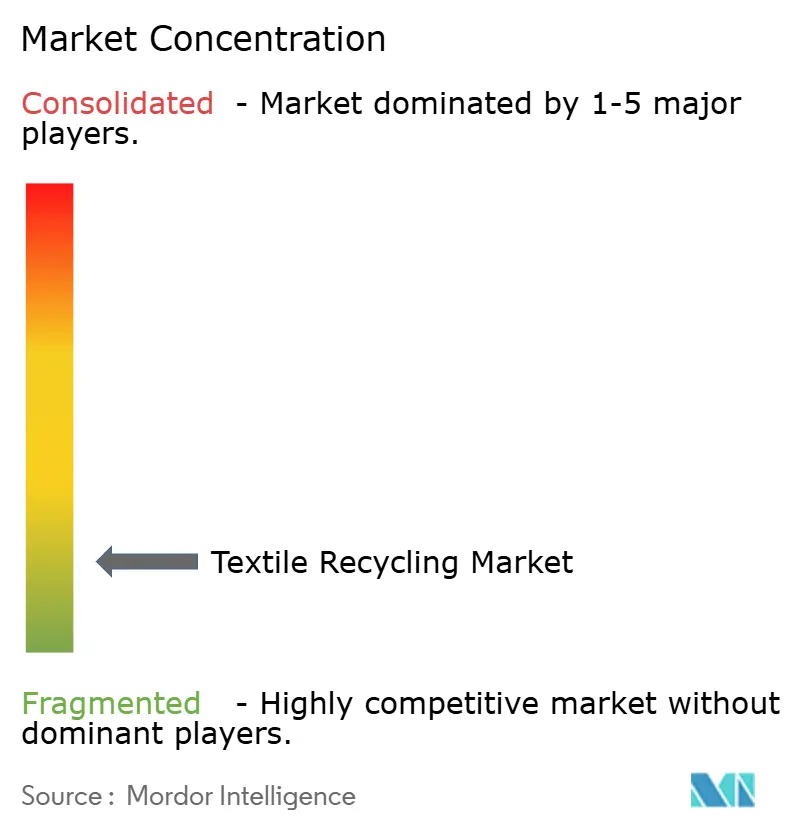
| Market Concentration | Low |
Major Players *Disclaimer: Major Players sorted in no particular order Image © Mordor Intelligence. Reuse requires attribution under CC BY 4.0. | |
Textile Recycling Market Analysis by Mordor Intelligence
The Textile Recycling Market size was valued at USD 6.62 billion in 2025 and is estimated to grow from USD 7.25 billion in 2026 to reach USD 11.39 billion by 2031, at a CAGR of 9.48% during the forecast period (2026-2031).
Heightened regulatory pressure, particularly the European Union’s Extended Producer Responsibility (EPR) policy, is turning waste liabilities into revenue streams and reshaping investment priorities. Fast-fashion brands now anchor long-term offtake agreements that guarantee demand for recycled fibers, allowing technology providers to unlock financing for advanced depolymerization plants. Asia’s manufacturing concentration supplies abundant feedstock, while the Middle East gains ground on the back of circular-economy incentives. Chemical recycling breakthroughs are closing the quality gap with virgin materials, yet high capital costs and energy intensity remain persistent headwinds.
Key Report Takeaways
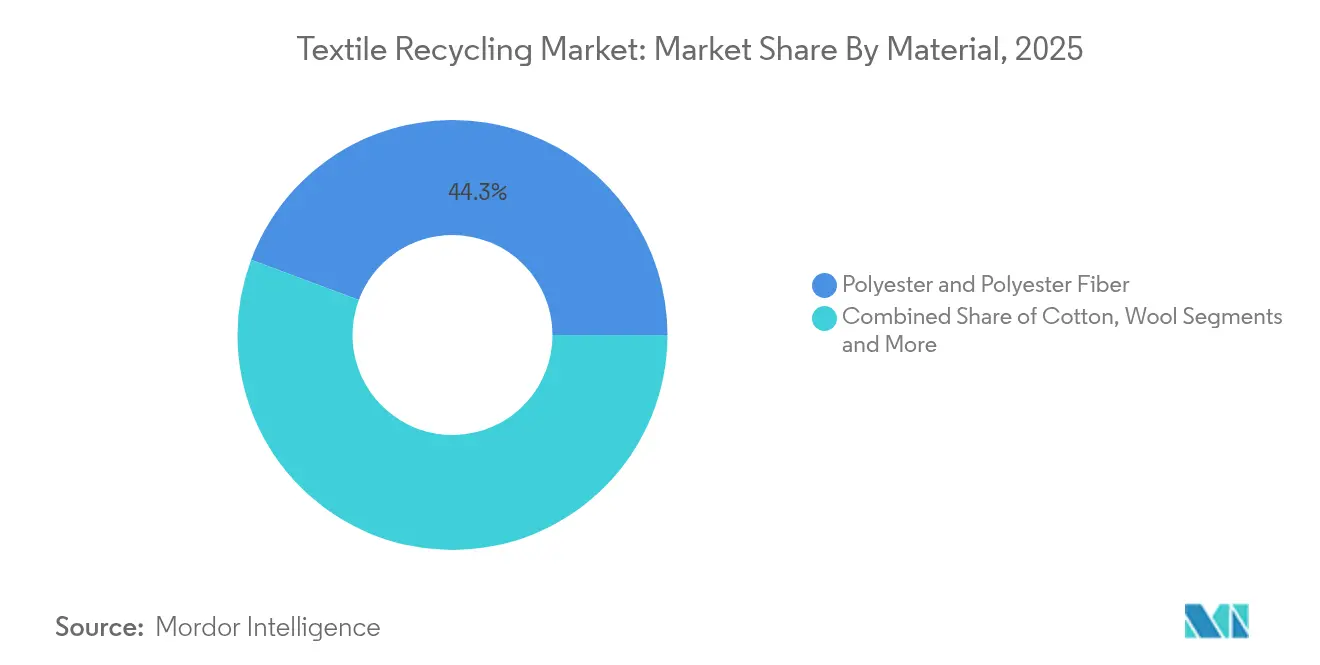
- By material, polyester held 44.30% of the textile recycling market share in 2025, while nylon is advancing at a 9.41% CAGR through 2031.
- By waste source, post-consumer waste commanded 60.40% of the textile recycling market in 2025; pre-consumer sources recorded the fastest expansion at 8.52% CAGR to 2031.
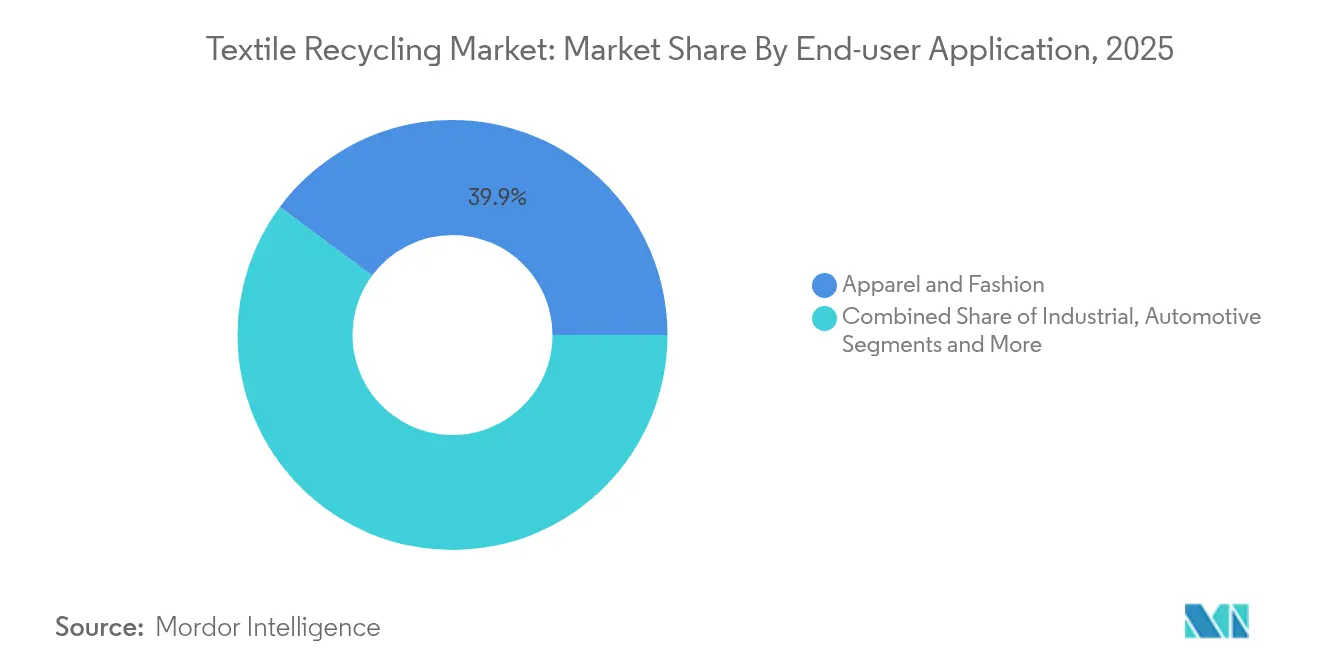
- By application, apparel accounted for 39.85% of demand in 2025, whereas automotive is projected to grow 9.52% annually to 2031.
- By process, mechanical methods captured 81.20% of the textile recycling market size in 2025; chemical routes are widening at a 12.54% CAGR.
- By geography, Asia-Pacific dominated with a 46.10% share in 2025; the Middle East is poised for an 8.74% CAGR to 2031.
Note: Market size and forecast figures in this report are generated using Mordor Intelligence’s proprietary estimation framework, updated with the latest available data and insights as of 2026.
Global Textile Recycling Market Trends and Insights
Drivers Impact Analysis*
| Driver | % Impact on CAGR Forecast | Geographic Relevance | Impact Timeline |
|---|---|---|---|
| Green Deal-Driven Extended Producer Responsibility (EPR) Roll-out in the EU | +2.1% | Europe, with spillover to North America | Medium term (2-4 years) |
| Fast-Fashion Brand Commitments to ≥50% Recycled Fiber by 2026 | +1.8% | Global, concentrated in North America & Europe | Short term (≤ 2 years) |
| Chemical Depolymerisation Scale-ups Unlocking Closed-Loop Polyester | +1.5% | Global, with early deployment in North America & Europe | Long term (≥ 4 years) |
| China's Landfill/Incineration Quotas Forcing Domestic Mill Recycling Investments | +1.2% | APAC core, particularly China | Medium term (2-4 years) |
| Block-Chain Traceability Platforms Boosting Brand Acceptance | +0.8% | Global, with premium brand adoption in developed markets | Medium term (2-4 years) |
| Automotive NVH Demand for Recycled Non-wovens in North America | +0.6% | North America, with expansion to Europe | Long term (≥ 4 years) |
| Source: Mordor Intelligence | |||
Green Deal-driven Extended Producer Responsibility Rollout in the EU
Mandatory separate textile collection begins across the bloc in January 2025, shifting disposal costs to producers through eco-modulated fees[1]European Commission Directorate-General for Environment, “Circular Economy Action Plan 2025: Mandatory Textile EPR,” European Commission, ec.europa.eu. France already channels about EUR 100 million a year from its scheme into collection infrastructure that processes 240,000 tons of waste. Early adopters such as the Netherlands hit 50% recycling rates two years ahead of the EU target, demonstrating scalability. California’s SB 707 mirrors the model, preventing regulatory arbitrage and standardising minimum recycling thresholds. Predictable fee income lowers project risk, accelerating deployments of regional processing hubs.
Fast-fashion Brand Commitments to ≥50% Recycled Fiber by 2026
H&M Group’s seven-year USD 600 million offtake deal with Syre underscores how purchase guarantees are derisking chemical-recycling investments[2]Annika Söder, “Syre Signs USD 600 Million Recycled Polyester Offtake with H&M Group,” H&M Group, hmgroup.com. Gap Inc. and Carter’s share comparable supply-chain goals, pushing aggregate contracted demand above USD 2 billion. Recycled polyester currently commands 15-20% price premiums over virgin equivalents, strengthening revenue visibility for suppliers. Long-term contracts reduce customer acquisition cost and support debt-financed facility builds, especially in Asia and Europe, where brands maintain production clusters.
Chemical depolymerisation scale-ups unlocking closed-loop polyester
Circ, Syre, and Eastman each progressed multi-hundred-million-dollar projects in 2025, reporting virgin-grade output with up to 85% lower carbon footprints relative to fossil-route polyester. University-backed innovations, like microwave-assisted glycolysis, reach 88% circularity within 15 minutes, paving the way for high-throughput operations. Strategic partnerships with fiber producers safeguard feedstock and offtake flows, positioning chemical recycling as a viable complement to mechanical routes.
China Landfill and Incineration Quotas Forcing Domestic Mill Recycling Investments
Zero-Waste City pilots now cover 108 municipalities, restricting landfill and incineration volumes while encouraging resource recovery[3]Hongliang Wang, “Zero-Waste City Pilot Progress Report 2024,” Ministry of Ecology and Environment of the People’s Republic of China, mee.gov.cn. Despite generating 26 million tons of textile waste annually, China recycles only 20%, exposing a sizable domestic market once regulatory barriers on recycled content ease. Municipal incentives and quotas are propelling mill upgrades and joint ventures aimed at retaining value onshore rather than exporting waste.
Restraints Impact Analysis*
| Restraint | % Impact on CAGR Forecast | Geographic Relevance | Impact Timeline |
|---|---|---|---|
| High-CAPEX & Energy-Intensive Chemical Lines Limiting Commercialisation | -1.4% | Global, particularly affecting emerging markets | Long term (≥ 4 years) |
| Fiber-Blend Contamination Complicating Automated Sorting & Yield | -1.1% | Global, with acute challenges in post-consumer waste streams | Medium term (2-4 years) |
| Absence of Bale-Grade Pricing Benchmarks Dampening Investor Confidence | -0.8% | Global, with particular impact on financing in developing markets | Short term (≤ 2 years) |
| Fragmented Collection Infrastructure in US & Emerging Asia | -0.7% | United States and emerging Asia-Pacific markets | Medium term (2-4 years) |
| Source: Mordor Intelligence | |||
High CAPEX & Energy-intensive Chemical Lines Limiting Commercialisation
Typical units require USD 200–500 million, and energy demand ranges from 15–25 GJ per ton, fivefold the mechanical alternative[4]Swedish Chemicals Agency, “Fast Fashion and Chemical Recycling: Risk Assessment 2024,” KemI, kemi.se. Renewcell’s 2024 bankruptcy illustrated financing fragility despite brand partnerships. Subsidies such as Eastman’s now-revoked Department of Energy grant highlight reliance on policy support. Capital intensity often localises projects in OECD regions, leaving feedstock-rich emerging markets underserved.
Fiber-blend Contamination Complicating Automated Sorting & Yield
Near-infrared scanners reach only 85% accuracy on elastane-rich blends, driving quality downgrades and material loss. Pilot lines in France process 25,000 tons annually, yet must divert contaminated fractions to lower-value uses. Novel chemical-separation chemistries are promising but add cost and complexity, sustaining a price premium for clean pre-consumer waste.
*Our forecasts treat driver/restraint impacts as directional, not additive. The impact forecasts reflect baseline growth, mix effects, and variable interactions.
Segment Analysis
By Material: Polyester Dominance Drives Chemical Innovation
Polyester accounted for 44.30% of the textile recycling market in 2025 on the back of established PET supply chains and consumer familiarity. Mechanical processes handle clear streams efficiently, while chemical depolymerisation eliminates quality drop-offs, widening usage in high-end apparel. The nylon segment is expanding at 9.41% CAGR, buoyed by automotive and sportswear blends that demand high tensile strength. Technologies such as ECONYL feed closed-loop loops, signalling commercial readiness. Cotton encounters policy limits in China, but blend-recovery chemistries like REFIBRA open incremental niches. Smaller categories, wool, silk, and acrylic advance as pilot lines prove technical feasibility, and brands diversify raw-material strategies.


By Waste Source: Pre-Consumer Growth Outpaces Post-Consumer Volume
Post-consumer streams held a 60.40% share of the textile recycling market in 2025, reflecting landfill diversion mandates and established charity-collection networks. Yet pre-consumer waste is projected to expand at 8.52% CAGR as factory off-cuts deliver uniform composition, higher yields, and 20–30% value premiums. The EU separate-collection rule, effective in 2025, will double regional post-consumer volumes by 2030, squeezing margins unless automated sorting improves. Digital passports and colour-sort robotics are emerging fixes that can unlock latent value by boosting identification accuracy.
By End-user Application: Automotive Acceleration Outpaces Apparel Growth
Apparel retained 39.85% share of the textile recycling market in 2025, supported by brand pledges for recycled content across flagship lines. Automotive interiors and NVH components, however, are forecast to rise 9.52% annually to 2031 due to regulatory fuel-efficiency targets and acoustic performance gains. Industry players demonstrate recycled polyamide composites with tensile strength exceeding 67 MPa, meeting OEM thresholds. Industrial wipes, filtration media and insulation panels represent additional outlets, broadening revenue streams beyond fashion.
By Recycling Process: Chemical Growth Challenges Mechanical Dominance
Mechanical routes made up 81.20% of the textile recycling market size in 2025 thanks to simplicity and low cost. Chemical techniques are growing 12.54% a year as proof-of-concept plants de-risk scalable chemistry. Ioncell and CuRe achieve near-virgin quality outputs, winning commitments from global brands. Thermal recovery declines as policy frameworks favour material circularity over combustion, re-orienting investment towards value-added processes.
Geography Analysis
Asia-Pacific led the textile recycling market with a 46.10% share in 2025, anchored by massive fiber production and export-oriented apparel hubs that generate sizeable scrap volumes. China’s 26 million-ton waste stream dwarfs global peers, yet recycled-content restrictions funnel much of the output abroad, muting domestic demand. Vietnam emerges as a preferred build site for gigascale plants because of policy incentives and proximity to manufacturing clusters. India lags on infrastructure: only 13% of waste is reused, but central-government initiatives and private partnerships are gaining traction.
The Middle East and Africa is the fastest-growing region in the textile recycling market at an 8.74% CAGR. UAE programs such as Circulife pair retail-collection drives with processing capacity, positioning the Gulf as a regional recycling hub. Turkey leverages its customs-union status with the EU to import European post-consumer bales, process them cost-effectively and re-export yarns, tapping an under-served adjacency between two large consumption zones.
Europe acts as the regulatory bellwether in the textile recycling market; EPR implementation starting 2025 is projected to lift collected volumes to 4.5-7.2 million tons by 2030. North America follows with state-level mandates like California’s SB 707 and federal coordination efforts that could unlock a USD 1.5 billion fiber-to-fiber opportunity. South America’s incipient projects in Brazil and Chile illustrate growing interest, especially where governments view recycling as a job-creation lever.

Competitive Landscape
Competitive intensity in the textile recycling market remains highly fragmented. No single player holds more than a low single-digit share, reflecting varied regional regulations, technology divergence, and feedstock logistics. Start-ups, including Circ, Syre, and Infinited Fiber, prioritise chemical routes, while incumbents such as Lenzing, Eastman, and Unifi leverage existing purification assets to scale mechanically recycled lines. Strategic alliances anchor most capacity expansions: Circ aligns with Aditya Birla for pulp supply, and Eastman collaborates with apparel brands for offtake, marrying upstream security with downstream demand certainty.
Digital-native entrants like Swatchloop and TextileGenesis monetise data services, offering AI-driven sorting guidance and traceability credentials that reduce compliance costs. Automated-sorting specialists partner with waste-management majors, eyeing integrated solutions that give recyclers bale-grade specifications and predictability. Financial investors target proven platforms: KKR-backed deals and multilateral-bank loans fund regional hubs where regulatory clarity and feedstock access converge.
Technology differentiation still defines value capture. Companies delivering blend-agnostic depolymerisation or low-energy solvents gain pricing power and fast adoption. Yet high CAPEX fosters regional monopolies around each plant, limiting global consolidation in the near term. As more EPR fees flow into infrastructure, the field is expected to tilt toward vertically integrated operators that control collection, processing and branded materials.
Textile Recycling Industry Leaders
Worn Again Technologies
Lenzing Group
Birla Cellulose
Pistoni S.R.L
Waste Management Inc.
- *Disclaimer: Major Players sorted in no particular order

Recent Industry Developments
- June 2025: Eastman debuted Naia™ Renew bedding fill with 40% recycled content, widening application scope in home textiles Eastman.
- May 2025: Department of Energy withdrew Eastman’s USD 375 million grant for its Texas facility, underlining policy-driven risk Resource Recycling.
- March 2025: Lenzing expanded LENZING™ Lyocell Fill portfolio, adding finer variants for comfort and resource efficiency Lenzing.
- February 2025: Reju and Nouvelles Fibres Textiles formed a French ecosystem to supply secondary raw materials that cut Reju Polyester™ carbon footprint by 50% Reju.


Research Methodology Framework and Report Scope
Market Definitions and Key Coverage
Our study defines the textile recycling market as every industrial activity that collects, sorts, mechanically or chemically processes discarded textile or apparel material and then sells the recovered fiber, yarn, or feedstock back into manufacturing supply chains worldwide. According to Mordor Intelligence data, these transactions generated USD 6.62 billion in 2025.
Scope Exclusions: The analysis leaves out resale or rental platforms where garments stay intact and any energy-from-waste incineration revenue.
Segmentation Overview
- By Material
- Cotton
- Polyester & Polyester Fiber
- Wool
- Nylon & Nylon Fiber
- Others (Silk, Acrylic, Blends)
- By Waste Source
- Pre-consumer (Factory off-cuts, Yarn waste)
- Post-consumer (Discarded Garments & Household Textiles)
- By Application End-user
- Apparel & Fashion
- Industrial (Wipes, Filtration, Safety Gear)
- Home Furnishings & Carpets
- Automotive & Transportation
- Building & Construction
- Others (Retail/Consumer Products, etc.)
- By Recycling Process
- Mechanical Recycling
- Chemical Recycling (Depolymerisation, Dissolution)
- Thermal/Energy Recovery
- By Geography
- North America
- United States
- Canada
- Mexico
- South America
- Brazil
- Argentina
- Chile
- Rest of South America
- Europe
- Germany
- United Kingdom
- France
- Italy
- Spain
- BENELUX (Belgium, Netherlands, and Luxembourg)
- NORDICS (Denmark, Finland, Iceland, Norway, and Sweden)
- Rest of Europe
- Asia-Pacific
- China
- India
- Japan
- South Korea
- ASEAN (Indonesia, Thailand, Philippines, Malaysia, Vietnam)
- Rest of Asia-Pacific
- Middle East and Africa
- Saudi Arabia
- United Arab Emirates
- Turkey
- South Africa
- Nigeria
- Egypt
- Rest of Middle East and Africa
- North America
Detailed Research Methodology and Data Validation
Primary Research
We complemented desk work with interviews and short surveys covering European mechanical recyclers, U.S. charity collectors, Indian open-end spinners using recovered cotton, and start-ups commercializing chemical depolymerization in China. Dialogues with officials overseeing extended producer responsibility mandates helped us stress-test collection-rate and adoption assumptions.
Desk Research
We began with open data from Eurostat on post-consumer textile waste, the United States Environmental Protection Agency disposal reports, China's National Bureau of Statistics material-flow tables, and UN Comtrade trade codes covering worn clothing and regenerated fibers. Policy papers from the European Environment Agency, circularity roadmaps by the Ellen MacArthur Foundation, and peer-reviewed work in Resources, Conservation & Recycling supplied yield benchmarks and regulatory timelines. Company filings of listed fiber producers, NGO collection audits, shipment traces pulled through Volza, and financial snapshots from D&B Hoovers allowed us to check capacity additions and average selling prices. The sources cited here are illustrative; many other public and paid references were reviewed during data collection, validation, and clarification.
Market-Sizing & Forecasting
A top-down reconstruction began with country textile waste generation, adjusted by documented collection ratios and material-recovery yields to derive recyclable fiber tonnage, which was monetized using region-specific average selling prices. Select bottom-up checks installed shredding capacity roll-ups and sampled ASP × volume for six large recyclers validated totals. Key model drivers include per-capita apparel consumption, announced EPR start dates, mechanical versus chemical yield differentials, virgin-to-recycled price spreads, and learning curve cost declines. A multivariate regression blended with scenario analysis projects these variables through 2030; gaps in bottom-up inputs are bridged with pilot-scale yield benchmarks.
Data Validation & Update Cycle
Outputs pass a two-stage review where senior analysts compare results with historic trade flows and independent waste audits; anomalies trigger re-contact of sources before sign-off. Reports refresh annually, with interim updates for material events, and a final pre-publication pass ensures clients receive the latest calibrated view.
Why Mordor's Textile Recycling Baseline Stands Up to Scrutiny
Published estimates often diverge because firms vary scope, yield assumptions, and refresh cadence.
Differences usually hinge on whether resale turnover is counted, if energy recovery is included, the breadth of waste streams modeled, and currency-year alignment. Mordor analysts restrict scope to true fiber regeneration revenue, apply live selling prices, and revisit yield assumptions every twelve months, making our baseline dependable for decision-makers.
Benchmark comparison
| Market Size | Anonymized source | Primary gap driver |
|---|---|---|
| USD 6.62 B | Mordor Intelligence | - |
| USD 8.41 B | Global Consultancy A | Includes distribution-channel mark-ups and resale turnover; uses 2024 prices without currency adjustment |
| USD 4.97 B | Industry Publisher B | Excludes chemical-recycling revenue and models only apparel waste, leading to lower capacity build-out |
The comparison shows totals rise when retail activity is blended in and fall when chemical output is ignored. By centering on verifiable recycling outputs and regularly refreshed variables, Mordor Intelligence delivers a balanced, transparent baseline that clients can act on with confidence.


Key Questions Answered in the Report
What is the current size of the textile recycling market?
The textile recycling market reached USD 7.25 billion in 2026 and is projected to grow to USD 11.39 billion by 2031.
Which material segment dominates textile recycling?
Polyester leads, holding 44.30% of the textile recycling market share in 2025.
Why is the Middle East the fastest-growing region?
Government circular-economy programs, such as the UAE’s Circulife, coupled with strategic location between Europe and Asia, drive an 8.74% CAGR through 2031.
How do Extended Producer Responsibility policies influence the market?
EPR shifts end-of-life costs to producers, ensuring predictable fee revenue for recyclers and mandating collection systems that expand feedstock supply across the EU and other adopting regions.
Page last updated on:


