Textile Waste Management Market Size and Share
Market Overview
| Study Period | 2020 - 2031 |
|---|---|
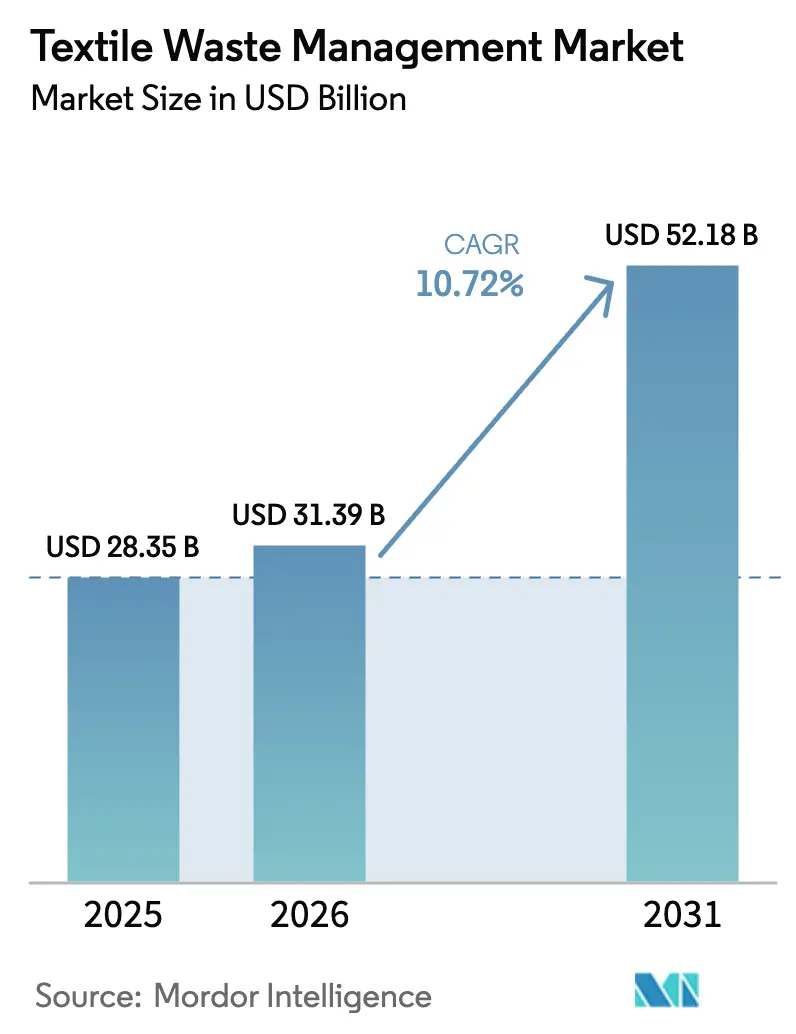
| Market Size (2026) | USD 31.39 Billion |
| Market Size (2031) | USD 52.18 Billion |
| Growth Rate (2026 - 2031) | 10.72% CAGR |
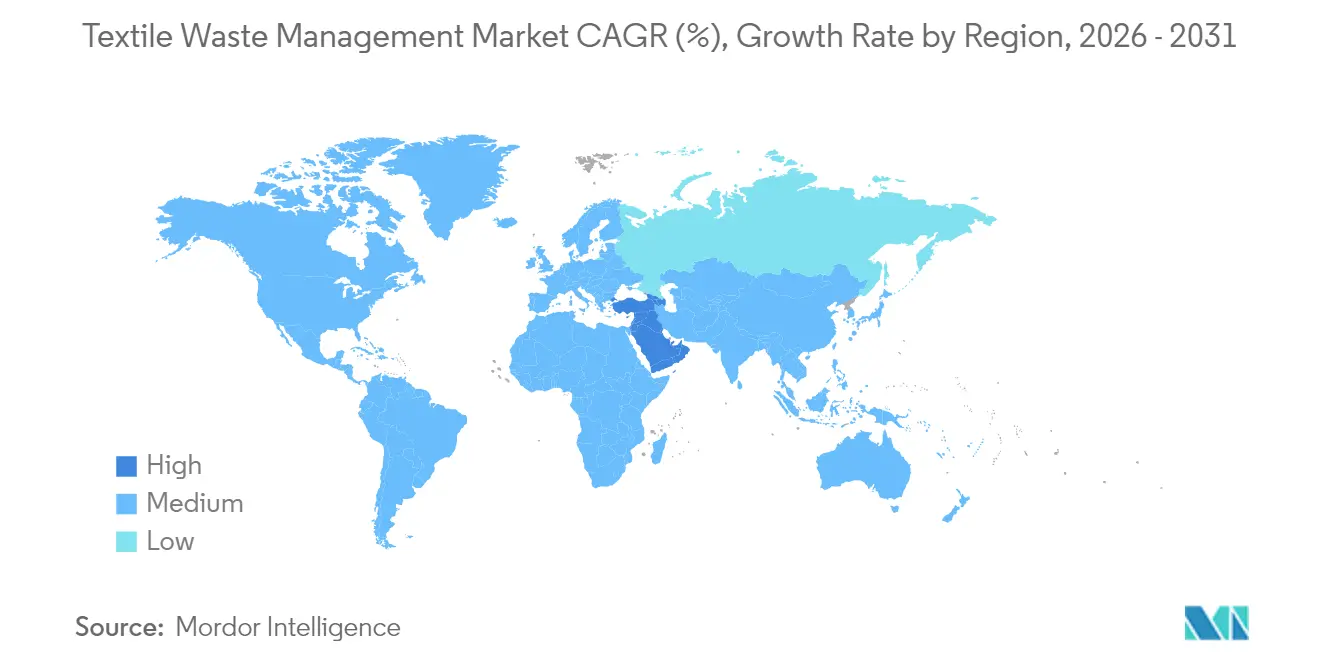
| Fastest Growing Market | Middle East |
| Largest Market | Asia Pacific |
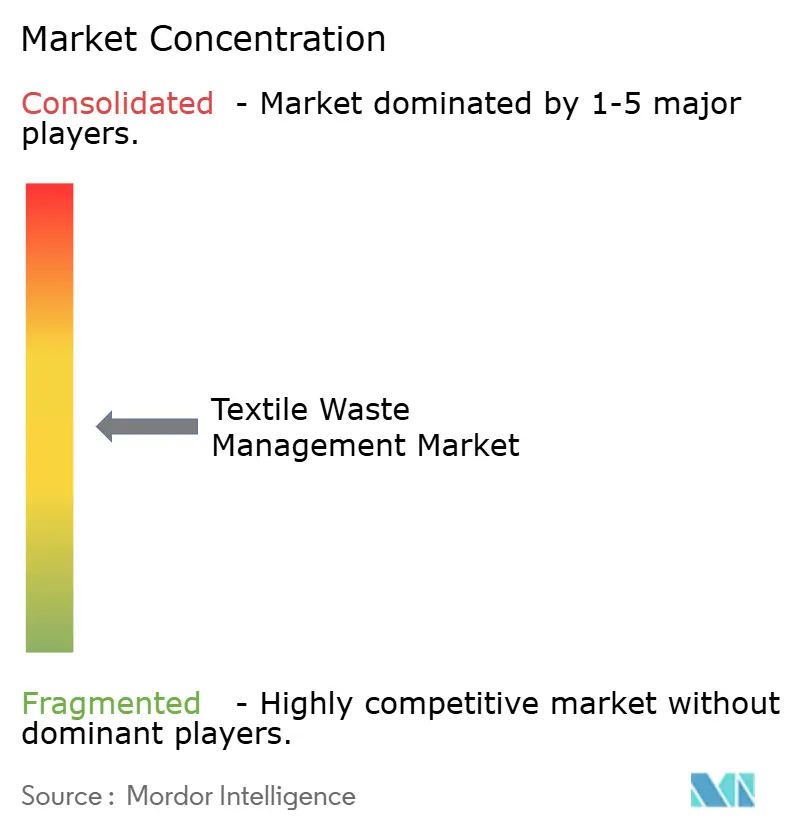
| Market Concentration | Medium |
Major Players
*Disclaimer: Major Players sorted in no particular order Image © Mordor Intelligence. Reuse requires attribution under CC BY 4.0. |
|
Textile Waste Management Market Analysis by Mordor Intelligence
Textile Waste Management Market size market size in 2026 is estimated at USD 31.39 billion, growing from 2025 value of USD 28.35 billion with 2031 projections showing USD 52.18 billion, growing at 10.72% CAGR over 2026-2031. This momentum results from tightening global rules that oblige brands and municipalities to collect textiles separately, which in turn guarantees a steady feedstock stream for recyclers. One immediate implication is that scale advantages will increasingly shift toward operators able to integrate collection, sorting, and advanced recycling within the same corporate structure. Asia holds the largest Textile Waste Management market share at 46% because of its dominant position in garment manufacturing, yet its fragmented informal networks reveal a latent capacity for efficiency gains. The ongoing push toward traceability through digital product passports signals that transparency will likely become a non-negotiable standard for accessing premium offtake agreements. Between 2025 and 2030, the Textile Waste Management industry is expected to absorb a cumulative feedstock volume that far exceeds current processing capacity, indicating that delayed investment decisions could translate into scarcity pricing for sorted bales. The Middle East leads in expansion pace with an anticipated 8.4% CAGR, fueled by sovereign circular-economy schemes that underwrite large chemical recycling hubs. This regional dynamic suggests that established recyclers in Europe and North America may explore joint ventures in the Gulf to hedge against energy-price volatility at home. At the same time, growing landfill levies on both sides of the Atlantic create a predictable revenue pool for contractors that can prove diversion outcomes to municipalities. The widening gap between collection growth and processing readiness implies an imminent wave of consolidation, especially among technology-rich start-ups that lack the balance-sheet strength to scale alone.
Key Report Takeaways
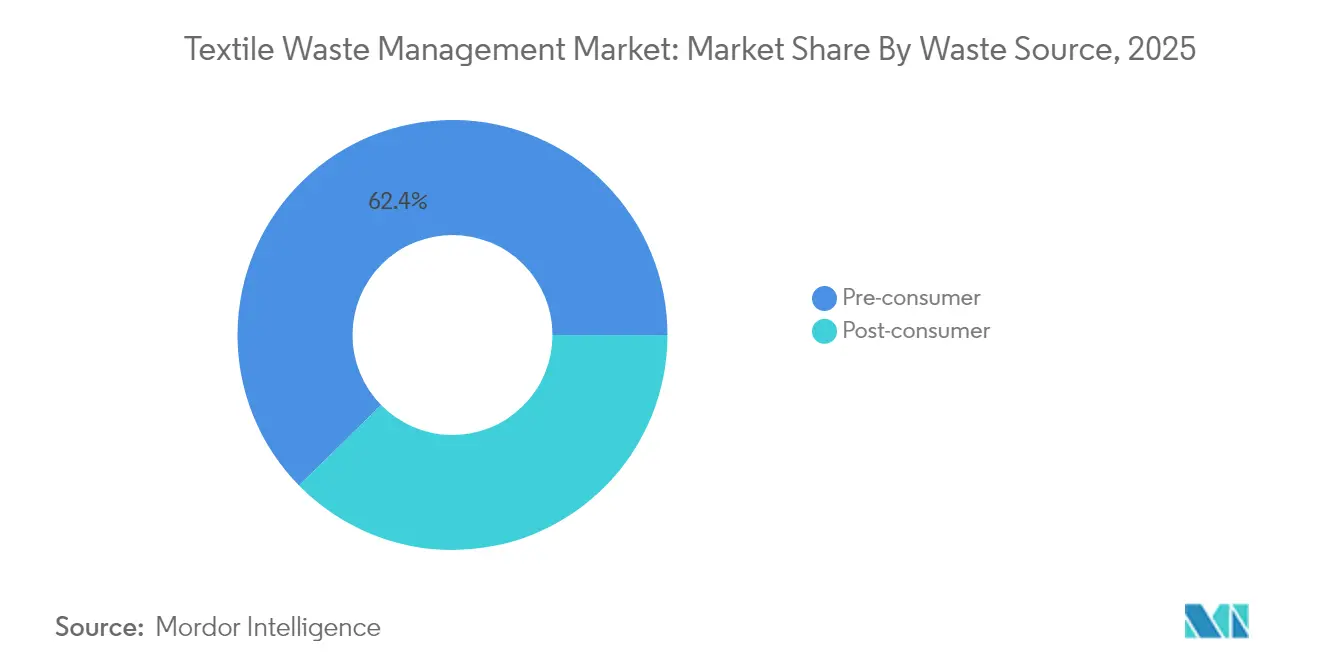
- By waste source, the pre-consumer segment accounted for 62.35% of the Textile Waste Management market share in 2025, whereas post-consumer waste is forecast to expand at a 9.55% CAGR through 2031.
- By waste type, synthetic fibers, mainly polyester, represented 47.25% of the Textile Waste Management market size in 2025, whereas cellulosic and regenerated fibers exhibit an 8.63% forecast CAGR, making them the fastest-growing waste cohort.
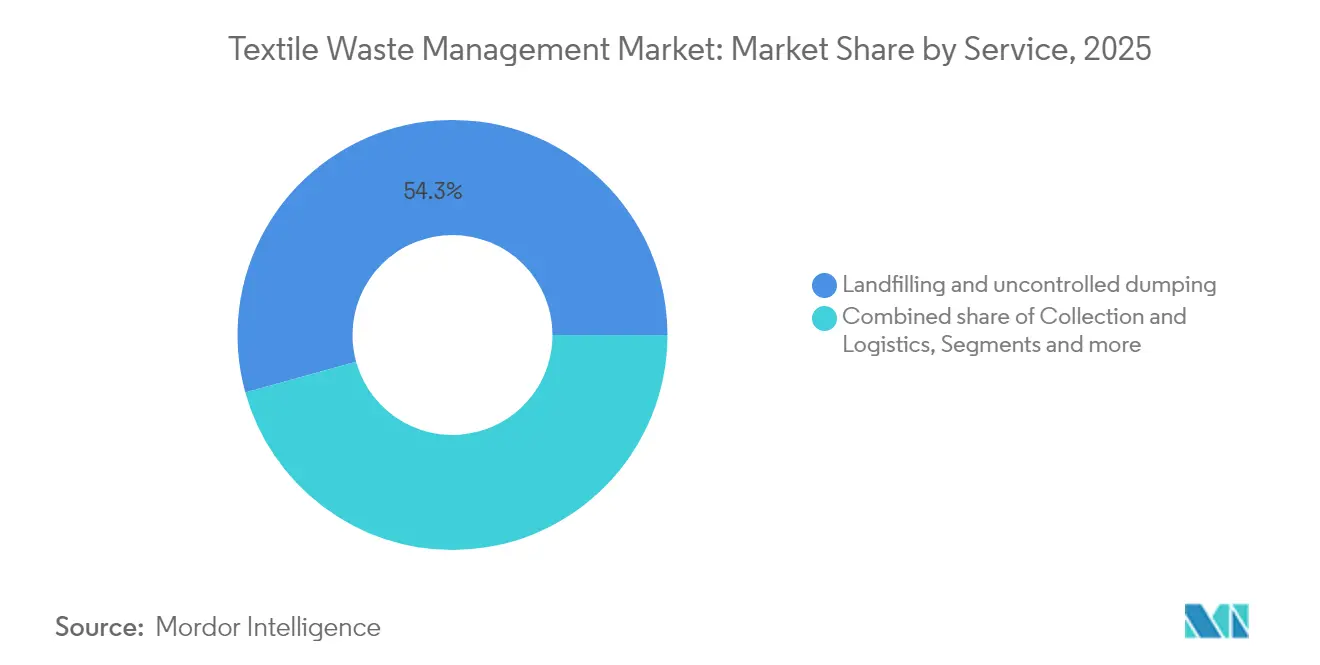
- By service, landfilling and uncontrolled dumping accounted for 54.30% of the Textile Waste Management industry's disposal in 2025, whereas chemical and enzymatic recycling displays a 9.98% CAGR projection to 2031.
- By end-user, industrial manufacturing commanded a 61.15% Textile Waste Management market share in 2025, whereas residential use is projected to post a 12.22 % CAGR up to 2031, marking it as the fastest-growing end-user category.
- By geography, Asia held 45.65% Textile Waste Management market share in 2025, whereas the Middle East is set to grow at a 8.15% CAGR over 2026-2031.
Note: Market size and forecast figures in this report are generated using Mordor Intelligence’s proprietary estimation framework, updated with the latest available data and insights as of 2026.
Global Textile Waste Management Market Trends and Insights
Drivers Impact Analysis*
| Driver | (~) % Impact on CAGR Forecast | Geographic Relevance | Impact Timeline |
|---|---|---|---|
| Mandatory separate textile-waste collection deadlines | +2.1 | EU, Japan, South Korea | Short term (≤2 years) |
| Rapid urban middle-class growth in South & Southeast Asia | +1.8 | South & Southeast Asia | Long term (≥5 years) |
| Escalating landfill & incineration levies | +1.5 | Europe, North America | Medium term (3-4 years) |
| Sustainability-linked finance expansion | +1.5 | Global | Long term (≥5 years) |
| GCC sovereign circular-economy funds | +1.2 | Middle East | Medium term (3-4 years) |
| Source: Mordor Intelligence | |||
Mandatory Separate Textile-Waste Collection Deadlines
Mandatory separate collection deadlines in the European Union, Japan, and South Korea are set to triple the volume of sorted textiles entering formal channels within five years.[1]European Environment Agency. "Most textile waste goes unsorted in Europe." https://www.eea.europa.eu/en/newsroom/news/most-textile-waste-goes-unsorted. Early-stage modelling indicates that lower feedstock costs will quickly accentuate the spread between operators who own sorting capacity and those who purchase material on the spot market. As a result, recyclers that finalize offtake agreements now will likely lock in margin advantages before processing fees reset. The accelerated build-out of municipal drop-off sites also creates an immediate need for automated sorting technologies, making investment in optical scanners and robotics a likely priority.
Rapid Urban Middle-Class Growth in South & Southeast Asia
Swelling disposable incomes across Bangladesh, Vietnam, and Indonesia are propelling household textile consumption and correspondingly larger post-consumer waste streams. Formalizing the many informal pickers and traders remains the key hurdle, yet evidence from Bangladesh shows that structured aggregation can simultaneously reduce child labor risks and unlock new green-job pathways. The surge in material flow is prompting local authorities to weigh landfill taxes, a policy step that could compress collection margins if recyclers do not upskill sorting standards. Consequently, developers of low-capex traceability apps stand to gain a first-mover advantage by streamlining payment flows to informal collectors.
Escalating Landfill & Incineration Levies
Rising landfill and incineration levies in Europe and several U.S. states add a direct cost burden that now surpasses gate fees for sorted recycling in many districts. Municipalities are therefore redirecting contracts toward service providers that guarantee diversion and revenue sharing on resale. This shift signals that profit pools are migrating from volume-based tipping fees toward performance-linked recycling fees. Operators that can validate diversion rates through auditable data platforms will capture longer-term public contracts, an advantage that improves bankability for future plant expansions.
Surge in Sustainability-Linked Finance
Green bonds, transition loans, and blended-finance vehicles are reducing the weighted average cost of capital for Textile Waste Management market participants. This cheaper funding drives shorter payback periods for expensive chemical or enzymatic reactors, which historically struggled to reach commercial scale. Because coupon step-ups are tied to diversion or emissions targets, executives now prioritize real-time performance dashboards to avoid margin erosion. Investors are using these data layers to differentiate between operators based on verified impact rather than stated intent, a trend that may penalize firms without rigorous monitoring systems.
Restraints Impact Analysis*
| Restraint | (~) % Impact on CAGR Forecast | Geographic Relevance | Impact Timeline |
|---|---|---|---|
| Limited readiness of blended-fabric recycling technologies | –1.8 | Global | Short term (≤2 years) |
| Fragmented informal collection in Africa & South America | –1.3 | Africa, South America | Medium term (3-4 years) |
| Virgin polyester price volatility | –1.2 | Asia, Global | Medium term (3-4 years) |
| Patchy EPR coverage in North America | –1.0 | North America | Medium term (3-4 years) |
| Source: Mordor Intelligence | |||
Fragmented Informal Collection in Africa & South America
Informal waste collection in many African countries and parts of South America is handled by thousands of independent pickers who operate without consistent training or oversight. The absence of standardized sorting practices means plastics, paper, metals, and organic waste are often mixed, which introduces dirt and moisture that lowers the usable polymer content in the bale. Uneven payment cycles push collectors to prioritize volume over cleanliness, so contaminated material routinely reaches processing plants and raises rejection rates. Processors then face higher pre-treatment costs and longer turnaround times, factors that discourage investment in modern recycling lines. Over time, the persistently poor feedstock quality limits the scale-up of recycled-content packaging commitments across regional consumer-goods and retail sectors.
*Our forecasts treat driver/restraint impacts as directional, not additive. The impact forecasts reflect baseline growth, mix effects, and variable interactions.
Segment Analysis
By Waste Source: Pre-Consumer Dominance Shifting to Post-Consumer Growth
The pre-consumer segment controls 62.35% of the Textile Waste Management market share in 2025, driven by the concentration of cutting-room waste in large Asian garment factories. Homogeneous clippings simplify baling and allow direct channeling into mechanical recycling lines, reducing unit logistics costs. Because these waste nodes are situated near manufacturing clusters, service providers capture economies of density that translate into higher operating margins. The presence of large volumes at single points also encourages early adoption of digital product passports that certify material origin, an approach that is likely to become a de facto buyer requirement in export markets.
Post-consumer waste is forecast to expand at a 9.55% CAGR through 2031, overtaking growth in the pre-consumer stream as separate-collection mandates formalize household take-back. The proliferation of curbside programs in several U.S. municipalities and EPR proposals in the EU suggests that daily textile disposal will soon be tracked much like glass or paper. That momentum implies a steeper learning curve for automated sorting equipment designed to handle variable fiber blends, pushing technology providers to fine-tune near-infrared scanners and AI classifiers. Firms that master post-consumer variability first will secure premium processing fees as brands race to meet recycled-content targets.


By Waste Type: Synthetic Fibers Lead While Cellulosics Gain Momentum
Synthetic fibers, mainly polyester, represent 47.25 % of the Textile Waste Management market size in 2025, reflecting polyester’s prominence in apparel. Extensive PET bottle recycling infrastructure provides a partial blueprint; however, closed-loop textile-to-textile streams remain embryonic, keeping fiber-grade output in short supply. Operators that retrofit bottle-line assets to digest fabric waste are discovering higher contamination rates, yet can leverage existing depolymerization know-how to shorten scale-up timelines. The incidence of oil-price swings magnifies the sensitivity of recycled-polyester margins, suggesting that hedging instruments will become standard practice for recyclers.
Cellulosic and regenerated fibers exhibit an 8.63 % forecast CAGR, making them the fastest-growing waste cohort. Advances in enzymatic hydrolysis now convert cotton into dissolving pulp with quality metrics comparable to virgin inputs, enabling textile-to-textile circularity. Pilot-plant data indicate that mixed cotton-poly blends can be fractionated economically when enzymes operate in tandem with mild solvent systems, signalling a path to unlock blended-fabric value. This progress foretells a gradual migration of market share toward chemical routes that can process multi-material garments without large fibre-quality sacrifices.
By Service: Chemical Recycling Disrupts Landfill Dominance
Landfilling and uncontrolled dumping account for 54.30% of the Textile Waste Management industry's disposal in 2025, underscoring a sizeable processing gap. Fiscal pressure from rising gate fees in Europe and North America is already squeezing landfill operators, nudging them to partner with recyclers to preserve volumes. The interplay of mounting costs and regulatory caps suggests that landfill's overall share will diminish steadily, freeing up waste streams for higher-value uses.
Chemical and enzymatic recycling displays a 9.98% CAGR projection to 2031, positioning it as the industry’s fastest-expanding service. Several brands have announced multi-year take-or-pay contracts for chemically recycled polyester, signaling robust demand that reduces offtake risk for financiers. Mechanical recyclers are accordingly investing in pre-processing lines that can supply feedstock to chemical facilities, hinting at an ecosystem where hybrid business models prevail. Energy-from-waste remains relevant in jurisdictions lacking landfill alternatives, yet carbon-pricing trajectories imply that incineration will lose competitiveness for textiles relative to closed-loop recycling.
By End-User: Industrial Manufacturing Leads While Residential Grows Fastest
Industrial manufacturing commands a 61.15% Textile Waste Management market share in 2025, underpinned by predictable waste streams and corporate sustainability goals. In-house recycling stations embedded within mills are steadily becoming standard equipment, reflecting an emerging norm where waste diversion is treated as a production KPI rather than an external service. The clustering of such systems within export-oriented zones in China and Vietnam creates an opportunity for localized chemical recyclers to secure steady feedstock with minimal transportation cost.
Residential use is projected to post a 12.22% CAGR up to 2031, marking it as the fastest-growing end-user category. Municipal contract structures that pay per pound collected are nudging households to separate garments for curbside pick-up, and mobile apps are gamifying this behavior by awarding micro-incentives. The pattern suggests that consumer engagement strategies will evolve into potent levers for securing low-contamination input, particularly as digital IDs embedded in garments streamline sorting. Institutional users such as hotels and hospitals are gradually formalizing their disposal policies, an indication that bulk-collection niches beyond the household sector may soon deliver sizeable tonnage jumps.
Geography Analysis
Asia holds 45.65% Textile Waste Management market share in 2025, anchored by China and propelled by India and Bangladesh. While China’s policy framework gradually tightens, Bangladesh’s transition from informal to semi-formal collection reveals a latent acceleration path once material quality standards stabilize. The formation of industry-government taskforces in Dhaka hints that formal sector recyclers will gain privileged access to waste streams, thereby squeezing intermediaries without compliance capabilities. This transformation implies a likely reshaping of labor practices as mechanized sorting lines replace manual grade-outs.
The Middle East records the highest growth trajectory at 8.15% CAGR for 2026-2031, propelled by sovereign mandates that aim to divert up to 90% of waste from landfills by 2040. Anchor projects such as the Landmark CircuLife facility in the UAE showcase region-specific advantages like low energy costs and integrated free-zone logistics. Regional regulators are imposing minimum recycled-content standards on locally produced textiles, which could generate a captive demand pool for Gulf-based output. The ensuing supply stability may attract global apparel brands to establish sourcing bases in the region, implicitly diversifying geopolitical risk.
Europe leads on regulatory clarity after adopting a union-wide requirement for separate textile collection by January 2025. Current capture rates hover near 15%, indicating ample headroom as infrastructure scales. Parallel debate on eco-modulated fees suggests that producers moving fastest on recyclability design will bear lower compliance costs, incentivizing upstream fiber choices. North America shows uneven progress, with states such as Massachusetts implementing landfill bans that create regional pockets of feedstock surplus, pushing recyclers to expand capacity where policy certainty exists. Latin American and African markets remain constrained by informal systems; however, pilot EPR schemes in Chile and Ghana could serve as templates for broader adoption, signaling entry opportunities once governance stabilizes.

Competitive Landscape
The textile waste management market features a moderately fragmented field comprising specialized recyclers, diversified waste firms, and vertically integrated fiber producers. Fragmentation allows niche players to thrive, yet scale economics in chemical recycling create an incentive for mergers that secure both feedstock and offtake. The failure of a notable Nordic innovator in 2024 illustrates that technology leadership without iron-clad purchase agreements exposes companies to cash-flow stress even when market demand exists. Investors now scrutinize counterparty creditworthiness of brand commitments before financing new capacity, a dynamic that rewards recyclers with multi-year contracts underwritten by household apparel names.
Technological differentiation is emerging as the primary competitive lever. Enzymatic platforms that can depolymerize blended fabrics into monomers are drawing significant venture capital interest, signifying a belief that closed-loop processes will unlock premium fiber pricing. At the same time, established general-waste contractors leverage expansive municipal relationships to secure collection contracts, enabling them to bolt textile sorting modules onto existing material recovery facilities at marginal cost. This hybridization suggests converging business models in which technology-rich start-ups collaborate with logistics-rich incumbents to bridge each other’s gaps rather than compete head-on.
Vertical integration also shapes strategy as large fiber producers pursue backward linkages to guarantee feedstock resilience. Public filings show that several global polyester makers have allocated multi-hundred-million-dollar capex toward acquiring or joint-venturing with recyclers. This approach locks in supply security and allows manufacturers to offer traceable recycled content to apparel brands under pressure from buyers. The evolving picture implies that pure-play recyclers may face acquisition bids, particularly those holding IP for low-energy chemical pathways.
Textile Waste Management Industry Leaders
-
Worn Again Technologies
-
Boer Group
-
Pistoni S.r.l
-
Renewcell AB
-
Veolia Environnement S.A.
- *Disclaimer: Major Players sorted in no particular order

Recent Industry Developments
- April 2025: The European Environment Agency reported annual EU textile waste generation of 6.94 million tonnes, emphasizing the scope of feedstock growth once collection infrastructure matures.
- March 2025: Washington introduced a state-level textile EPR bill, joining California and New York in advancing producer responsibility legislation in North America.
- March 2025: The Government of Canada provided USD 0.66 million to establish the Canadian Circular Textiles Consortium, positioning the country to lead coordinated circular economy initiatives.
- January 2025: The Environment Agency Abu Dhabi announced that its beverage Bottle Return Scheme surpassed 2,000 tonnes of material recovered since 2023, creating a proof point for extended collection systems suitable for textiles


Research Methodology Framework and Report Scope
Market Definitions and Key Coverage
Our study defines the textile waste management market as every paid activity that collects, transports, sorts, treats, recovers energy from, or finally disposes of pre- and post-consumer textile waste, including industrial off-cuts and household discards that still retain a textile identity. Revenue streams cover service fees, gate fees, tipping fees, and sales of recovered fibers or energy.
Scope Exclusion: Consultancy, purely voluntary donation programs, and trade in second-hand garments are not valued here.
Segmentation Overview
-
By Waste Source
- Pre-consumer (Manufacturing Scrap)
- Post-consumer (Used Garments & Household Textiles)
-
By Waste Type
-
Natural Fibers
- Cotton
- Wool
- Silk
- Others(Jute, Animal Fibre, etc.)
-
Synthetic Fibers
- Polyester
- Nylon
- Others (Acrylic, Rayon, etc.)
-
Cellulosic & Regenerated Fibers
- Viscose / Rayon
- Lyocell / Modal
- Blended Fabrics
- Hazardous / Contaminated Textiles
-
Natural Fibers
-
By Service
- Collection & Logistics
- Sorting & Grading
- Recycling (Mechanical, Chemical/Enzymatic, Reuse)
- Energy Recovery (Incineration & WtE)
- Landfill / Open Dumping
-
By End-User
- Residential / Household
- Commercial & Institutional (Retail, Hospitality)
- Industrial Manufacturing (Apparel & Footwear)
- Others (Municipal Garbage, Medical Facilities, etc.)
-
By Geography
-
North America
- United States
- Canada
- Mexico
-
South America
- Brazil
- Argentina
- Rest of South America
-
Europe
- Germany
- France
- United Kingdom
- Italy
- Spain
- BENELUX (Belgium, Netherlands, and Luxembourg)
- NORDICS (Denmark, Finland, Iceland, Norway, and Sweden)
- Rest of Europe
-
Asia-Pacific
- China
- Japan
- India
- Bangladesh
- South Korea
- ASEAN (Indonesia, Thailand, Philippines, Malaysia, Vietnam)
- Rest of Asia-Pacific
-
Middle East and Africa
- Saudi Arabia
- United Arab Emirates
- Turkey
- Egypt
- South Africa
- Rest of Middle East and Africa
-
North America
Detailed Research Methodology and Data Validation
Primary Research
We spoke with recycling plant operators, landfill managers, brand sustainability leads, and waste regulators across Asia, Europe, and North America. Their interviews clarified real collection rates, typical contract tenures, and region-specific price escalators, letting us test desk assumptions and recalibrate our baseline.
Desk Research
Mordor analysts began with official datasets such as Eurostat's Waste Statistics, the US Environmental Protection Agency's Advancing Sustainable Materials reports, and United Nations Comtrade shipment codes for worn clothing. These were blended with insights from Textile Exchange's Materials Market Report, OECD waste levy trackers, and peer-reviewed studies on recycling yields. Company 10-Ks, municipal tenders, and press releases filled cost and capacity gaps. Paid access to D&B Hoovers supplied audited revenue splits for key service providers, while Dow Jones Factiva flagged price shifts after policy changes. This list illustrates our desk sources; many additional publications were consulted for validation and context.
Market-Sizing & Forecasting
A top-down reconstruction starts with national textile waste generation volumes, which are rebuilt from production, import, export, and average garment lifetime data before being multiplied by documented collection ratios. Results are cross-checked through selective bottom-up roll-ups that sample operator revenues and average service prices. Key model inputs include mandatory separate-collection deadlines, landfill fee trajectories, chemical recycling yields, energy-from-waste efficiency, and extended producer responsibility levies. Forecasts use multivariate regression blended with scenario analysis to capture policy shocks and technology learning curves. Data holes in bottom-up samples are bridged using nearest-neighbor pricing and regional elasticity factors vetted by interviewees.
Data Validation & Update Cycle
Outputs pass automated variance checks against historical waste generation, followed by senior analyst peer review. Anomalies trigger re-contacts with earlier respondents. We refresh the dataset each year and issue interim updates when material events, such as an EU landfill ban, shift fundamentals. A final sense check is completed immediately before report release.
Why Mordor's Textile Waste Management Baseline Commands Reliability
Published figures often diverge because firms vary the waste streams they count, the years they fix as baselines, and the way they translate local fees into constant dollars.
Key gap drivers for this market include whether pre-consumer scraps are in scope, if revenues from energy recovery are counted, the currency conversion approach, and the cadence at which policy impacts are folded into growth paths.
Benchmark comparison
| Market Size | Anonymized source | Primary gap driver |
|---|---|---|
| USD 28.35 B (2025) | Mordor Intelligence | |
| USD 7.60 B (2024) | Global Consultancy A | Counts only recycling revenues and omits disposal and energy recovery while using spot exchange rates |
| USD 8.50 B (2024) | Industry Association B | Bases estimate on nominal recycling capacity, excludes pre-consumer scraps, applies one global growth factor |
| USD 3.50 B (2023) | Analytics Firm C | Mixes volume and value data, values only collection and sorting, projects fixed 12 % CAGR without variable testing |
The comparison shows that once a full service chain, constant-currency accounting, and verified regional variables are applied, Mordor's balanced baseline stands closest to observable cash flows and therefore gives decision-makers the most dependable starting point for strategy.


Key Questions Answered in the Report
What is the Textile Waste Management market size in 2026?
The market size is USD 31.39 billion in 2026.
How fast is the Textile Waste Management industry expected to grow?
The industry is forecast to grow at a CAGR of 10.72 % between 2026 and 2031.
Which region holds the largest Textile Waste Management market share?
Asia leads with 45.65 % market share due to its extensive garment manufacturing base.
Which service segment is expanding quickest?
Chemical and enzymatic recycling is the fastest-growing service segment with a projected 9.98 % CAGR through 2031.
Why are landfill levies influencing textile recycling economics?
Higher levies raise disposal costs, making recycling contracts financially attractive for municipalities and waste firms.
What role do separate collection mandates play?
They guarantee feedstock availability for recyclers by legally requiring municipalities to divert textiles from general waste streams.
Page last updated on:


