Recycled Plastics Market Size and Share
Market Overview
| Study Period | 2020 - 2031 |
|---|---|
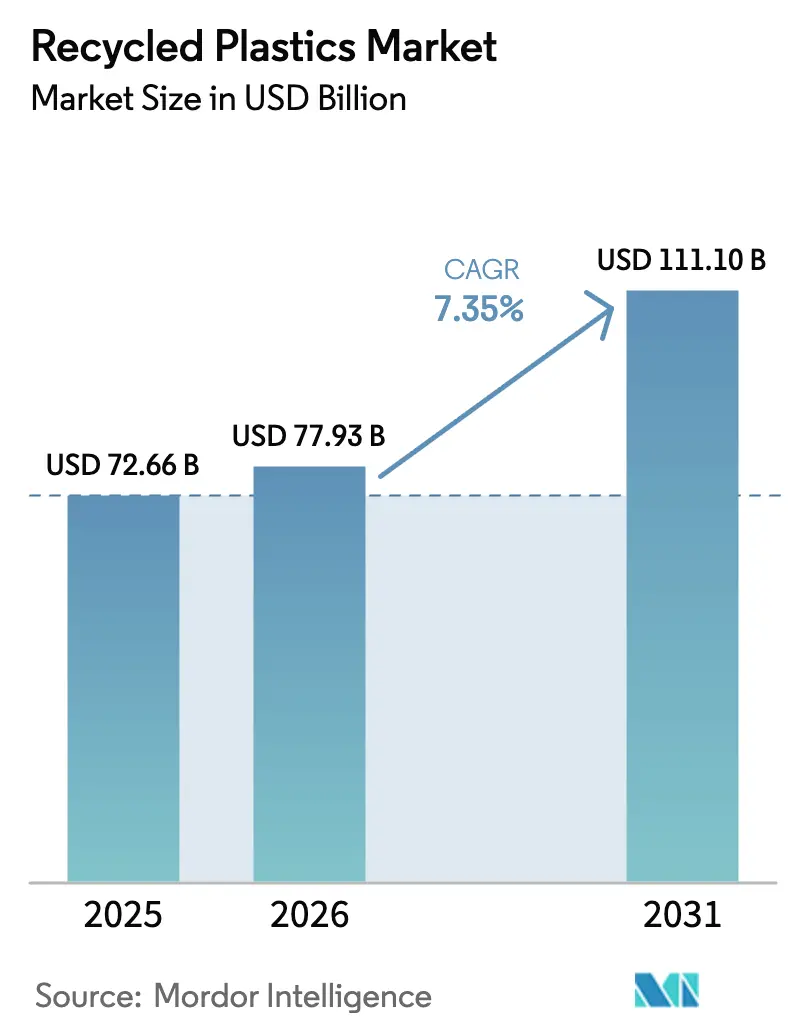
| Market Size (2026) | USD 77.93 Billion |
| Market Size (2031) | USD 111.10 Billion |
| Growth Rate (2026 - 2031) | 7.35% CAGR |
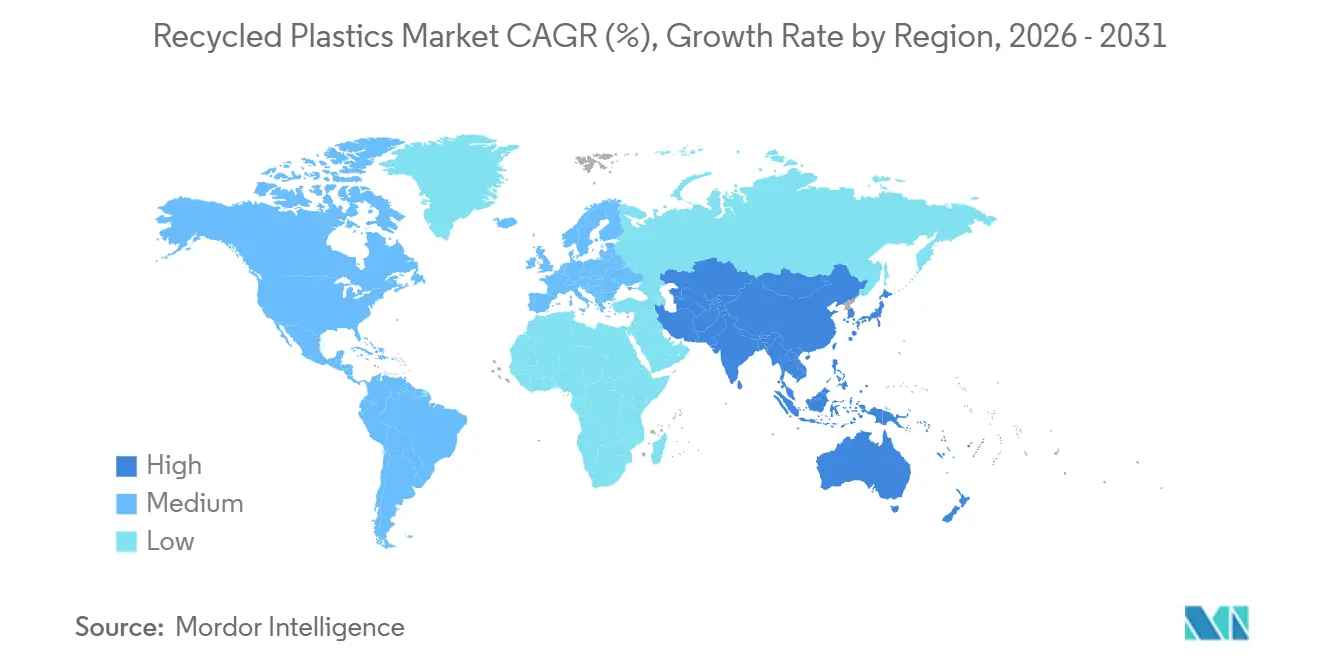
| Fastest Growing Market | Asia Pacific |
| Largest Market | Asia Pacific |
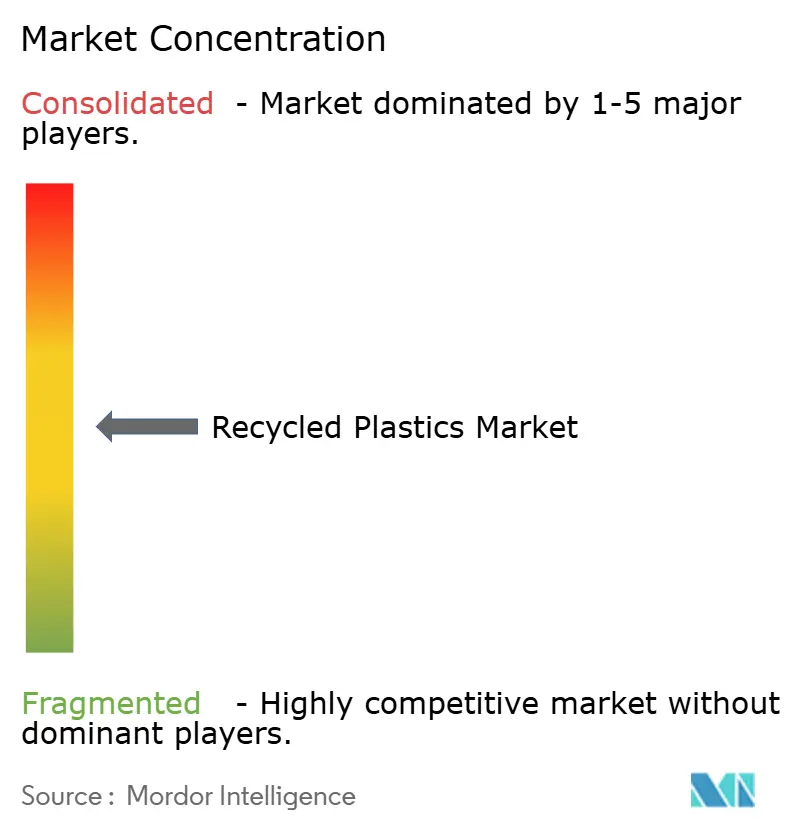
| Market Concentration | Medium |
Major Players *Disclaimer: Major Players sorted in no particular order Image © Mordor Intelligence. Reuse requires attribution under CC BY 4.0. | |
Recycled Plastics Market Analysis by Mordor Intelligence
The Recycled Plastics Market size is projected to be USD 72.66 billion in 2025, USD 77.93 billion in 2026, and reach USD 111.10 billion by 2031, growing at a CAGR of 7.35% from 2026 to 2031.
Regulatory pressure is now the primary force shaping supply chains, led by the European Union’s Packaging and Packaging Waste Regulation that establishes minimum recycled content thresholds across plastic packaging categories beginning in 2026. Asia-Pacific leads demand and capacity build-out as Extended Producer Responsibility frameworks spread across major Southeast Asian markets alongside China’s nationwide expansion of waste-sorting programs. Technology maturation is visible in enzymatic PET depolymerization reaching commercial timelines at Carbios-led facilities and in the use of long-term offtake contracts that stabilize recycler revenue and unlock financing. North America continues to add infrastructure with support from U.S. Environmental Protection Agency grants, though collection and contamination variability limit the share of food-grade output today.[1]U.S. Environmental Protection Agency, “Solid Waste Infrastructure for Recycling Grants,” U.S. EPA, epa.govAutomotive and other engineering uses are fast-growing as OEM programs align with circularity goals and end-of-life requirements, while packaging remains the anchor application under content mandates and brand targets.
Key Report Takeaways
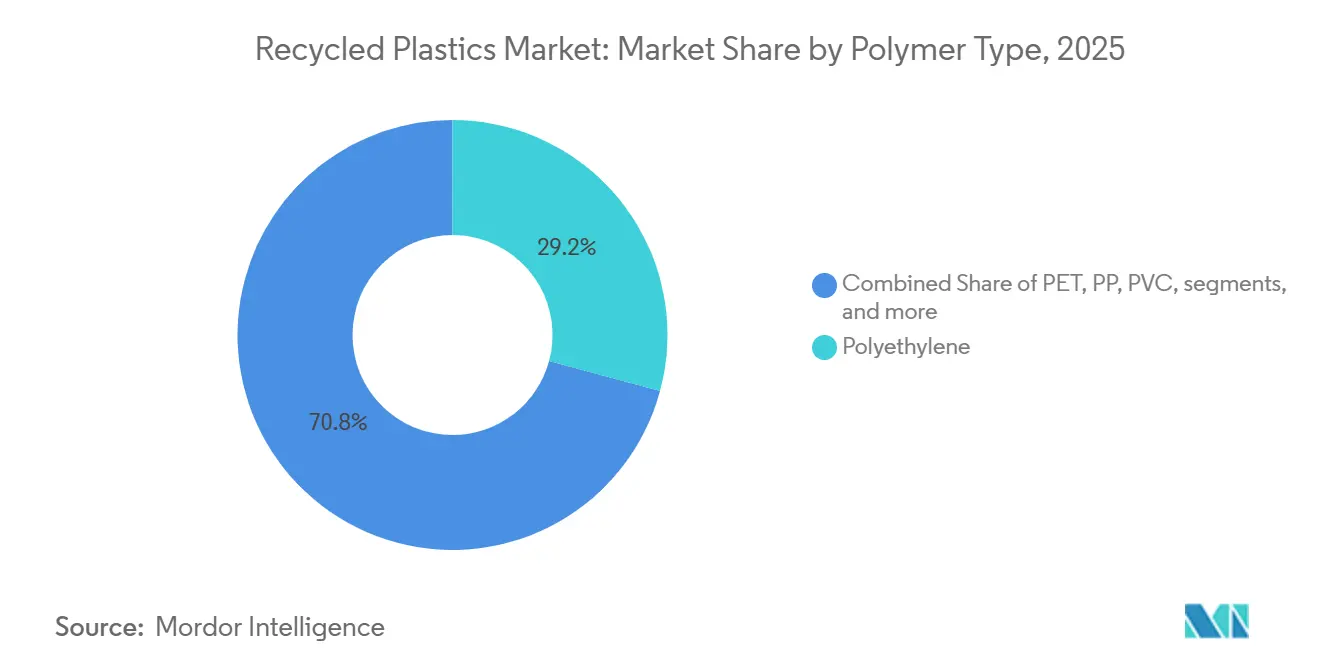
- By polymer type, polyethylene captured 29.18% of the recycled plastics market share in 2025. The other plastics segment is projected to grow at 9.15% CAGR through 2031.
- By the recycling process, mechanical recycling accounted for 70.8% of the recycled plastics market share in 2025. Chemical or advanced recycling is projected to grow at 8.71% CAGR through 2031.
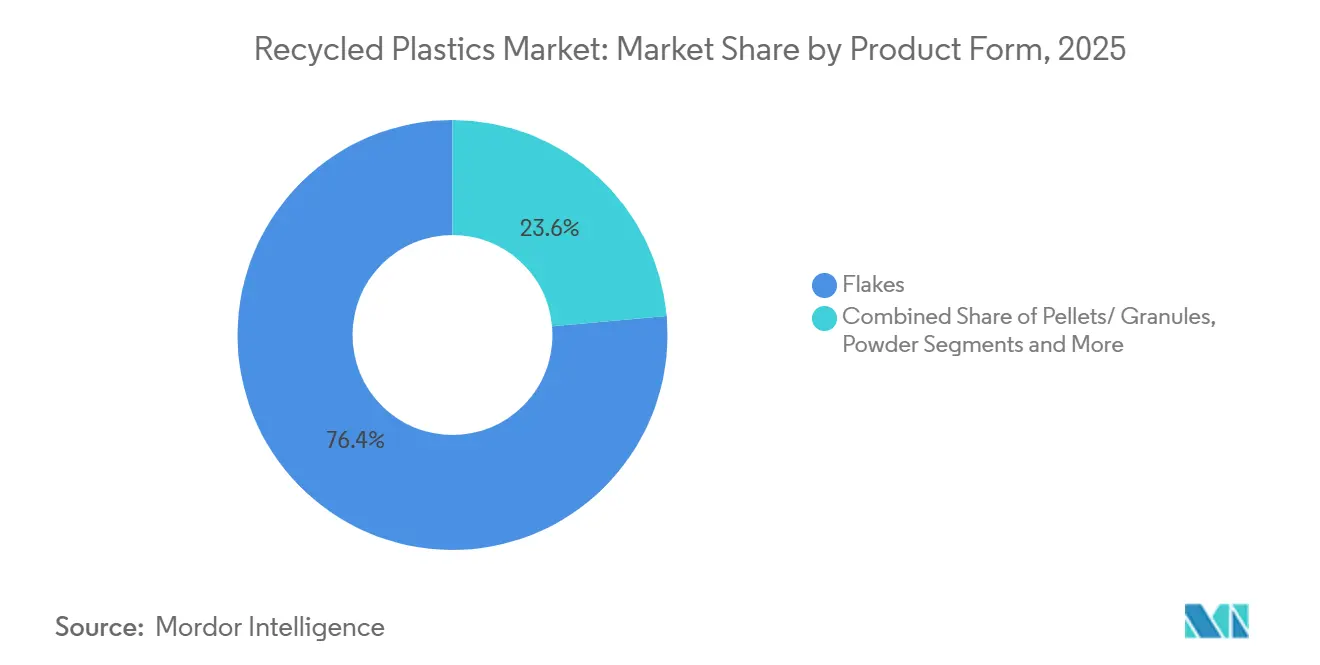
- By product form, flakes captured 76.4% of the recycled plastics market size in 2025. The pellets segment is projected to grow at 7.89% CAGR through 2031.
- By end-use application, packaging held 38.8% of the recycled plastics market size in 2025. Automotive is projected to grow at 10.22% CAGR through 2031.
- By geography, Asia-Pacific commanded 48.7% of the recycled plastics market share in 2025. Asia-Pacific is projected to expand at 8.32% CAGR through 2031.
Note: Market size and forecast figures in this report are generated using Mordor Intelligence’s proprietary estimation framework, updated with the latest available data and insights as of January 2026.
Global Recycled Plastics Market Trends and Insights
Drivers Impact Analysis*
| Drivers | (~) % Impact on CAGR Forecast | Geographic Relevance | Impact Timeline |
|---|---|---|---|
| EU Packaging & Packaging Waste Regulation (PPWR) 30 % recycled-content mandate | +1.8% | Europe (Germany, France, Italy, BENELUX, Nordics) | Medium term (2-4 years) |
| Sustained high virgin polymer prices (less than USD 1 600/ton HDPE), improving recycled polyethylene (rPE) economics | +1.3% | Global, acute in North America & Europe | Short term (≤ 2 years) |
| China’s “Zero-Waste Cities 2.0” rollout boosting household plastics collection | +1.2% | APAC core (China urban clusters), spill-over to ASEAN | Short term (≤ 2 years) |
| U.S. EPA USD 375 million Recycling-Infrastructure Grants unlocking new capacity | +0.8% | North America (U.S. municipalities, tribal regions) | Medium term (2-4 years) |
| Commercial enzymatic PET depolymerization | +0.7% | Global (initial hubs: India, France, China) | Long term (≥ 4 years) |
| Corporate recycled-plastic PPAs | +0.6% | Global (brand-recycler direct contracts) | Short term (≤ 2 years) |
| Source: Mordor Intelligence | |||
EU PPWR 30% Recycled-Content Mandate Drives Closed Loop Investment
The European Union’s Packaging and Packaging Waste Regulation entered into force on February, 2025, and applies from August, 2026, setting minimum recycled content thresholds for plastic packaging, including 30% for contact-sensitive PET, 10% for other contact-sensitive plastics, 30% for single-use beverage bottles, and 35% for the remaining categories, with further increases through 2040. This clarity has enabled new project financing for advanced closed-loop capacity, including Veolia’s commitment to a tray-to-tray PET facility in Shrewsbury with planned throughput of 80,000 tonnes per year, supported by a GBP 70 million investment (USD 88.9 million). Loop Industries also advanced its first European Infinite Loop license at BASF’s Schwarzheide site, with an initial license payment of EUR 10 million (USD 10.8 million) and a target of 70,000 metric tons per year by 2030. Producer-responsibility fee modulation based on recyclability grades in markets like France adds further price signals that favor mono-material over multi-layer designs. Imports of recyclate face rigorous equivalence and compliance requirements under EU food-contact regulations, reinforcing investment in domestic, auditable supply.
Sustained Virgin HDPE Prices Above USD 1,600/t Improve rPE Economics
When virgin high-density polyethylene prices remain elevated, converters reconsider recycled HDPE and LDPE for packaging and industrial uses that can tolerate or benefit from PCR content. Mandates and content targets also underpin stable demand for natural rHDPE in beverage and household applications. The Association of Plastic Recyclers reported that reclaimers across the United States and Canada could process nearly 2 billion additional pounds annually if feedstock quality and end-market demand are sustained. This available capacity allows the recycled plastics market to respond faster when virgin price arbitrage improves PCR economics. The combination of sustained virgin price premiums and incremental policy pressure supports higher recycled-content utilization in durable and semi-durable applications.
China Zero-Waste Cities 2.0 Expands Household Plastics Collection Infrastructure
China is scaling its waste-free city program to roughly 200 cities during the 15th Five-Year Plan period spanning 2026 to 2030, with a target of 60% participation by 2027 and comprehensive implementation by 2035, expanding the volume and quality of sorted post-consumer plastics.[2]China State Council Information Office, “Waste-Free Cities Initiative,” China.org.cn The initiative integrates plastics recycling across key urban clusters, including Beijing-Tianjin-Hebei, the Yangtze River Delta, the Guangdong-Hong Kong-Macao Greater Bay Area, and Chengdu-Chongqing. Shanghai’s June 2024 regulation established strict sorting compliance that lifted the city’s overall recycling rate, which strengthens feedstock reliability for Recycled Polyethylene Terephthalate (rPET) and polyolefins. Momentum on the technology front includes trial operations at RECON’s Shandong unit for chemical recycling of film-grade waste that is not suitable for mechanical routes. The policy scale-up and infrastructure actions reinforce Asia’s role as a primary growth region for the recycled plastics market.
U.S. EPA USD 375 Million Recycling-Infrastructure Grants Unlock Regional Capacity
The U.S. Environmental Protection Agency is deploying the Solid Waste Infrastructure for Recycling program, which is funded through the Bipartisan Infrastructure Law and supports collection, sorting, and MRF upgrades across states and tribal regions. A December 2025 round selected 17 recipients and advanced plans that channel at least 40% of benefits to disadvantaged communities under the Justice40 framework. The volume of applications in past rounds has exceeded available funds by a large multiple, which underlines the scale of U.S. infrastructure gaps relative to brand recycled-content goals. Complementary state and territory planning grants are due to flow through 2026, including support for Extended Producer Responsibility implementation and public education that boosts sorting quality. These grants help reduce bottlenecks for the recycled plastics market by improving feedstock capture and upgrading sortation technologies that increase usable yield.
Restraints Impact Analysis*
| Restraints | (~) % Impact on CAGR Forecast | Geographic Relevance | Impact Timeline |
|---|---|---|---|
| rPET flake oversupply compressing EU margins | -1.1% | Europe (Germany, France, Italy, BENELUX) | Short term (≤ 2 years) |
| Marine insurance & Asia EU freight cost escalation | -0.7% | Global trade routes (Asia-Europe corridor) | Medium term (2-4 years) |
| EU chemical-recycling mass-balance legal ambiguity | -0.5% | Europe (all Member States) | Short term (≤ 2 years) |
| Skilled-labor shortage for robotics MRFs | -0.4% | North America, Europe (aging infrastructure) | Medium term (2-4 years) |
| Source: Mordor Intelligence | |||
rPET Flake Oversupply in Europe Compresses Recycler Margins
Periods of oversupply in European rPET markets reduce pricing for flakes and compress margins for recyclers, especially when brand demand tracks the minimum thresholds under the Single-Use Plastics Directive for beverage bottles.[3]European Commission, “Regulation (EU) 2022/1616 on Recycled Plastic Materials for Food Contact,” European Commission, eur-lex.europa.eu Inventory build-ups and seasonality can intensify pressure, which in turn defers investments in quality upgrades and reduces run rates. Collection costs and energy prices also influence cost parity against virgin PET, reinforcing the need for EPR fee signals and consistent enforcement. Clarifications under EU food-contact rules sustain high-quality standards, yet they require additional documentation and process validation. Improved deposit-return performance and harmonized specifications can help stabilize demand at higher recycled-content levels within the recycled plastics market.
Escalating Marine Insurance & Asia-EU Freight Costs Pressure Feedstock Routes
Persistent disruptions on key shipping lanes and higher marine insurance premiums increase logistics costs for moving bales and pellets across Asia-Europe routes. Higher freight costs erode the cost advantage of importing PCR or flake when domestic options meet food-contact compliance without long transit times. These pressures can shift buyers toward regional supply and long-term contracts that reduce exposure to volatile spot movements. Recyclers with co-located processing and end-use partners are better positioned to maintain predictable deliveries in tight freight markets. Logistics resilience has become a differentiator for suppliers to the recycled plastics market.
*Our forecasts treat driver/restraint impacts as directional, not additive. The impact forecasts reflect baseline growth, mix effects, and variable interactions.
Segment Analysis
By Polymer Type: Polyethylene Dominance Faces Chemical Recycling Disruption
Polyethylene accounted for 29.18% in 2025, led by high-density polyethylene in rigid packaging and low-density or linear low-density polyethylene in film applications, supported by a mature collection and recycling infrastructure. Mechanical reclaimers in the United States and Canada also indicated material headroom to process more polyolefins if bale quality and downstream demand hold steady.[4]Association of Plastic Recyclers, “2025 Plastic Recycling Capacity in the US and Canada,” APR, plasticsrecycling.org
The "Other Plastics" segment is expected to grow at the fastest CAGR at 9.15%, driven primarily by the automotive and electronics sectors. Demand for these recycled engineering polymers is surging as manufacturers strive to meet stringent sustainability targets. High-performance recycled ABS, PC, and PA offer excellent mechanical properties, making them highly viable, eco-friendly substitutes for virgin resins in complex, durable manufacturing applications while advancing global circular economy initiatives.


By Recycling Process: Mechanical’s Maturity Versus Chemical’s 8.71% CAGR Sprint
Mechanical recycling accounted for 70.8% of activity in 2025, reflecting the installed base of washing, extrusion, and pelletizing lines that feed packaging, construction, and automotive applications. The recycled plastics market size for chemical routes is projected to expand at 8.71% CAGR through 2031 as brands seek food-contact and high-spec polymers from mixed or contaminated streams. The Association of Plastic Recyclers has documented significant unused capacity potential across PET, HDPE, PP, and film, contingent on better feedstock supply and consistent demand signals. Food-contact regulation shifts in the European Union place more emphasis on certifying decontamination processes, which raises both quality and traceability requirements that favor investment in proven technologies.
Advanced routes such as depolymerization complement mechanical methods by converting hard-to-recycle streams into monomers or purified polymers ready for high-value applications. Adoption patterns vary by sector, with packaging brands prioritizing food-grade consistency while automotive and electronics focus on functional performance benchmarks. Standards, certifications, and chain-of-custody documentation influence buyer confidence alongside cost, which supports steady growth in contracted volumes. As more commercial plants demonstrate reliable output, chemical recycling’s role is expected to grow within the recycled plastics market without displacing mechanical recycling’s large base.
By Product Form: Flakes’ 76.4% Dominance Amid Pellets 7.89% CAGR Ascent
Flakes represented 76.4% of output in 2025, providing a cost-effective intermediate for bottle-to-bottle rPET and for extrusion or molding in rigid containers and thermoformed packaging. Food-grade rPET flakes require rigorous super-clean and deodorization steps to meet EFSA and FDA purity expectations before conversion. The pellets segment is expected to grow at the fastest CAGR 7.89% through 2031, supported by their uniformity and process stability in closed-loop systems that serve food-contact and automotive applications. PureCycle and TOPPAN have validated more than 30% recycled content in flexible wrappers using purified polypropylene resins, signaling broader use of pelletized PCR for films and thermoforming.
The recycled plastics market benefits from the shift to pellets when converters require tight specifications on color, melt index, and odor for sensitive uses. For polyolefins, engineered PCR pellets designed to act like virgin grades reduce trial time and scrap rates during line changes. Brands and converters also value chain-of-custody systems and traceability solutions that document recycled content across shipments. As advanced routes typically yield pellets or liquid intermediates, they add to the diversity of high-quality PCR formats available to end-markets.
By End-Use Application: Packaging’s 38.8% Lead Versus Automotive’s 10.22% Acceleration
Packaging held 38.8% of demand in 2025, underpinned by brand commitments to circularity and recycled-content mandates that focus first on beverage containers and contact-sensitive applications. Food-grade rPET continues to anchor bottle-to-bottle loops, with producers demonstrating intrinsic viscosity and purity levels compatible with stringent migration testing. India’s post-2024 allowance for rPET in food-contact packaging provides an important growth channel as long as decontamination processes meet safety thresholds. Flexible packaging is an area of active innovation, where pelletized purified polypropylene offers printability and sealing performance that help meet upcoming mandates.
Automotive applications are rising at a projected 10.22% CAGR through 2031 as OEMs embed post-consumer polypropylene and HDPE into interior trims and underbody parts while meeting performance specifications. Material suppliers are also releasing long-fiber reinforced grades with substantial PCR content that achieve virgin-like mechanical properties with lower product carbon footprints. Appliances, electronics housings, and consumer goods add diversified outlets for high-quality PCR ABS, PP, and blends that meet durability and appearance needs. These end-uses broaden the recycled plastics market beyond packaging and improve the utilization of different polymer streams.
Geography Analysis
Asia-Pacific led with 48.7% share in 2025 and is projected to grow at 8.32% CAGR through 2031 as EPR programs expand across fast-growing consumer markets and large urban clusters standardize waste sorting. China’s Zero-Waste Cities 2.0 is scaling to about 200 cities from 2026 to 2030, targeting 60% participation by 2027 and aiming for comprehensive coverage by 2035, which expands feedstock availability and quality. Shanghai’s regulation raised household sorting compliance and improved the city’s overall recycling rate, both of which support higher quality rPET and polyolefin streams. Chemical recycling projects are also emerging in the region, including trial operations of new units designed to handle contaminated films and mixed plastics. This mix of policy, infrastructure, and technology signals durable growth for the recycled plastics market in Asia-Pacific.
Europe followed with a significant market share in 2025 as PPWR requirements for minimum recycled content and recyclability stimulate closed-loop investments across Member States. The Single-Use Plastics Directive’s 25% rPET target for beverage bottles in 2025 and 30% by 2030 continues to anchor demand for high-quality bottle-grade PCR. New projects include tray-to-tray PET lines in the United Kingdom alongside advanced depolymerization investments supported by state aid and innovation funding. The combination of fee modulation and brand targets encourages mono-material designs and clear labeling that improve recyclability outcomes. As import compliance tightens for food-contact applications, local supply gains an advantage where traceability is critical.
North America is addressing infrastructure gaps through federal program funding and growing state EPR laws while reclaimers report sizable unused capacity that could be activated with better feedstock quality and steady demand. Mechanical recyclers across PET, HDPE, PP, and film have the processing headroom to add output as brand specifications align and bale contamination falls. Large resin producers and converters are signing long-term agreements for advanced recycled and purified PCR feedstocks that supply mass-balance portfolios and enable food-contact or high-spec uses. As these agreements scale, they help reduce the volatility faced by reclaimers and catalyze new investments in lines that serve the recycled plastics market.

Competitive Landscape
The recycled plastics market shows moderate consolidation with integrated waste-management and polymer businesses expanding from collection through to PCR pellet production, while technology specialists license advanced depolymerization and purification methods. Veolia expanded its U.K. tray-to-tray PET capability and continues to build closed-loop partnerships to serve food and consumer brands at scale. Loop Industries progressed European siting with a BASF Schwarzheide location and is building a pipeline of agreements for textile-to-polyester circularity. Brand and converter offtakes that specify certified PCR feedstocks are increasingly central to capital investment decisions.
Specialists in high-quality engineering plastics are consolidating value chain steps to guarantee consistent specification and traceability. MBA Polymers merged with energenta to create an integrated platform that covers collection, advanced sorting, compounding, and material recovery across ABS, PS, PC-ABS, and PP. Suppliers are expanding product lines that incorporate significant PCR content while maintaining performance equal to virgin materials for structural or appearance-critical uses. Certifications such as ISCC PLUS and chain-of-custody documentation support claims for food-contact and automotive use cases.
Large-scale chemical companies are also moving forward with long-term sourcing of advanced recycled feedstocks that support mass-balance portfolios and branded circular products. Partnerships with technology developers are common, as are co-location strategies near steam crackers and integrated parks. This model reduces logistics emissions and aligns output with downstream polymerization and compounding units. Over the forecast horizon, well-capitalized players with secured feedstock and offtake are positioned to gain share in the recycled plastics market.
Recycled Plastics Industry Leaders
Biffa
Republic Services
Veolia
Indorama Ventures
Suez
- *Disclaimer: Major Players sorted in no particular order

Recent Industry Developments
- February 2026: Loop Industries' European joint venture, led by Reed-Société Générale Group, selected BASF Industriepark Lausitz in Schwarzheide, Germany, for Europe's first Infinite Loop manufacturing facility producing 70,000 metric tons per year of virgin-quality recycled PET and polyester fiber using proprietary depolymerization technology, with commissioning expected in 2030 following the Q1 2026 engineering and permitting phase, and Loop receiving an EUR 10 million upfront license payment with incremental engineering and license revenue starting in 2026.
- February 2026: Polyplastics Co., Ltd. developed PLASTRON LFT grades RSG20011 and RSG20013 that contain over 30% post-consumer recycled polypropylene combined with 30-40% glass fiber reinforcement, offering mechanical properties equivalent to virgin products while reducing product carbon footprint by more than 20%, with sample production and evaluation underway and plans to expand the product lineup to incorporate recycled raw materials and cellulose fibers.
- February 2026: PureCycle Technologies and TOPPAN announced a partnership to advance sustainability in flexible films and thermoformed packaging, successfully developing a snack bar wrapper containing more than 30% recycled content using PureCycle's purified polypropylene resin, and targeting thermoforming applications including snack cups, microwaveable containers, and food-contact packaging formats for major brand owners.
- December 2025: Carbios reaffirmed the Longlaville plant construction timeline with commissioning in the first half of 2028, pending a Q1 2026 financing close, noting that pre-commercialization contracts cover nearly 50% of 70,000 tons per year of capacity, and announcing a December 2, 2025 agreement with Wankai New Materials to deploy Carbios' PET biorecycling technology in Asia via a 50,000-ton per year plant in Haining, Zhejiang, planned for commissioning in Q1 2027 with EUR 115 million in investment.


Research Methodology Framework and Report Scope
Market Definitions and Key Coverage
Our study defines the global recycled plastics market as revenue generated when resins recovered from post-consumer and post-industrial plastic waste are sorted, cleaned, and mechanically or chemically reprocessed, then sold as flakes, pellets, or powders to converters serving packaging, construction, automotive, electrical, textile, and consumer-goods value chains. According to Mordor Intelligence analysts, the scope covers PET, PE, PP, PVC, PS, and mixed blends that re-enter material loops after washing, re-pelletizing, depolymerization, or pyrolysis.
Scope exclusion: Bio-based, compostable, and plastic-to-fuel outputs are intentionally left out because their feedstock rules and price signals differ.
Segmentation Overview
- By Polymer Type
- Polyethylene
- High-Density Polyethylene (HDPE)
- Low/Linear-Low Density Polyethylene (LD/LLDPE)
- Polyethylene Terephthalate (PET)
- Polypropylene (PP)
- Polyvinyl Chloride (PVC)
- Polystyrene (PS)
- Other Plastics (ABS, PC, PA, etc.)
- Polyethylene
- By Recycling Process
- Mechanical Recycling
- Chemical / Advanced Recycling (Pyrolysis, Depolymerisation, Dissolution)
- Energy Recovery (Plastic-to-Fuel)
- Others (Biological - enzymatic/ microbial)
- By Product Form
- Flakes
- Pellets/ Granules
- Powder
- Others (Chips, Regrind, Sheets, etc.)
- By End-Use Application
- Packaging
- Food-Grade
- Non-Food Grade
- Building & Construction
- Automotive
- Electrical & Electronics
- Textiles & Apparel
- Consumer Products
- Agriculture & Horticulture
- Other Applications (General Manufacturing, Medical Devices, etc.)
- Packaging
- By Geography
- North America
- United States
- Canada
- Rest of North America
- South America
- Brazil
- Argentina
- Rest of South America
- Europe
- Germany
- United Kingdom
- France
- Italy
- Spain
- BENELUX (Belgium, Netherlands, and Luxembourg)
- NORDICS (Denmark, Finland, Iceland, Norway, and Sweden)
- Rest of Europe
- Middle East and Africa
- Saudi Arabia
- United Arab Emirates
- Turkey
- South Africa
- Nigeria
- Egypt
- Rest of Middle East and Africa
- Asia-Pacific
- China
- India
- Japan
- South Korea
- ASEAN (Indonesia, Thailand, Philippines, Malaysia, Vietnam)
- Rest of Asia-Pacific
- North America
Detailed Research Methodology and Data Validation
Primary Research
Our team interviewed recyclers, resin brokers, packaging converters, and equipment suppliers across Asia-Pacific, Europe, and North America. These discussions clarified real yield losses, typical discounts to virgin resin, and realistic start-up dates for chemical-recycling plants, letting us reconcile assumptions and strengthen projections.
Desk Research
We begin with public statistics from Eurostat, the US EPA, China's MEE, and trade bodies such as PlasticsEurope, the American Chemistry Council, and PETCore that reveal collection volumes and recycling rates. Customs shipment records from Volza, patent families accessed through Questel, company 10-Ks, and news archived in Dow Jones Factiva add price, trade, and capacity context before modeling. Regulations, tender notices, and plant announcements are parsed to flag capacity shifts. The sources mentioned are illustrative; many additional open documents supported data checks and research clarification.
Market-Sizing & Forecasting
The baseline value emerges from one top-down construct that multiplies collected tonnage by recovery yield and region-weighted average selling price; then it is stress-tested through selective bottom-up supplier roll-ups. Key variables include national collection rates, scrap-to-virgin spreads, installed mechanical and chemical capacity, minimum recycled-content mandates, and converter utilization. Forecasts rely on multivariate regression blended with scenario analysis for policy shifts, and gaps, such as informal sector flows, are bridged with proxy ratios confirmed in expert calls.
Data Validation & Update Cycle
Outputs pass anomaly checks against spot PET flake prices, export flows, and independent indices before senior review. We refresh figures each year and issue interim updates whenever policy or supply shocks arise, so clients always receive our latest view.
Why Our Recycled Plastics Baseline Commands Confidence
Published values often differ because firms choose distinct feedstock pools, price bases, and refresh rhythms.
Common gaps include counting plastic-to-fuel revenue, fixing yields too high, or freezing prices to a single quarter, whereas Mordor analysts apply a rolling twelve-month price and exclude energy recovery.
Benchmark comparison
| Market Size | Anonymized source | Primary gap driver |
|---|---|---|
| USD 72.66 B (2025) | Mordor Intelligence | - |
| USD 85.90 B (2025) | Global Consultancy A | Includes plastic-to-fuel output and uniform 80 % yield |
| USD 58.68 B (2025) | Industry Association B | Omits chemical streams and uses 2023 resin prices |
These contrasts show that by pairing transparent scope with continual cross-checks, Mordor Intelligence supplies a balanced, traceable baseline that decision-makers can trust.


Key Questions Answered in the Report
What is the recycled plastics market size and growth outlook to 2031?
The recycled plastics market size is projected to expand from USD 72.66 billion in 2025 and USD 77.93 billion in 2026 to USD 111.10 billion by 2031, at a 7.35% CAGR between 2026 and 2031.
Which region leads demand and growth for recycled plastics?
Asia-Pacific led with 48.7% share in 2025 and is projected to grow at 8.32% CAGR through 2031, supported by EPR expansion and China’s city-level sorting mandates.
Which application segment is the largest, and what is the fastest growing?
Packaging held 38.8% of demand in 2025, while automotive is projected as the fastest growing at 10.22% CAGR through 2031.
How is regulation shaping the recycled plastics market in Europe?
The EU’s PPWR sets minimum recycled-content thresholds starting in 2026 and rising through 2040, which is catalyzing closed-loop investments and offtake contracts.
What technologies are advancing beyond mechanical recycling?
Enzymatic depolymerization and other chemical routes are scaling toward commercial volumes, enabling food-contact and high-spec outputs from harder-to-recycle streams.
Page last updated on:


