Green Buildings Market Size and Share
Market Overview
| Study Period | 2020 - 2031 |
|---|---|
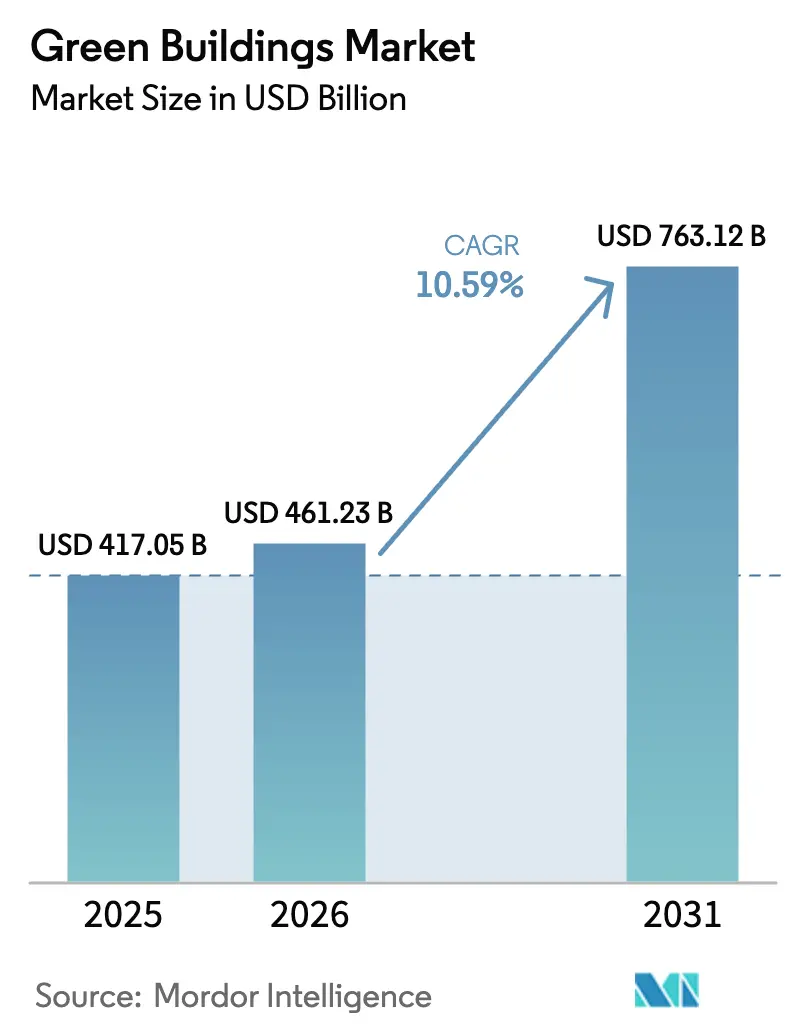
| Market Size (2026) | USD 461.23 Billion |
| Market Size (2031) | USD 763.12 Billion |
| Growth Rate (2026 - 2031) | 10.59% CAGR |
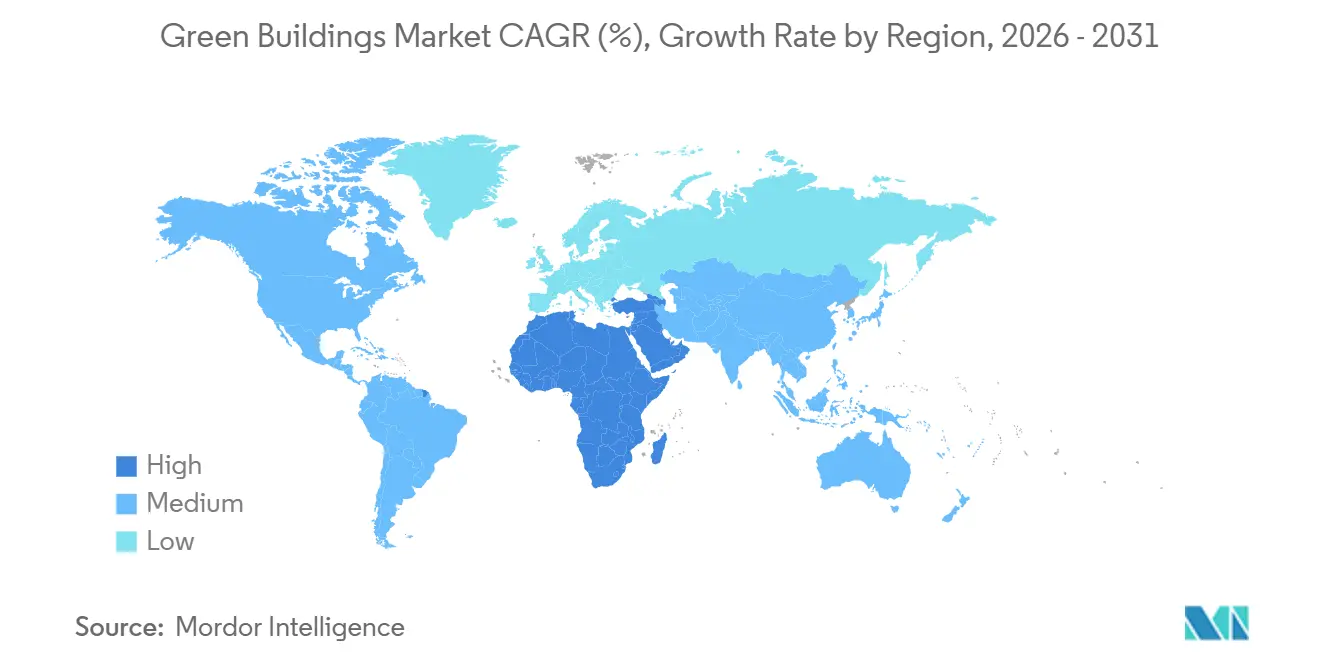
| Fastest Growing Market | Middle East and Africa |
| Largest Market | Asia Pacific |
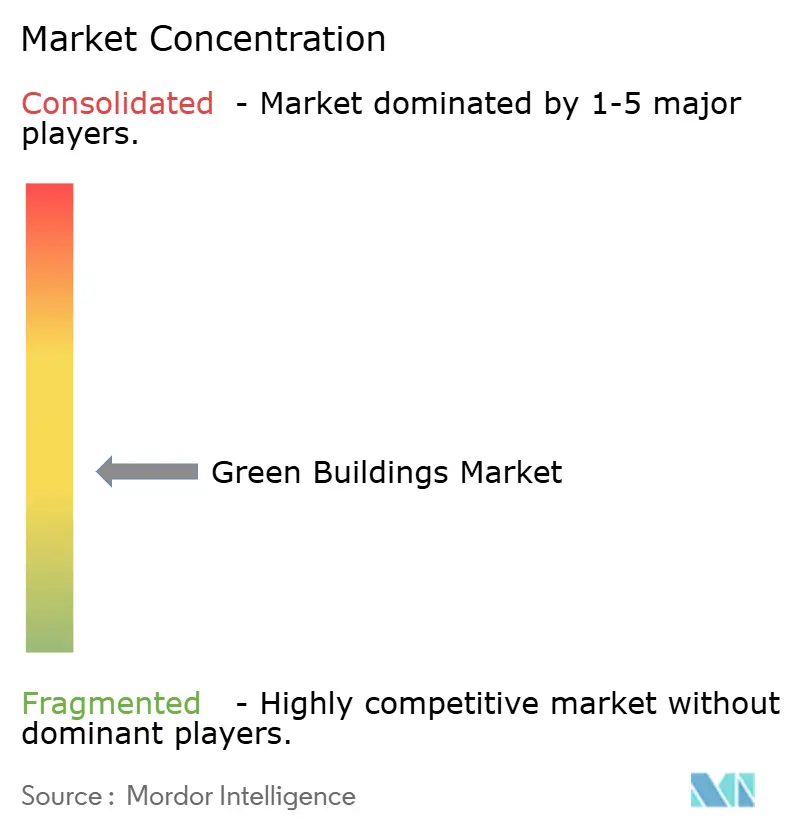
| Market Concentration | Medium |
Major Players *Disclaimer: Major Players sorted in no particular order Image © Mordor Intelligence. Reuse requires attribution under CC BY 4.0. | |
Green Buildings Market Analysis by Mordor Intelligence
The Green Buildings Market size is projected to be USD 417.05 billion in 2025, USD 461.23 billion in 2026, and reach USD 763.12 billion by 2031, growing at a CAGR of 10.59% from 2026 to 2031.
Mandatory carbon-accounting protocols, energy-performance certificates, and sustainability-linked debt instruments have turned efficiency from a nice-to-have into a financing prerequisite, shrinking the payback window on high-performance envelopes and smart building systems. Rent premiums for certified assets, coupled with lower borrowing costs on green bonds, are steering institutional capital toward projects whose operational data confirm energy reductions. At the same time, retrofit mandates in mature economies and large-scale greenfield projects in emerging regions expand the addressable green building market by diversifying demand across construction stages. Material breakthroughs—from low-carbon concrete to bio-based polyurethane foams—reinforce this momentum by giving owners verifiable pathways to embodied-carbon cuts.
Key Report Takeaways
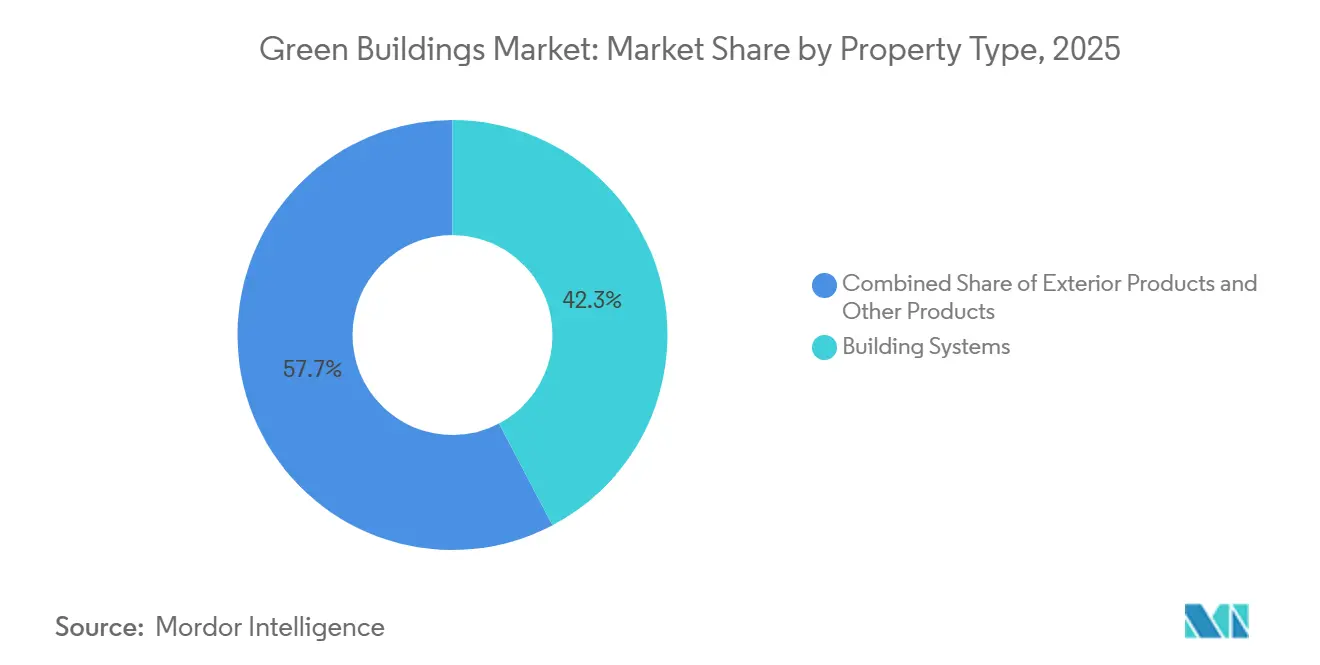
- By product type, building systems held 42.3% of the green building market share in 2025, while exterior products registered the fastest growth at an 11.21% CAGR through 2031.
- By end user, commercial projects dominated with 53.7% revenue in 2025; logistics facilities are projected to expand at an 11.76% CAGR through 2031.
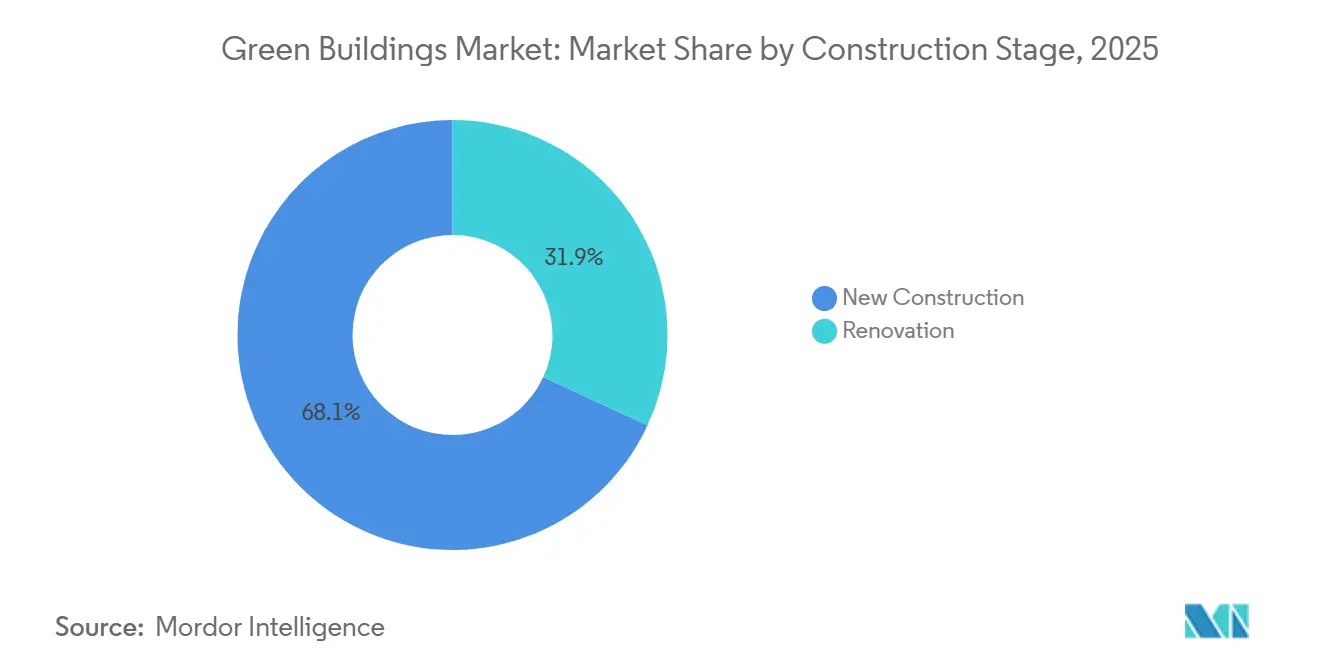
- By construction stage, new builds represented 68.1% of 2025 activity, yet renovation is advancing at an 11.55% CAGR, the fastest among all stages.
- By geography, Asia-Pacific commanded 37.6% of the 2025 value, while the Middle East & Africa region is set to post a 12.23% CAGR through 2031.
Note: Market size and forecast figures in this report are generated using Mordor Intelligence’s proprietary estimation framework, updated with the latest available data and insights as of January 2026.
Global Green Buildings Market Trends and Insights
Drivers Impact Analysis*
| Drivers | (~) % IMPACT ON CAGR FORECAST | Geographic Relevance | Impact Timeline |
|---|---|---|---|
| Stringent green-construction regulations & certification mandates | +2.8% | EU, California, tier-one APAC cities | Medium term (2–4 years) |
| Rising energy prices are boosting demand for high-performance envelopes | +2.1% | Europe, North America, and energy-import-dependent APAC | Short term (≤2 years) |
| Corporate ESG targets opening green-bond & sustainability-linked financing | +2.5% | North America, Europe, APAC financial hubs | Medium term (2–4 years) |
| Rapid urbanization programs with green-building codes in APAC | +1.9% | China, India, Southeast Asia | Long term (≥4 years) |
| Mandatory embodied-carbon disclosure in public procurement | +1.2% | EU, UK, select North America, pilot APAC | Long term (≥4 years) |
| Source: Mordor Intelligence | |||
Stringent Green-Construction Regulations & Certification Mandates
Zero-emission building rules now dictate project underwriting. The EU directive, revised in 2024, compels all new structures delivered after 2030 to achieve zero-operational carbon and forces existing non-residential assets to meet minimum ratings by 2027[1]European Commission, “Energy Performance of Buildings Directive – Revision,” europa.eu . California’s Title 24 adds solar-ready roofs and battery-storage wiring to baseline design, eliminating the ability to defer renewable integration. Certification bodies such as LEED and BREEAM have become gatekeepers to green finance because lenders demand proof of performance before closing. These policies front-load compliance expenses but simultaneously unlock cheaper debt, accelerating uptake across the green building market. Developers unable to meet benchmarks face stranded-asset risk, ensuring regulations continue to steer demand.
Rising Energy Prices Boosting Demand for High-Performance Envelopes
Persistent fuel-price volatility since 2023 has moved energy efficiency to the top of tenant wish lists. Commercial occupiers are now willing to pay higher rents for buildings with triple glazing, thermally broken façades, and reflective roofs that cut HVAC loads by up to 40%[2]International Energy Agency, “Energy Efficiency 2025,” iea.org . Warm-climate data centers and logistics hubs join cold-weather offices in specifying airtight envelopes because cooling costs often eclipse heating bills. With payback periods narrowing to seven years or less, owners can justify premium claddings and window packages even in secondary markets. High-performing envelopes, therefore, anchor growth in retrofit spending across the wider green building market.
Corporate ESG Targets Opening Green-Bond & Sustainability-Linked Financing
Debt markets now price carbon. Real-estate green-bond issuance topped USD 150 billion in 2024, while sustainability-linked loans rose 40% in 2025 as interest rates adjusted to verified energy gains. Smaller developers gain funding access by pledging superior performance, broadening participation in the green building market. Insurers reinforce the trend by lowering premiums for assets with energy intensities below 100 kWh/m². The feedback loop of cheaper capital for better buildings underpins sustained demand for high-efficiency systems.
Rapid Urbanization Programs with Green-Building Codes in APAC
Asia-Pacific adds close to 1 billion m² of urban floor area each year, virtually all under mandatory green-building codes. India’s Smart Cities Mission grants floor-area bonuses for IGBC-rated projects, incentivizing private builders to exceed minimums. Vietnam and Indonesia mirror this approach in special economic zones to meet multinational tenant standards. Because green metrics are baked into master plans, compliance costs stay low, powering steady volume for system integrators across the region’s green building market.
Restraints Impact Analysis*
| Restraints | (~) % IMPACT ON CAGR FORECAST | Geographic Relevance | Impact Timeline |
|---|---|---|---|
| High upfront capital & certification costs | -1.4% | Global, strongest in cost-sensitive residential markets | Short term (≤2 years) |
| Fragmented supply chains for low-carbon materials | -0.9% | Emerging APAC, MEA, South America | Medium term (2–4 years) |
| Skilled-labor shortage in advanced sustainable methods | -1.1% | North America, Europe, advanced APAC | Medium term (2–4 years) |
| Source: Mordor Intelligence | |||
High Upfront Capital & Certification Costs
LEED Gold still adds 8-12% to construction budgets, with consultant fees for modeling and verification topping USD 50,000 on mid-size projects. Affordable-housing developers struggle to monetize that premium, slowing adoption in lower-income segments of the green building market. Some utilities co-finance efficiency upgrades, but programs remain patchy, leaving a financing gap that constrains near-term growth.
Fragmented Supply Chains for Low-Carbon Materials
Cross-laminated timber mills and low-carbon cement plants are clustered in Europe and North America. APAC and Middle Eastern builders must import, paying freight premiums that erode project returns. Delays of six months or more jeopardize schedules tied to regulatory deadlines. Regional manufacturing ventures and harmonized material standards will ease the bottleneck, yet progress is incremental.
*Our forecasts treat driver/restraint impacts as directional, not additive. The impact forecasts reflect baseline growth, mix effects, and variable interactions.
Segment Analysis
By Product Type: Building Systems Dominate Through Verified Savings
Building systems accounted for 42.3% of 2025 revenue, making them the largest slice of the green building market. HVAC retrofits, variable-refrigerant-flow heat pumps, and advanced chillers anchor this category by reducing fossil-fuel dependence and complying with new refrigerant rules. Smart building-management platforms integrate HVAC, lighting, and access controls into a unified dashboard that owners use to prove efficiency gains to lenders. With envelope upgrades nearing physical limits, performance data from systems provides the clearest ROI pathway to sustain double-digit growth.
Exterior products-insulated panels, high-performance glazing, reflective roofs-remain essential but grow more modestly as code-driven adoption saturates. Interior items such as low-VOC paint and recycled flooring ride the wellness-certification tailwind, especially in premium offices. Emerging lines-phase-change drywall, electrochromic glass offer upside but await cost reductions. Crucially, suppliers that ensure plug-and-play interoperability with IoT hubs can price at a premium, while legacy stand-alone products risk commoditization. As a result, exterior products are forecast to outpace other categories at an 11.21% CAGR through 2031, narrowing the gap with building systems in the green building market.


By End User: Commercial Properties Lead Under Tenant Pressure
Commercial assets generated 53.7% of global outlays in 2025, reflecting tenant demand for verifiable efficiency and associated carbon reporting. Office landlords face a flight-to-quality as occupiers chase lower Scope 3 emissions. Retailers retrofit stores to trim utility costs amidst margin pressure, while logistics operators invest in temperature-controlled warehousing with rooftop solar to meet cold-chain standards. Institutional owners—universities, hospitals—tap green bonds with 20-year tenors aligned to energy-savings paybacks.
Residential uptake is bifurcated. The luxury condos market positions sustainability as a lifestyle badge, but mass-market adoption lags despite policy incentives. City-core multifamily projects must now hit minimum energy scores across Europe and several APAC metros, pushing heat-pump water heaters and gray-water systems into mainstream design. Logistics facilities, the fastest-growing commercial subsegment, are projected to expand at an 11.76% CAGR through 2031 as e-commerce drives warehouse construction linked to net-zero deadlines. Commercial dominance will thus persist, helped by longer hold periods that align with system paybacks in the green building market.
By Construction Stage: Renovation Accelerates as Deadlines Loom
New construction held 68.1% of 2025 spending owing to emerging-market megaprojects and easier integration of green specs from day one. Yet renovation is the fast mover, set to post an 11.55% CAGR because regulators now require deep retrofits of the poorest-performing stock. EU rules compel upgrades for the worst 15% of buildings by 2027, prompting a surge in insulation, window replacements, and smart controls across mature economies.
Land-constrained cities prefer adaptive-reuse projects that cut embodied carbon by conserving structural shells. Specialized contractors offering turnkey retrofit packages-insulation, airtightness, heat-pump swaps-report backlog growth of over 25% year-over-year. Kingspan’s retrofit-insulation sales in Europe rose 28% in 2025, underscoring this pivot. Although greenfield projects in Asia and the Middle East still dominate volumes, renovation’s share of the green building market will keep rising as existing stock ages, and demolition incurs regulatory penalties.
Geography Analysis
Asia-Pacific accounted for 37.6% of the 2025 green building market revenue, underpinned by China’s dual-carbon policy and India’s quick uptake of green bonds funding urban infrastructure. China surpassed 10 billion m² of certified floor area in 2024, and India’s IGBC listings grew 25% in 2025. Japan and South Korea retrofit 1990-era offices to stringent new codes, while Australia’s state subsidies accelerate rooftop solar-plus-storage in suburban housing. These dynamics ensure Asia-Pacific remains the volume leader, although growth moderates as regulations mature.
The Middle East & Africa region is the fastest climber, expected to record a 12.23% CAGR through 2031 on the back of Saudi Arabia’s USD 500 billion Vision 2030 projects and the UAE’s net-zero-city mandates[3]Public Investment Fund (Saudi Arabia), “Vision 2030 Investment Report,” pif.gov.sa . NEOM’s giga-scale procurement embeds renewable power, district cooling, and recycled-water systems from the outset, creating mega-orders for envelope and system suppliers. The UAE requires 75% of buildings to hold green certification by 2030, spawning a retrofit wave across existing stock. South Africa invests in on-site solar and batteries to escape grid instability, and Lagos pilots codes for public housing, hinting at broader continental adoption.
North America and Europe, though mature, remain pivotal. The United States issued USD 45 billion in real-estate green bonds in 2024, funding LEED upgrades in major metros. Canada mandates net-zero federal buildings by 2030, anchoring provincial policy. European renovation accelerates under the Fit-for-55 package, with Germany and France channeling subsidies toward deep-energy retrofits. The UK ties energy-efficiency metrics to building-safety rules, driving façade recladding and new HVAC. Latin America grows selectively; Brazil leads with LEED stock in São Paulo, while Mexico adopts green standards to satisfy U.S. nearshoring tenants. Collectively, these regions keep renovation volumes strong, sustaining the global green building market.
Mordor Intelligence provides coverage of the green buildings market across other key regional markets, including Asia, Europe, Middle East, and North America, each with their regulatory frameworks and demand patterns.

Competitive Landscape
Global insulation and façade giants—Kingspan, Saint-Gobain, Owens Corning—leverage scale and R&D to bundle high-performance materials with digital monitoring, cementing sticky client relationships. Schneider Electric’s EcoStruxure and Johnson Controls’ OpenBlue ecosystems merge hardware with analytics subscriptions that convert one-time sales into service annuities. Competition revolves around proof of energy savings, not just product specs, compelling laggards to partner or risk exclusion from large tenders.
Materials innovation deepens rivalry. Holcim’s low-carbon cement and Interface’s carbon-negative carpet tiles differentiate on embodied carbon, a metric that public procurement now tracks. Start-ups like Sublime Systems chase electrochemical cement technologies that eliminate process emissions, potentially leapfrogging incumbents. Suppliers able to certify cradle-to-gate impacts rapidly win share in projects subject to disclosure rules, underscoring the growing data intensity of the green building market.
Industrialized construction adds another front. Binderholz and RedBuilt expand cross-laminated timber and panelized wall factories to offset skilled-labor shortages and cut site waste. Yet designers worry about aesthetic uniformity, so hybrid solutions—mass-timber cores with bespoke façades—gain favor. Strategic alliances proliferate: Johnson Controls partnered with Microsoft Azure for predictive analytics, and Schneider Electric bought a U.S. software firm for energy-as-a-service offerings. These moves illustrate convergence between construction products and cloud platforms, reshaping competitive dynamics.
Green Buildings Industry Leaders
Kingspan Group PLC
Saint-Gobain SA
BASF SE
Johnson Controls International plc
Owens Corning
- *Disclaimer: Major Players sorted in no particular order

Recent Industry Developments
- January 2025: Kingspan invested USD 217 million to expand vacuum-insulation and phenolic-foam lines in Poland and the Czech Republic, targeting EU retrofit demand.
- December 2024: Saint-Gobain acquired 60% of a Chinese low-carbon glass producer for USD 180 million to strengthen its APAC BIPV portfolio.
- November 2024: BASF launched bio-based polyurethane insulation foams, cutting embodied carbon by 30% for the EU and U.S. markets.
- October 2024: Johnson Controls integrated Microsoft Azure IoT into OpenBlue, targeting 20-30% energy cuts in commercial buildings.
- September 2024: Owens Corning committed USD 150 million for a mineral-wool plant in Texas to meet U.S. commercial demand.


Global Green Buildings Market Report Scope
The green building market is for buildings designed, built, and operated sustainably. This includes buildings with energy efficiency, renewable energy, water efficiency, waste reduction, and indoor environmental quality.
The green buildings market is segmented by product (exterior products, interior products, and other products ( building systems, solar systems, etc.)), by end user (residential, office, retail, institutional, and other end users), by geography (North America, Europe, Asia-pacific, Latin America, and Middle East and Africa). The report offers market size and forecasts for the green buildings market in value (USD) for all the above segments.
| Exterior Products |
| Interior Products |
| Building Systems |
| Others |
| Residential | Apartments & Condominiums |
| Villas & Landed Houses | |
| Commercial | Office |
| Retail | |
| Logistics | |
| Institutional | |
| Others (industrial real estate, hospitality real estate, etc.) |
| New Construction |
| Renovation |
| North America | United States |
| Canada | |
| Mexico | |
| South America | Brazil |
| Argentina | |
| Chile | |
| Rest of South America | |
| Europe | United Kingdom |
| Germany | |
| France | |
| Italy | |
| Spain | |
| Netherlands | |
| Rest of Europe | |
| Middle East and Africa | Saudi Arabia |
| United Arab Emirates | |
| South Africa | |
| Nigeria | |
| Rest of Middle East and Africa | |
| Asia-Pacific | China |
| India | |
| Japan | |
| South Korea | |
| Australia | |
| Indonesia | |
| Rest of Asia-Pacific |
| By Product Type | Exterior Products | |
| Interior Products | ||
| Building Systems | ||
| Others | ||
| By End User | Residential | Apartments & Condominiums |
| Villas & Landed Houses | ||
| Commercial | Office | |
| Retail | ||
| Logistics | ||
| Institutional | ||
| Others (industrial real estate, hospitality real estate, etc.) | ||
| By Construction Stage | New Construction | |
| Renovation | ||
| By Geography | North America | United States |
| Canada | ||
| Mexico | ||
| South America | Brazil | |
| Argentina | ||
| Chile | ||
| Rest of South America | ||
| Europe | United Kingdom | |
| Germany | ||
| France | ||
| Italy | ||
| Spain | ||
| Netherlands | ||
| Rest of Europe | ||
| Middle East and Africa | Saudi Arabia | |
| United Arab Emirates | ||
| South Africa | ||
| Nigeria | ||
| Rest of Middle East and Africa | ||
| Asia-Pacific | China | |
| India | ||
| Japan | ||
| South Korea | ||
| Australia | ||
| Indonesia | ||
| Rest of Asia-Pacific | ||


Key Questions Answered in the Report
How large is the green buildings market in 2026?
The green buildings market size is valued at USD 461.23 billion in 2026.
What CAGR is expected for green buildings through 2031?
The green buildings market is projected to grow at a 10.59% CAGR, reaching USD 763.12 billion by 2031.
Which product category contributes the most revenue?
Building systems—including HVAC, smart controls, and lighting—lead with 42.3% of 2025 spending.
Which region is expanding the fastest?
The Middle East & Africa region is forecast to post a 12.23% CAGR through 2031, led by Saudi Arabia and the UAE.
Why are retrofits gaining momentum?
Regulatory deadlines in the EU and major U.S. cities require energy upgrades of existing buildings, driving an 11.55% CAGR in renovation spending.
What hampers the faster adoption of sustainable builds?
Upfront cost premiums, fragmented low-carbon material supply chains, and skilled-labor shortages slow broader market uptake.
Page last updated on:


