Surgical Tables Market Size and Share
Market Overview
| Study Period | 2020 - 2031 |
|---|---|
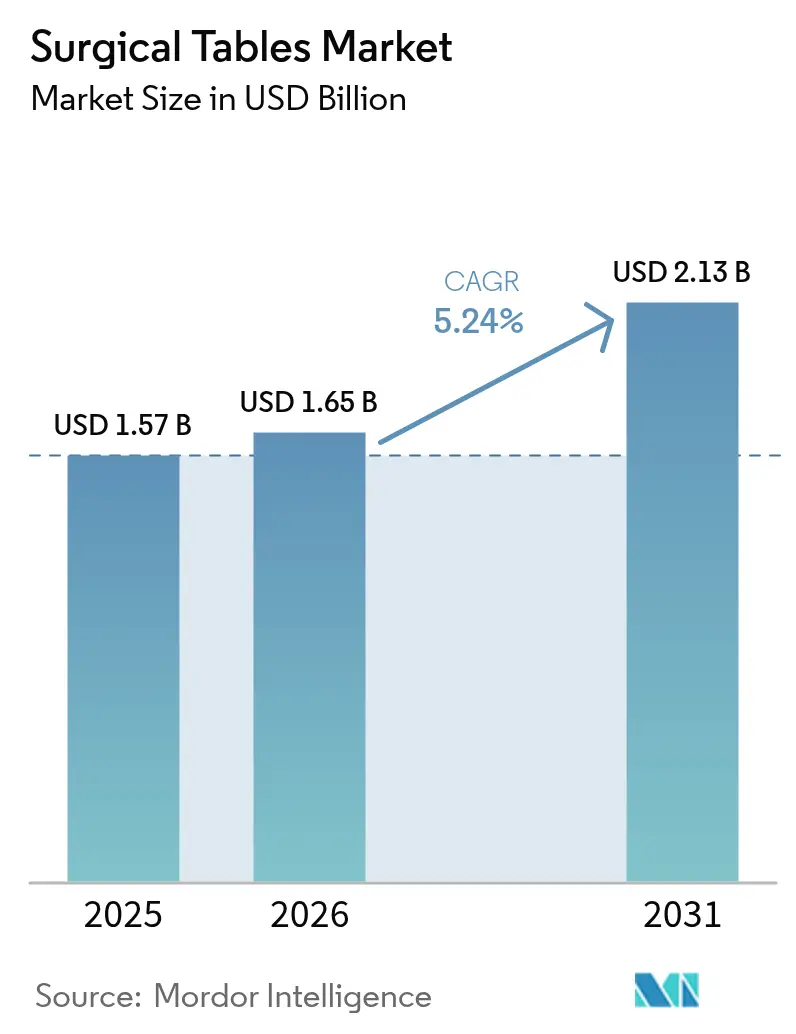
| Market Size (2026) | USD 1.65 Billion |
| Market Size (2031) | USD 2.13 Billion |
| Growth Rate (2026 - 2031) | 5.24% CAGR |
| Fastest Growing Market | Asia Pacific |
| Largest Market | North America |
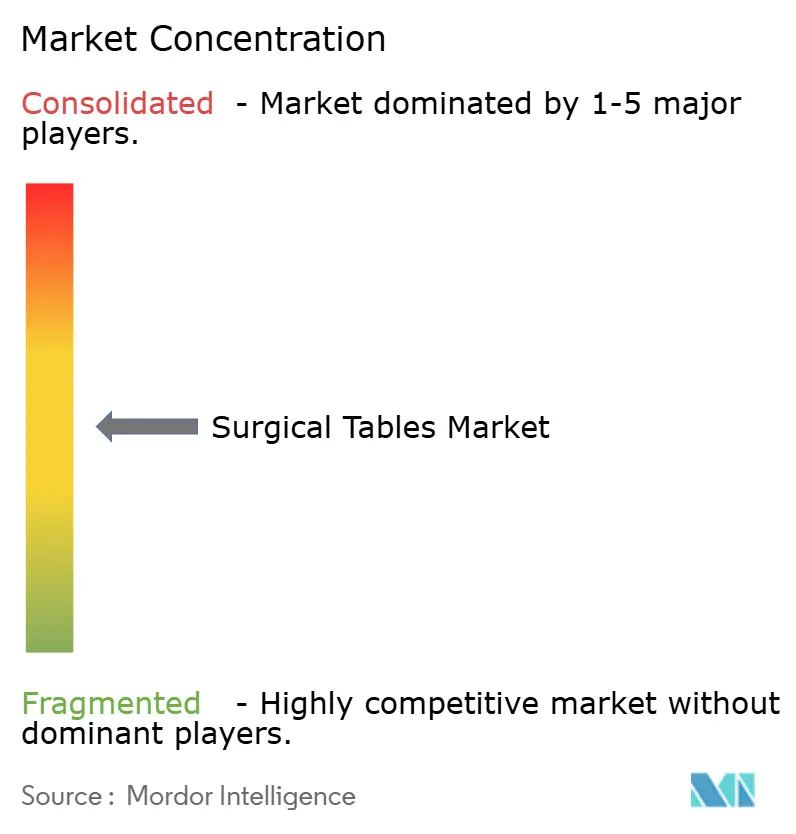
| Market Concentration | Medium |
Major Players *Disclaimer: Major Players sorted in no particular order Image © Mordor Intelligence. Reuse requires attribution under CC BY 4.0. | |
Surgical Tables Market Analysis by Mordor Intelligence
The Surgical Tables Market size was valued at USD 1.57 billion in 2025 and estimated to grow from USD 1.65 billion in 2026 to reach USD 2.13 billion by 2031, at a CAGR of 5.24% during the forecast period (2026-2031). Demographic aging is lifting orthopedic and cardiovascular caseloads, outpatient care is shifting more procedures into ambulatory surgical centers (ASCs), and robotics‐ready operating rooms (ORs) are raising the technical bar for patient-positioning platforms. Hospitals are upgrading to carbon-fiber radiolucent tops to support real-time imaging, while sustainability mandates in Europe and North America reward energy-efficient modular designs. Competitive strategies increasingly revolve around bundled OR ecosystems that tie surgical tables to imaging, lighting, and robotic offerings, helping providers simplify procurement and integration. Premium-segment manufacturers are also launching service and financing programs that mitigate capital-budget constraints for mid-tier hospitals.
Key Report Takeaways
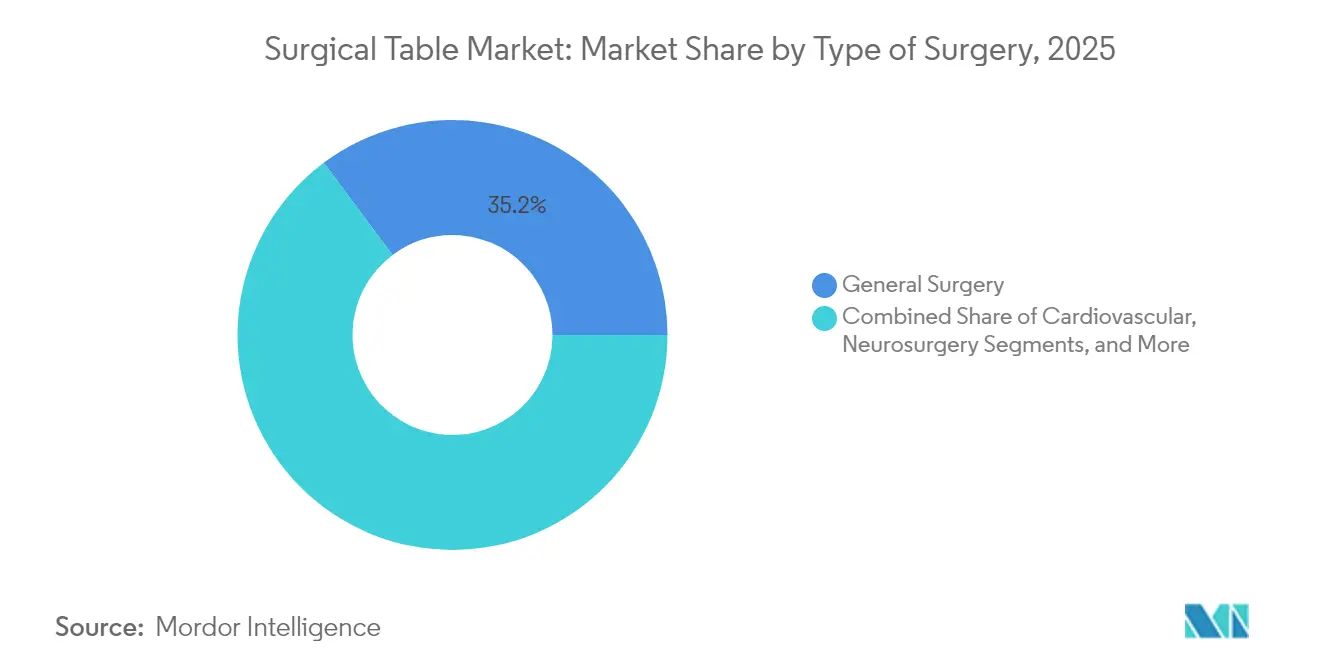
- By type of surgery, general surgery held 35.22% of the surgical tables market share in 2025, whereas orthopedic & trauma procedures are projected to grow at a 6.49% CAGR to 2031.
- By material, metal platforms commanded 52.05% of the surgical tables market size in 2025; carbon-fiber composite tables are forecast to expand at a 5.72% CAGR through 2031.
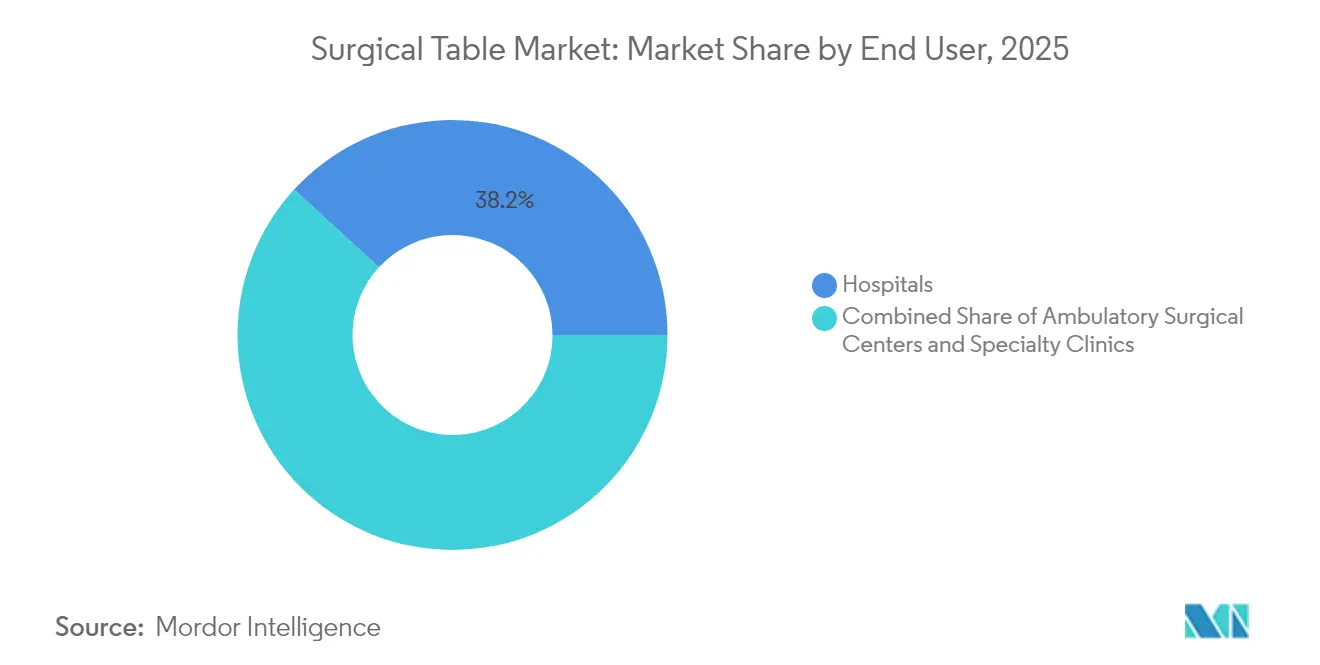
- By end user, hospitals accounted for 38.18% of the surgical tables market share in 2025, while ASCs are advancing at a 6.03% CAGR to 2031.
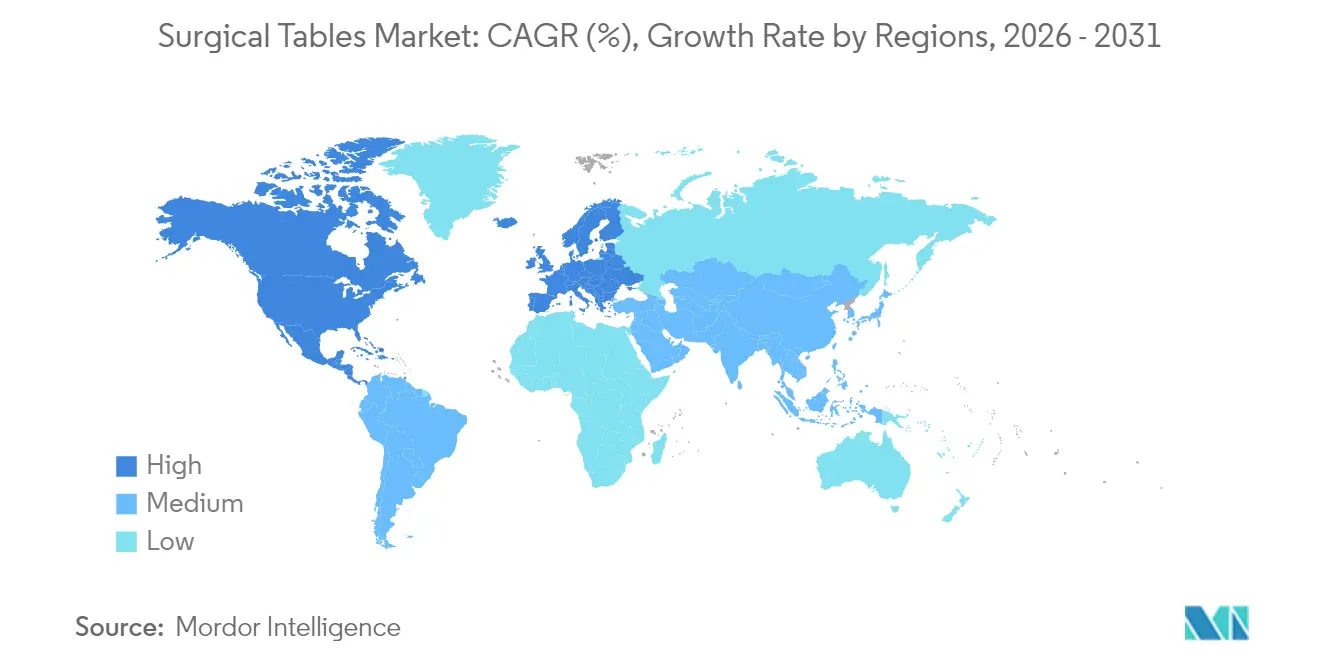
- By geography, North America led with a 38.30% revenue share in 2025; Asia-Pacific is the fastest-growing region with a 6.56% CAGR to 2031.
Note: Market size and forecast figures in this report are generated using Mordor Intelligence’s proprietary estimation framework, updated with the latest available data and insights as of 2026.
Global Surgical Tables Market Trends and Insights
Driver Impact Analysis*
| Driver | (~) % Impact on CAGR Forecast | Geographic Relevance | Impact Timeline |
|---|---|---|---|
| Rising surgical procedure volumes & ASC expansion | +1.2% | Global, with strongest impact in North America & Europe | Medium term (2-4 years) |
| Aging population driving higher orthopedic & cardiac caseload | +1.0% | Global, particularly North America, Europe, and developed APAC markets | Long term (≥ 4 years) |
| Integrated-OR & robot-ready table upgrades | +0.8% | North America & EU, expanding to APAC core markets | Medium term (2-4 years) |
| Carbon-fiber radiolucent tops enabling intra-op imaging | +0.6% | Global, with early adoption in North America and Europe | Short term (≤ 2 years) |
| Surge in minimally invasive & robotic surgeries requiring advanced patient-positioning functionality | +0.7% | North America & Europe, with rapid expansion to APAC | Medium term (2-4 years) |
| Hospital sustainability mandates favoring energy-efficient, modular table platforms | +0.4% | Europe & North America, with emerging adoption in APAC | Long term (≥ 4 years) |
| Source: Mordor Intelligence | |||
Rising surgical procedure volumes & ASC expansion
Outpatient sites perform the bulk of U.S. procedures and continue to attract complex orthopedic and gastroenterology cases because they operate at 45-60% lower costs than hospital outpatient departments and cut average wait times by 20% [1]Health Industry Distributors Association, “Ambulatory Surgery Center Market Report,” Health Industry Distributors Association, hida.org. ASC growth is encouraging vendors to deliver compact, multi-specialty tables that fit smaller footprints and rotate quickly between cases. To keep capital outlays down, manufacturers now market modular bases that accept specialty tops, letting centers defer upgrades until volumes justify them. Group-purchasing contracts and equipment-as-a-service financing further lower barriers to adoption.
Aging population driving higher orthopedic & cardiac caseload
Population aging elevates demand for joint reconstruction, fracture repair, and interventional cardiology procedures that require precise positioning and bariatric weight limits. U.S. orthopedic volumes are projected to reach 6.6 million procedures annually, reinforcing the need for heavy-load lifts and pressure-injury mitigation sensors. Bariatric-capable tables with integrated pressure mapping, such as XSENSOR’s ForeSite OR, reduce hospital-acquired pressure injuries that affect up to 45% of surgical patients.
Integrated-OR & robot-ready table upgrades
Hospitals moving toward single-vendor ecosystems increasingly bundle angiography systems, C-arms, and robotics with compatible surgical tables. Intuitive Surgical’s da Vinci 5 platform, featuring Force Feedback that can cut tissue force by 43%, demands ultra-stable, data-connected tables to avoid motion artifacts during robotic manipulation [2]David Robinson, “Haptic Feedback in Intuitive’s da Vinci 5,” Intuitive Surgical, intuitive.com. Siemens Healthineers’ Artis OR Table couples a radiolucent floating top with angiography gantries, illustrating how integrated solutions improve workflow and simplify service contracts.
Carbon-fiber radiolucent tops enabling intra-op imaging
Carbon fiber supports low-attenuation imaging across spinal, trauma, and endovascular procedures. Composite sandwich designs using LAST-A-FOAM FR-3700 cores trim weight while lowering raw-material costs and machining time. A 2025 pelvic-fracture study showed that an auxiliary carbon-compatible table priced at USD 700 matched the imaging quality of a USD 50,000 dedicated carbon table, highlighting disruptive potential in cost-sensitive markets [3]Yong-Cheol Yoon, “Innovating Pelvic Fracture Surgery: Development and Evaluation of a New Surgical Table for Enhanced C-Arm Imaging and Operational Efficiency,” Journal of Clinical Medicine, mdpi.com.
Surge in minimally invasive & robotic surgeries requiring advanced patient-positioning functionality
Robotics extends minimally invasive techniques to complex procedures, pushing tables to offer extreme Trendelenburg angles, 360° rotation, and quick-lock accessories. Studies on da Vinci 5 Force Feedback show improved novice-surgeon performance, fueling broader deployment and table upgrades inside teaching hospitals.
Hospital sustainability mandates favoring energy-efficient, modular table platforms
European and North American health systems now reference ASHRAE 189.3 and ISO 50001 in procurement to achieve net-zero targets. Vendors respond with lower standby power draws, recyclable components, and refurbishable modules that comply with FDA remanufacturing guidance issued in May 2024. Lifecycle assessments demonstrating double-digit energy savings increasingly influence tender scores, especially in public-sector hospitals.
Restraint Impact Analysis*
| Restraint | (~) % Impact on CAGR Forecast | Geographic Relevance |
|---|---|---|
| Premium pricing & capex freezes in mid-tier hospitals | -0.8% | Global, with strongest impact in emerging markets and rural healthcare systems |
| Shortage of skilled OR technologists for advanced tables | -0.5% | Global, particularly acute in North America and Europe |
| Carbon-fiber supply chain volatility | -0.4% | Global, with particular impact on premium segment manufacturers |
| Stricter reprocessing and regulatory compliance raising lifetime ownership costs for providers | -0.3% | Global, with strongest impact in highly regulated markets like North America and Europe |
| Source: Mordor Intelligence | ||
Premium pricing & capex freezes in mid-tier hospitals
Rising operating costs and inflation have caused smaller hospitals to delay capital purchases, selectively opting for refurbished equipment or multi-year leasing. Medicare reimbursement has slipped for total joint arthroplasty even as volumes climb, compressing margins and making high-end imaging-compatible tables harder to justify [4]Editorial Staff, “Medicare Reimbursement Trends in Total Joint Arthroplasty,” Journal of Orthopaedic Experience & Innovation, journals.sagepub.com. Vendors are countering with staged upgrade paths that let facilities install a base and add connectivity kits later, plus service contracts that bundle maintenance, remanufacturing compliance, and software updates.
Shortage of skilled OR technologists for advanced tables
Perioperative staffing gaps slow the roll-out of high-spec tables that need specialized calibration and troubleshooting. Annals of Surgery projects a shortage of more than 100,000 surgeons by 2030, implying parallel deficits in technologists trained to manage complex patient-positioning protocols. Training roadshows such as Medtronic’s mobile labs attempt to bridge the gap by bringing simulation trucks to 38 states annually, yet turnover still drives upskilling costs for providers.
Carbon-fiber supply chain volatility
High-grade fiber and epoxy pricing swings complicate procurement for premium tables. Manufacturers hedge through multi-sourcing and by engineering hybrid composite-metal decks that decrease fiber content without sacrificing imaging quality. Supply disruption encourages providers to diversify vendors, raising qualification costs and delaying projects in trauma centers that rely on radiolucent capability for intraoperative scans.
Stricter reprocessing and regulatory compliance raising lifetime ownership costs
The FDA’s 2024 final guidance on remanufacturing requires any significant refurbishment to meet new-device quality standards, increasing documentation burdens and, in turn, service contract fees. Facilities must also validate cleaning cycles to protect delicate sensors embedded in next-generation tops, adding recurring operational spend that can erode return-on-investment models.
*Our forecasts treat driver/restraint impacts as directional, not additive. The impact forecasts reflect baseline growth, mix effects, and variable interactions.
Segment Analysis
By Type of Surgery: General surgery maintains dominance while orthopedic momentum builds
General surgery held 35.22% of the surgical tables market share in 2025. Hospitals favor versatile, quick-switch platforms that serve appendectomies in the morning and bariatric cases in the afternoon. The segment’s broad procedural mix supports economies of scale for replacement purchases, and its workflows align with standardized accessories such as removable armboards and lithotomy leg supports. Meanwhile, robotic cholecystectomy adoption is nudging many providers to replace manual hydraulic bases with motorized column systems featuring footswitch memory profiles for speed and consistency.
Orthopedic & trauma procedures are set to log a 6.49% CAGR to 2031, the fastest in the market. Knee and hip robotics like Zimmer Biomet’s TMINI Miniature Robotic System depend on rigid, low-vibration surfaces that maintain sub-millimeter accuracy during milling. Table manufacturers respond with longitudinal slide and tilt ranges that expose distal femurs without repositioning, shortening anesthesia times and radiographic exposure. Neurosurgery and cardiovascular specialties occupy smaller shares but command premium pricing because they demand carbon tops, 360° C-arm clearance, and head fixation interfaces that integrate with navigation systems. As hospitals pursue cross-disciplinary hybrid rooms, demand is shifting toward universal platforms that support spinal, vascular, and cranial workflows on the same chassis, reducing inventory and service overhead.


By Material: Metal reliability faces composite innovation
Metal frames made up 52.05% of surgical tables market size in 2025, prized for durability, easy part availability, and lower acquisition prices. Stainless steel bases withstand repeated disinfectant exposure and accept heavier patients, meeting safety regulations without special training. However, clinicians increasingly request radiolucency to avoid imaging artifacts; here, carbon-fiber composite decks excel. Composite tables are forecast to grow at a 5.72% CAGR, benefiting from foam-core sandwich architecture that cuts weight by 25% and passes CT photons with minimal attenuation. Manufacturers like ACP Composites incorporate FR-3700 polyurethane cores to balance cost and stiffness. Hybrid designs merge aluminum bases with bolt-on carbon tops, giving budget-constrained facilities an incremental path to imaging capability and reducing dependence on volatile fiber supply chains.
By End User: Hospital volume leadership meets ASC dynamism
Hospitals generated 38.18% of 2025 revenue, reflecting their role in high-acuity, multi-disciplinary care that requires full-featured, robot-ready tables. They also drive demand for integrated fleet management software that tracks utilization, service schedules, and sensor diagnostics across dozens of rooms. ASCs, however, are expanding at a 6.03% CAGR. Their growth is propelled by payer site-neutral policies and consumer preference for same-day surgery. To win this segment, manufacturers package compact bases with specialty tops—orthopedic traction, cystoscopy, or spine imaging—delivered as factory-calibrated kits. Specialty clinics, although smaller, often pioneer novel technologies; early adoption of AI-based pressure-mapping pads illustrates how niche settings influence broader procurement once evidence of value emerges.
Geography Analysis
North America captured 38.30% of 2025 revenue, supported by high procedure volumes and early uptake of advanced robotics. The U.S. ASC market alone could reach nearly USD 59 billion in revenue by 2028, spurring orders for cost-optimized, quick-turnover tables. Medicare’s push for site-neutral reimbursement further accelerates equipment migration from hospitals to ASCs, while regional service networks from Getinge and STERIS reduce downtime and reinforce brand stickiness.
Europe forms a mature, replacement-driven market where sustainability and regulatory rigor shape purchasing. ASHRAE 189.3 guidelines influence tender scores, nudging buyers toward energy-efficient motor drives and recyclable packaging. Getinge’s Surgical Workflows segment posted 15.6% revenue growth in Q4 2023, helped by hospitals refreshing legacy fleets with integrated OR suites. Capital grants tied to green public-procurement criteria are likely to sustain steady demand despite flat procedural growth.
Asia-Pacific is the fastest-growing region, projected at a 6.56% CAGR. Healthcare infrastructure investment and widening medical-tourism flows drive adoption of hybrid rooms in China, India, and ASEAN states. Medtronic’s Robotics Experience Studio in Singapore illustrates how training hubs accelerate diffusion of advanced OR technologies throughout the region. Venture funding dipped 22% over the past two years, yet domestic manufacturing initiatives in Vietnam and Korea help offset import tariffs and supply bottlenecks, supporting localized table production.

Competitive Landscape
Competition is moderate, with technological breadth and lifecycle service capabilities acting as key differentiators. Getinge, Stryker, and STERIS combine tables, lights, and infection-control equipment into bundled proposals, streamlining hospital procurement and reinforcing installed-base loyalty. Stryker recorded 10.7% organic sales growth in Q4 2024, crediting strong demand for capital products, including surgical tables, across its MedSurg segment.
Strategic acquisitions are reshaping the field. KARL STORZ’s planned purchase of Asensus Surgical extends its OR portfolio into digital laparoscopy, potentially unlocking cross-selling synergies with high-spec tables configured for 3D vision towers. Carbon-fiber innovators seek partnerships with composite material suppliers to secure feedstock and protect margins against volatility. Service innovation also figures prominently: vendors embed predictive analytics sensors to pre-empt downtime, positioning premium service contracts as a hedge against the FDA’s remanufacturing compliance costs.
White-space opportunities persist in emerging markets, where cost-effective universal bases address multispecialty demand without the overhead of high-end robotics. Smaller manufacturers targeting these geographies often collaborate with regional distributors to localize service and training, but they must still demonstrate regulatory compliance and imaging compatibility to gain traction among fast-modernizing hospitals.
Surgical Tables Industry Leaders
Steris Plc
Skytron LLC
Stryker Corporation
Mizuho OSI
Getinge AB
- *Disclaimer: Major Players sorted in no particular order

Recent Industry Developments
- April 2024: Getinge unveiled its Corin OR table and Ezea surgical light at the AORN conference in Nashville, focusing on workflow efficiency and safety.
- July 2023: Hospital Products Australia announced the latest breakthrough in surgical technology, the Mindray HyBase V9 Operating Table. The table’s intelligent safety features, such as anti-collision sensors and automatic locking mechanisms, contribute to a secure surgical environment, minimizing potential risks during procedures.


Research Methodology Framework and Report Scope
Market Definitions and Key Coverage
Our study defines the global surgical tables market as all new, powered or non-powered operating tables, general and specialty, supplied by original equipment makers to hospitals, ambulatory surgical centers, and specialty clinics for open or minimally invasive procedures. It covers carbon-fiber imaging platforms alongside conventional metal models sold during a calendar year.
Scope exclusion: disposable positioning aids and refurbished or rental tables are not counted.
Segmentation Overview
- By Type of Surgery
- General Surgery
- Orthopedic & Trauma
- Cardiovascular
- Neurosurgery
- Others
- By Material
- Metal
- Carbon-fiber Composite
- By End User
- Hospitals
- Ambulatory Surgical Centers
- Specialty Clinics
- By Geography
- North America
- United States
- Canada
- Mexico
- Europe
- Germany
- United Kingdom
- France
- Italy
- Spain
- Rest of Europe
- Asia-Pacific
- China
- Japan
- India
- South Korea
- Australia
- Rest of Asia-Pacific
- Middle East
- GCC
- South Africa
- Rest of Middle East
- South America
- Brazil
- Argentina
- Rest of South America
- North America
Detailed Research Methodology and Data Validation
Primary Research
Our analysts conducted interviews with biomedical engineers, peri-operative directors, procurement leads, and regional distributors across North America, Europe, and Asia-Pacific to verify shipment trends, typical ASP bands, and replacement windows. Short online surveys with ASC managers refined uptake rates for imaging-compatible and hybrid-OR tables.
Desk Research
We began by mapping procedure volumes through sources such as the WHO Global Surgery database, OECD Health Statistics, US CMS outpatient files, and Eurostat equipment inventories, which anchor annual demand cycles. Trade codes for stainless steel and carbon-fiber components were pulled from UN Comtrade, while FDA and EU-MDR notices clarified compliance-driven purchase waves.
Company filings, investor decks, and reputable association papers added ASP shifts and backlog data. Paid snapshots from D&B Hoovers, Dow Jones Factiva, and Questel illuminated revenue splits, news momentum, and patent pipelines. The list above is illustrative; numerous other outlets informed data collection and validation.
Market-Sizing & Forecasting
In our model, a top-down build converts global surgical procedure counts into table demand pools via utilization norms, then adjusts for replacement intervals and capacity ceilings. Selective bottom-up checks, supplier shipment tallies and sampled ASP×volume roll-ups, reconcile totals. Variables such as annual procedure growth, ASC construction, powered-table share, ASP drift, carbon-fiber price indices, and regulatory deadlines feed a multivariate regression with scenario analysis that extends the forecast to 2030. Gaps in granular shipment data are bridged through conservative interpolation vetted during expert calls.
Data Validation & Update Cycle
Mordor analysts triangulate outputs against import logs, capex announcements, and outlier ASP quotes; material variances trigger reruns and peer review before sign-off. Reports refresh yearly, with interim updates when recalls, mergers, or currency swings materially shift the baseline.
Why Mordor's Surgical Tables Baseline Inspires Industry Trust
We acknowledge that published estimates often differ because firms pick unique scopes, price assumptions, and refresh cadences. Many studies exclude hybrid-OR variants, freeze currency at prior-year rates, or apply flat ASP growth, whereas our work reports 2025 values in real terms, layers segment-specific ASP ladders, and updates annually. This is where Mordor Intelligence differentiates.
Benchmark comparison
| Market Size | Anonymized source | Primary gap driver |
|---|---|---|
| USD 1.57 B | Mordor Intelligence | - |
| USD 1.33 B | Global Consultancy A | Leaves out hybrid-OR and imaging tables; uses 2024 FX rates |
| USD 1.19 B | Industry Data Firm B | Four-year refresh, uniform 3 % ASP lift, omits ASC demand |
The comparison shows that, by marrying current procedure counts, specialty-table mix, and updated exchange rates, Mordor delivers a balanced, transparent anchor that decision-makers can trust.


Key Questions Answered in the Report
What is the current Surgical Tables Market size?
It is valued at USD 1.65 billion in 2026 and is forecast to grow at 5.24% annually to reach USD 2.13 billion by 2031.
Who are the key players in Surgical Tables Market?
Steris Plc, Skytron LLC, Stryker Corporation, Mizuho OSI and Getinge AB are the major companies operating in the Surgical Tables Market.
What challenges restrict adoption of advanced surgical tables?
Capital-budget constraints at mid-tier hospitals, shortages of skilled OR technologists, carbon-fiber supply volatility, and stricter FDA remanufacturing rules raise lifetime ownership costs.
Which region has the biggest share in Surgical Tables Market?
In 2025, the North America accounts for the largest market share in Surgical Tables Market.
Which region offers the highest growth potential?
Asia-Pacific leads in growth with a 6.56% CAGR, buoyed by hospital construction, medical tourism, and rapid uptake of robotics-ready OR infrastructure.
Page last updated on:


