Supply Chain Risk Management Market Size and Share
Market Overview
| Study Period | 2020 - 2031 |
|---|---|
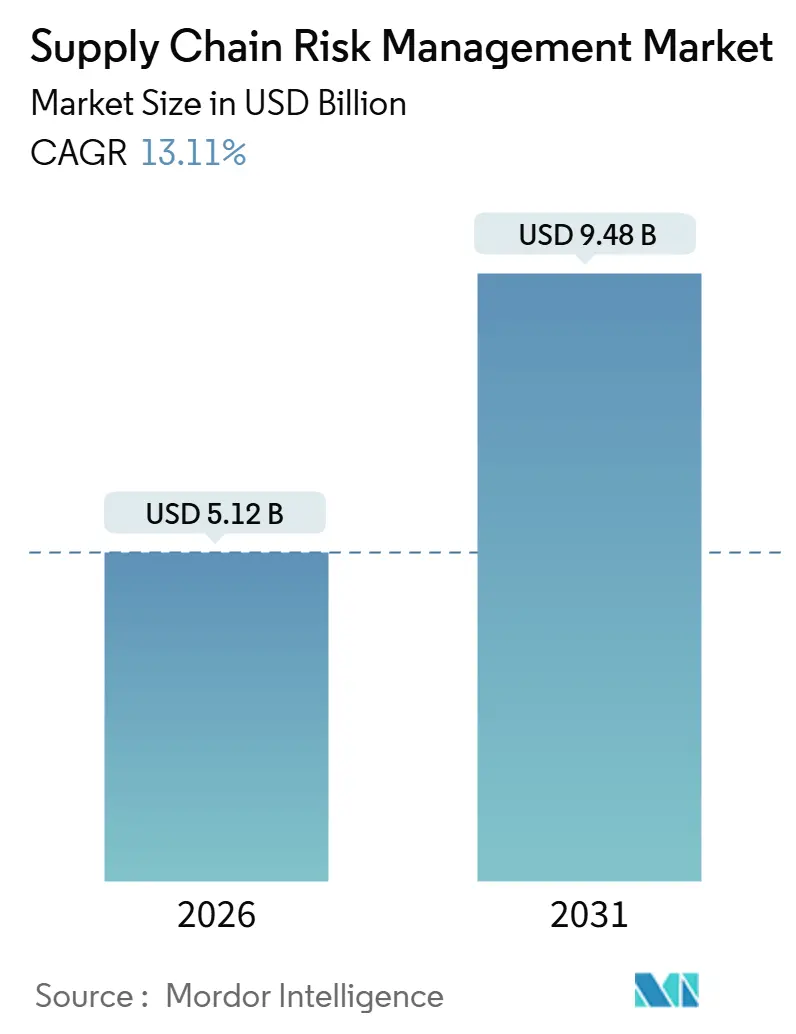
| Market Size (2026) | USD 5.12 Billion |
| Market Size (2031) | USD 9.48 Billion |
| Growth Rate (2026 - 2031) | 13.11% CAGR |
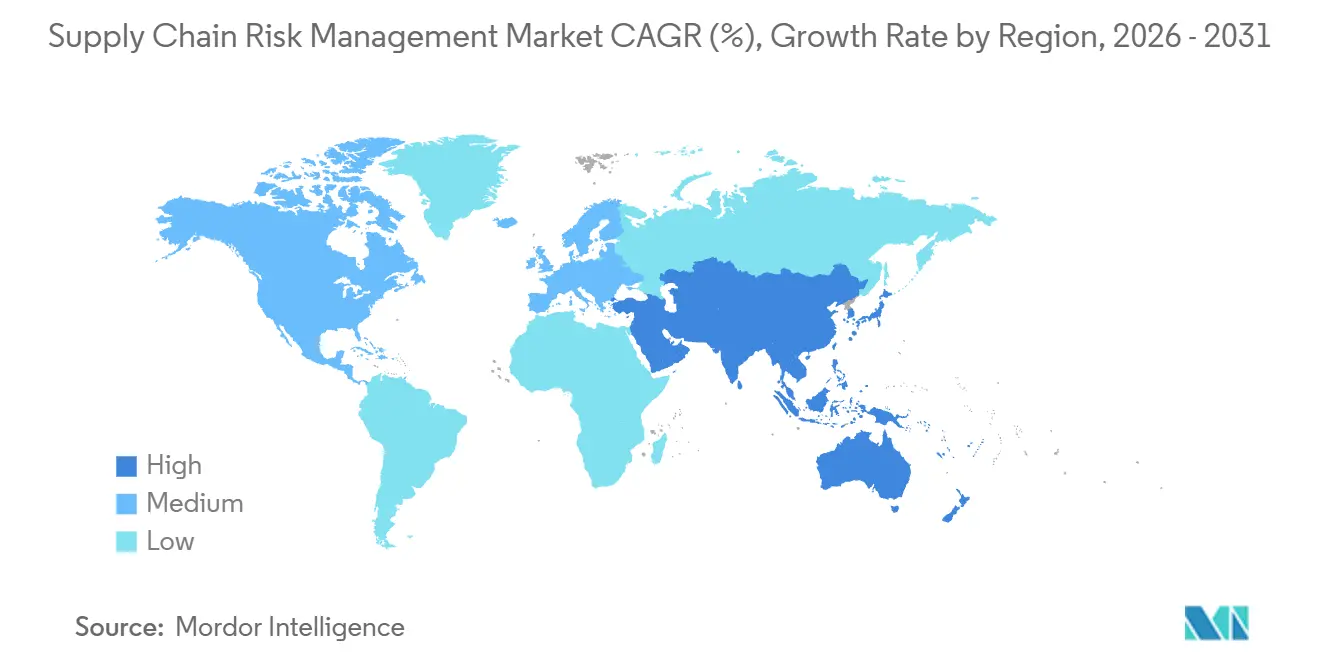
| Fastest Growing Market | Asia |
| Largest Market | North America |
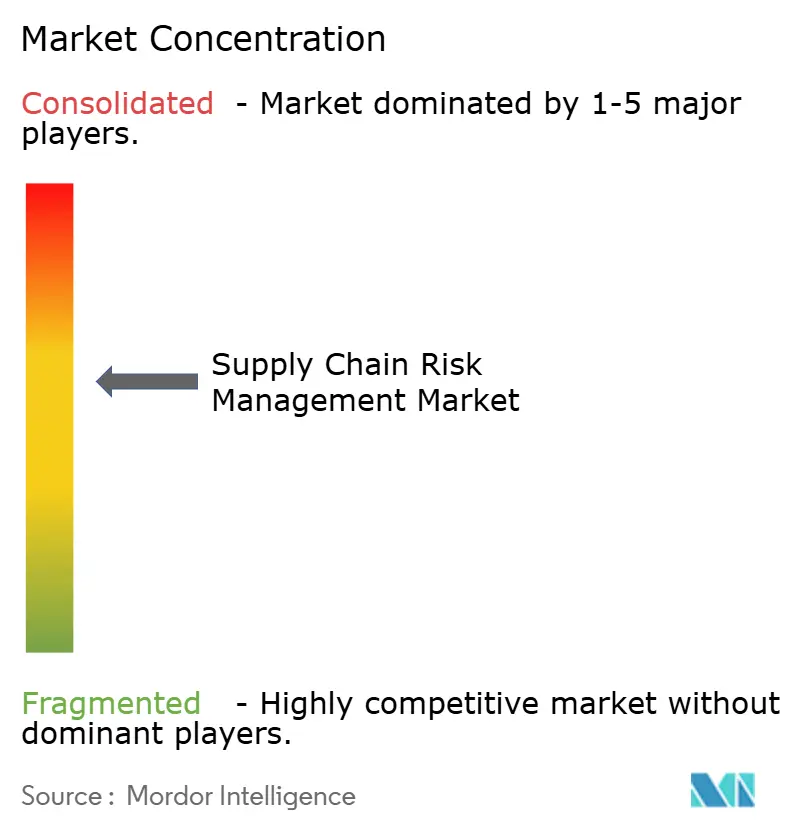
| Market Concentration | Medium |
Major Players *Disclaimer: Major Players sorted in no particular order Image © Mordor Intelligence. Reuse requires attribution under CC BY 4.0. | |
Supply Chain Risk Management Market Analysis by Mordor Intelligence
The supply chain risk management market size is valued at USD 5.12 billion in 2026 and is projected to climb to USD 9.48 billion by 2031, advancing at a 13.11% CAGR. Multinational enterprises are embedding predictive-analytics platforms into routine procurement processes, moving disruption response from an infrequent audit to an always-on discipline. Regulatory pressure is intensifying, most notably from the European Union Corporate Sustainability Due Diligence Directive, which elevates multi-tier supplier mapping to a board-level responsibility. Insurers now insist on continuous monitoring of third-party software dependencies before underwriting cyber-risk policies, a requirement that accelerated after a ransomware attack on a global logistics provider in 2024. Vendors that fuse satellite imagery, port-congestion indices, and regulatory updates into a single interface are gaining traction as users favor real-time visibility over retrospective reporting. Competitive dynamics show enterprise-resource-planning (ERP) incumbents bundling risk modules, while specialists differentiate through vertical depth and faster time-to-insight.
Key Report Takeaways
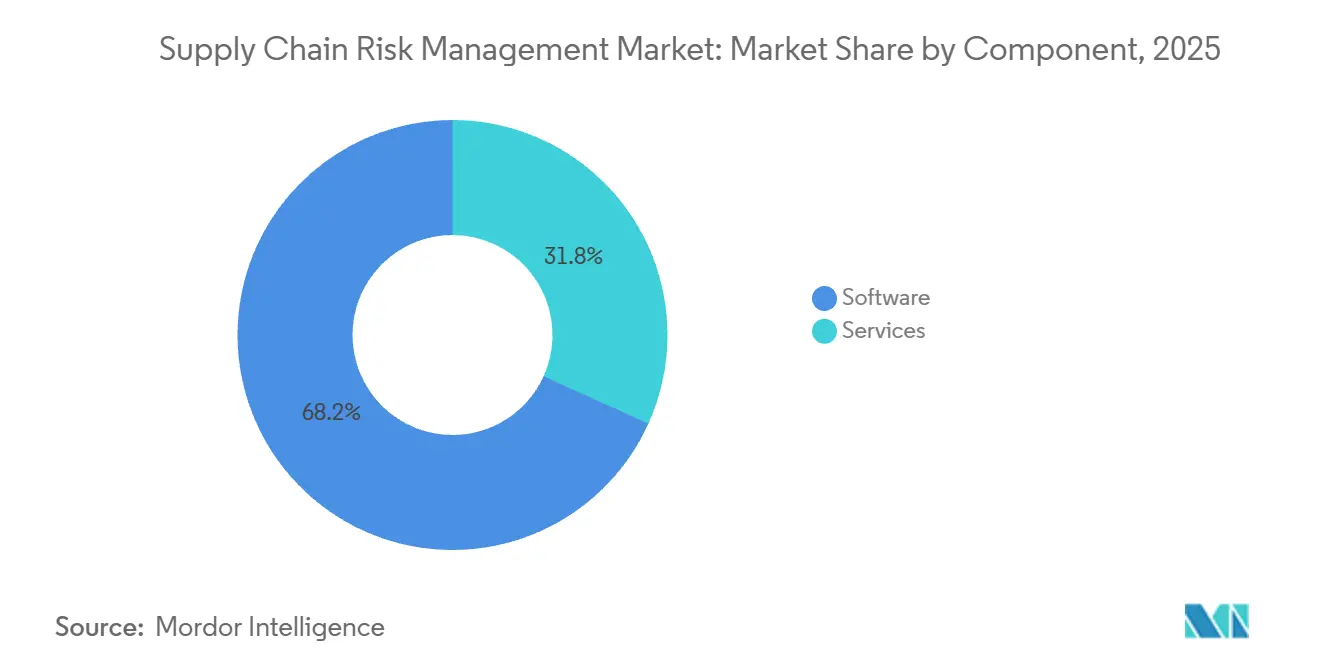
- By component, software captured 68.24% of the supply chain risk management market share in 2025, whereas services are forecast to expand at a 14.87% CAGR through 2031.
- By deployment model, cloud-hosted platforms held 72.41% of the supply chain risk management market size in 2025, while hybrid adoption is the fastest-growing configuration at a 14.27% CAGR to 2031.
- By enterprise size, large companies generated 64.47% of 2025 revenue, but small and medium enterprises exhibit the highest growth at a 16.19% CAGR through 2031.
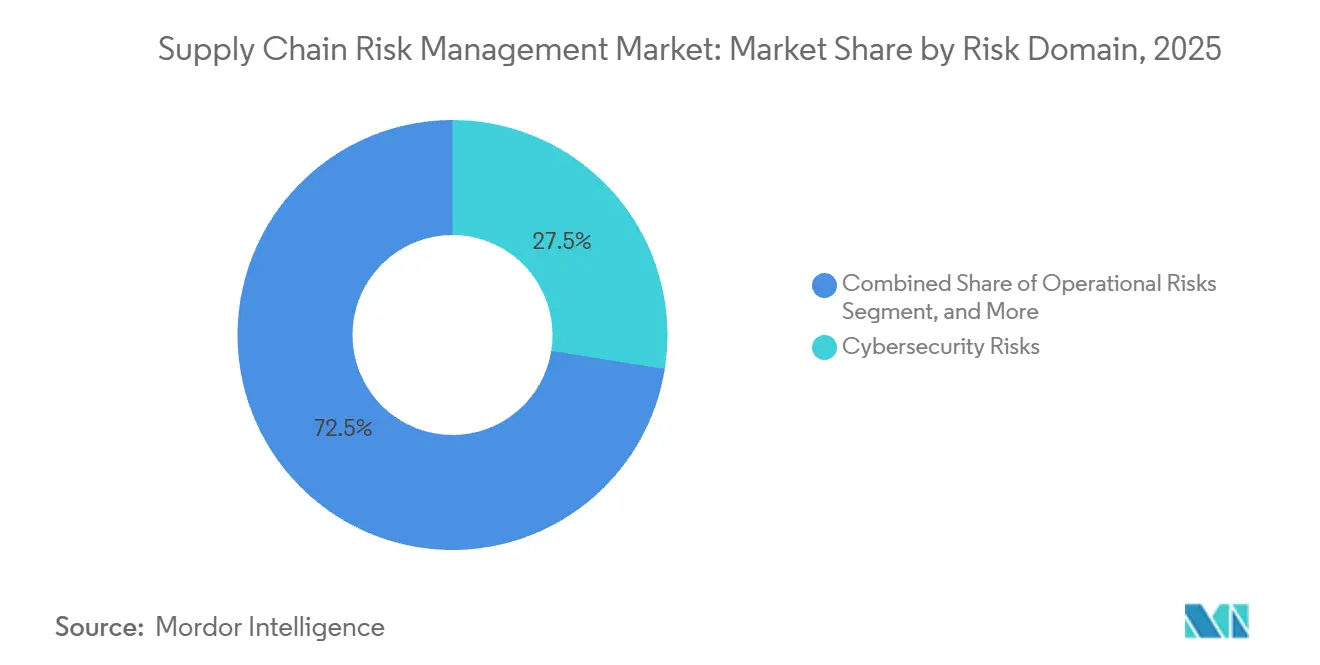
- By risk domain, cybersecurity accounted for 27.53% of the supply chain risk management market share in 2025 and is advancing at a 14.19% CAGR to 2031.
- By end-use industry, retail and consumer goods led with 23.12% revenue in 2025, whereas healthcare and pharmaceuticals record the fastest growth at a 14.19% CAGR to 2031.
- By geography, North America commanded 38.63% revenue in 2025, while Asia Pacific is the fastest-expanding region at a 14.16% CAGR to 2031.
Note: Market size and forecast figures in this report are generated using Mordor Intelligence’s proprietary estimation framework, updated with the latest available data and insights as of January 2026.
Global Supply Chain Risk Management Market Trends and Insights
Drivers Impact Analysis*
| Driver | (~) % Impact on CAGR Forecast | Geographic Relevance | Impact Timeline |
|---|---|---|---|
| Rising Complexity of Global Supply Chains | +2.8% | Global, with acute pressure in APAC manufacturing hubs and European automotive clusters | Medium term (2-4 years) |
| Escalating Frequency and Cost of Disruptions | +3.1% | Global, with elevated exposure in North America (climate events) and Middle East (geopolitical volatility) | Short term (≤ 2 years) |
| Regulatory Mandates for Supply-Chain Due-Diligence and ESG | +2.5% | Europe (CSDDD), North America (Uyghur Forced Labor Prevention Act), spillover to APAC exporters | Long term (≥ 4 years) |
| Advances in AI, Big Data and Predictive Analytics | +2.2% | North America and Europe early adoption, APAC scaling rapidly | Medium term (2-4 years) |
| Cyber-Insurance Underwriting Requirements | +1.4% | North America and Europe, with emerging traction in Australia and Singapore | Short term (≤ 2 years) |
| Regionalised Semiconductor Fabs Requiring Multi-Tier Mapping | +1.1% | United States (CHIPS Act), European Union (Chips Act), Japan, South Korea | Long term (≥ 4 years) |
| Source: Mordor Intelligence | |||
Rising Complexity of Global Supply Chains
Supply networks now span 50-plus countries, turning localized incidents into systemic shocks. Automotive manufacturers typically manage direct relationships with 250 tier-one suppliers that in turn depend on roughly 150 tier-two partners, creating roughly 37,500 hidden links that spreadsheets cannot visualize. The 2024 fire at a Japanese semiconductor plant illustrated this fragility when electric-vehicle lines in Germany and Mexico halted within 72 hours. As a result, demand is accelerating for graph databases that reveal single-point-of-failure components before disruption strikes. Complexity also spans software, where open-source libraries maintained by volunteers can harbor vulnerabilities, as highlighted by a critical logging utility flaw identified in 2024. Firms now require tools that map both physical and digital dependencies within the same platform.
Escalating Frequency and Cost of Disruptions
Natural disasters, labor stoppages, and geopolitical events erased USD 4.6 trillion in global output in 2024, 22% more than 2023.[1]World Economic Forum, “Supply Chain Disruptions Cost,” weforum.org Red Sea attacks forced vessels around the Cape of Good Hope, adding 14 transit days and USD 1 million in fuel per voyage. Climate-driven drought in the Panama Canal reduced daily ship slots by one-third, creating a five-month backlog. These cascading shocks are motivating chief procurement officers to shift spend from reactive firefighting to continuous risk scoring that ingests weather, vessel, and supplier financial data in near real time.
Regulatory Mandates for Supply-Chain Due-Diligence and ESG
The EU Corporate Sustainability Due Diligence Directive mandates human-rights and environmental vetting across value chains, with fines up to 5% of global turnover for non-compliance. In the United States, the Uyghur Forced Labor Prevention Act detains shipments lacking proof of ethical sourcing, resulting in 6,000 seizures valued at USD 1.7 billion in 2024. These regulations globalize ethical standards, pushing even APAC exporters to adopt blockchain-enabled traceability or risk market exclusion.
Advances in AI, Big Data and Predictive Analytics
Machine-learning models parse satellite imagery, port-congestion feeds, and social-media chatter to forecast delivery delays up to 30 days in advance. In 2024, the electronics pilot cut stockouts by 18% and reduced safety-stock costs by USD 42 million. Natural-language processing now extracts risk clauses from thousands of supplier contracts in minutes. Generative AI enables scenario queries such as “What if a Category 4 hurricane closes Port Houston for two weeks” and returns quantified revenue exposure plus mitigation steps. These capabilities shift platform value from retrospective dashboards to proactive decision support.
Restraints Impact Analysis*
| Restraint | (~) % Impact on CAGR Forecast | Geographic Relevance | Impact Timeline |
|---|---|---|---|
| High Implementation and Integration Cost for SMEs | -1.8% | Global, with acute pressure in South America, Africa, and Southeast Asia | Short term (≤ 2 years) |
| Lack of Standardised Risk Taxonomies and Data Quality | -1.3% | Global, particularly fragmented in cross-border supplier networks | Medium term (2-4 years) |
| Vendor Cloud-Concentration Risk Slows Single-Suite Adoption | -0.9% | North America and Europe, where multi-cloud strategies are prevalent | Medium term (2-4 years) |
| Data-Sovereignty Laws Limiting Cross-Border Supplier Data | -0.7% | China (Cybersecurity Law), Russia (data localization), European Union (GDPR extraterritorial reach) | Long term (≥ 4 years) |
| Source: Mordor Intelligence | |||
High Implementation and Integration Cost for SMEs
Small and medium enterprises are highly exposed to supply shocks yet often cannot justify software fees ranging from USD 50,000 to USD 200,000 when annual IT budgets seldom exceed low six figures. A 2024 European survey found 62% of manufacturers cited cost as the top adoption barrier even though 71% experienced a major disruption that year. Legacy ERP suites also lack modern APIs, inflating integration efforts from three to nine months. Vendors now market tiered SaaS plans as low as USD 10,000 per year, but pared-down functionality risks inadequate protection, keeping many SMEs on the sidelines.
Lack of Standardised Risk Taxonomies and Data Quality
Procurement teams wrestle with conflicting frameworks such as ISO 31000, COSO ERM, and proprietary ratings. Inconsistent definitions force manual reconciliation that introduces errors and delays. The Institute for Supply Management reported 58% of professionals view supplier-submitted data as unreliable, citing outdated financials and incomplete facility lists.[2]Institute for Supply Management, “Supply Chain Publications,” ismworld.org Data quality gaps widen in emerging markets where suppliers lack the infrastructure for real-time telemetry. Blockchain promises immutable provenance records, yet fewer than 5% of global suppliers participate in such networks as of 2025, leaving enterprises dependent on self-reported information.
*Our forecasts treat driver/restraint impacts as directional, not additive. The impact forecasts reflect baseline growth, mix effects, and variable interactions.
Segment Analysis
By Component: Services Gain as Integration Complexity Rises
Software solutions accounted for 68.24% revenue in 2025, highlighting the capital-light appeal of SaaS. However, services are expanding at a 14.87% CAGR, signaling an acknowledgment that licenses alone do not unlock full value. Enterprises hire consultants to map proprietary procurement workflows to a platform’s data model and tune alert thresholds, tasks that demand domain expertise. A European automotive supplier disclosed that professional services rose from 25% to 40% of total spend between 2022 and 2024.
Software vendors enjoy recurring subscriptions with gross margins above 75%, funding rapid feature releases like natural-language querying. Services deliver stickiness, as co-developed dashboards deter platform switching. Managed services sit between pure software and consulting, offering weekly risk briefings that attract mid-market firms lacking dedicated analysts.


By Deployment Model: Cloud Dominance Reflects Real-Time Data Imperatives
Cloud-hosted deployments captured 72.41% of revenue in 2025 and are projected to grow at a 14.27% CAGR through 2031, as users need to ingest fast-refresh data streams. A 2024 Gartner survey found that 68% cited “faster time to value” as the primary driver of cloud adoption.
On-premise persists in defense and pharmaceutical contexts where data residency rules apply, but even these industries now send anonymized scores to cloud analytics. Multi-tenancy lets firms benchmark risk against peers, impossible in siloed environments. Enterprises wary of hyperscaler outages are deploying multi-cloud strategies, replicating datasets across AWS, Azure, and Google Cloud, though sub-second latency requirements still justify on-premise nodes in semiconductor fabs.
By Enterprise Size: SMEs Adopt Faster Despite Cost Barriers
Large enterprises held 64.47% revenue in 2025, leveraging scale to negotiate global licenses and customize integrations across numerous ERP systems. The supply chain risk management market, however, sees SMEs growing fastest at 16.19% CAGR because modular SaaS tiers let users start small for USD 15,000 annually and expand later.
A 2024 North American survey found 54% of SMEs began with a single use case and broadened scope after proving ROI. Industry templates speed uptake - food producers, for instance, can monitor cold-chain metrics within weeks. Usage-based pricing, charging USD 50 per supplier yearly, further aligns cost with value.
By Risk Domain: Cybersecurity Commands Premium as Attacks Multiply
Cybersecurity risks accounted for 27.53% of 2025 revenue and are rising at a 14.19% CAGR, as compromised suppliers can open backdoors into buyer networks. The 2024 breach of a managed services provider affected 17 financial institutions, prompting regulators to stress the need for third-party cyber due diligence.[3]UK Financial Conduct Authority, “Third-Party Risk Guidance,” fca.org.uk
Operational risks still dominate ticket volumes, yet established mitigation, such as buffer inventory, tempers growth. Financial-risk modules now stream trade-credit data to flag suppliers whose days sales outstanding ratios spike, while geopolitical analysis remains coarse, often limited to binary flags. Machine-learning-driven early-warning indicators, such as satellite-derived parking-lot occupancy, are emerging differentiators.

By End-Use Industry: Healthcare Surges on Serialization Mandates
Retail and consumer goods accounted for 23.12% of revenue in 2025 because e-commerce networks rely on just-in-time models that collapse if a single hub fails. A 2024 labor strike at a West Coast facility idled USD 800 million in stock, prompting retailers to adopt multi-hub simulations. Healthcare and pharmaceuticals are growing at a 14.19% CAGR under the U.S. FDA Drug Supply Chain Security Act, which requires serialized drug tracking.
Manufacturing, particularly automotive and aerospace, continues a broad rollout given complex bills of materials. Food and beverage firms deploy traceability to meet EU Farm to Fork pesticide limits. Energy utilities face combined geopolitical, cybersecurity, and carbon-pricing exposures, favoring multi-domain platforms.
Geography Analysis
North America accounted for 38.63% of revenue in 2025, reflecting early adoption by automotive and aerospace OEMs scarred by past events, such as the 2021 chip shortage. The U.S. CHIPS and Science Act allocates USD 52.7 billion to reshore semiconductor output, driving detailed supplier mapping.[4]U.S. Department of Commerce, “CHIPS America Program,” commerce.gov Canada must verify component origin to comply with USMCA rules, while Mexico attracts nearshoring investment, though IT infrastructure gaps persist.
Asia Pacific is forecast to grow at a 14.16% CAGR through 2031, propelled by Chinese and Indian conglomerates diversifying away from single-country sourcing due to export-control restrictions. Japan’s USD 3.2 billion subsidy for domestic critical-materials production is spurring adoption of platforms that evaluate reshoring trade-offs. Southeast Asian electronics hubs wrestle with port congestion and power reliability, heightening demand for real-time monitoring. Australia’s mining industry turned to risk solutions after a cyclone disrupted iron-ore exports for six weeks and cost USD 1.4 billion.
Europe held roughly 28% revenue in 2025, led by Germany, France, and the United Kingdom, where automotive and pharmaceutical firms face strict regulations. The EU due-diligence directive pushes coverage to tier-three suppliers, accelerating adoption of graph-database visualization. South America and Africa combined account for under 8% today but post double-digit growth as multinationals extend best practices. The Middle East invests in logistics corridors under economic-diversification plans, with government-backed hubs requiring risk-management proof for supplier onboarding.

Competitive Landscape
The supply chain risk management market remains moderately fragmented, with SAP, IBM, Oracle, Resilinc, and Coupa holding a combined 35% share in 2025. ERP giants bundle risk modules into procurement suites, reducing acquisition cost but often lacking industry-specific features such as conflict-mineral traceability or cold-chain monitoring. Specialist platforms counter with proprietary datasets. Resilinc maps 85,000 supplier facilities and rapid disruption quantification, often within hours rather than days.
Managed-services providers are rising, operating platforms for clients and offering subscription risk briefings, an attractive model for mid-market companies without dedicated analysts. Real-time carbon-footprint tracking represents white space, as fewer than 10% of platforms could measure Scope 3 emissions in 2025. Geopolitical-scenario engines that simulate trade corridor closures are another emerging differentiator.
Technology is the primary battleground. Vendors that fuse satellite imagery, social media sentiment, and IoT telemetry deliver the earliest warnings. A 2024 patent describes using parking-lot occupancy to predict factory downtime. Those dependent on static supplier self-assessments risk commoditization as buyers demand predictive insight rather than retrospective scorecards.
Supply Chain Risk Management Industry Leaders
SAP SE
IBM Corporation
Resilinc Corporation
Interos Inc.
Coupa Software Inc.
- *Disclaimer: Major Players sorted in no particular order

Recent Industry Developments
- December 2025: SAP SE partnered with a European automotive consortium to roll out Integrated Business Planning for Supply Chain across 47 tier-one suppliers, aiming for a 25% reduction in stockouts and USD 60 million saved in safety-stock costs.
- November 2025: IBM launched the cloud-native Supply Chain Intelligence Suite with AI-driven forecasting, risk scoring, and ESG tracking, cutting manual audit time by 30% in initial pharmaceutical deployments.
- October 2025: Resilinc raised USD 50 million in Series D funding to expand its supplier database to 100,000 facilities and extend predictive horizons to 45 days.
- September 2025: Interos collaborated with a global logistics provider to feed real-time freight telemetry into its risk dashboard, aiming to achieve USD 12 million in recurring revenue by 2027.


Global Supply Chain Risk Management Market Report Scope
The Supply Chain Risk Management (SCRM) market is experiencing robust growth, driven by increasing global trade complexities, supply chain disruptions, and the need for enhanced resilience. As businesses face heightened risks from geopolitical tensions, natural disasters, and cybersecurity threats, demand for integrated SCRM solutions that offer real-time visibility and predictive analytics is accelerating. Additionally, advancements in AI, machine learning, and blockchain technology are transforming how organizations approach risk mitigation, further fueling market expansion.
The Supply Chain Risk Management Market is segmented by component (software, services), deployment (on-premise, cloud), enterprise size (large enterprise, small and medium enterprise), type (operational risks, financial risks, predictive analysis, geopolitical risks, cybersecurity risks, other type), end-use industry (retail, healthcare and pharmaceuticals, food and beverage, energy and utility, and other end-use industries) and geography (North America, Europe, Asia Pacific, Latin America, Middle East And Africa). the market sizes and forecasts are provided in terms of value (USD) for all the above segments.
| Software |
| Services |
| Cloud |
| On-Premise |
| Large Enterprises |
| Small and Medium Enterprises (SMEs) |
| Operational Risks |
| Financial Risks |
| Geopolitical Risks |
| Cybersecurity Risks |
| Predictive-Analytics-Led Risks |
| Other Risk Domains |
| Manufacturing |
| Retail and E-Commerce |
| Healthcare and Pharmaceuticals |
| Food and Beverage |
| Energy and Utilities |
| Other End-Use Industries |
| North America | United States |
| Canada | |
| Mexico | |
| South America | Brazil |
| Argentina | |
| Rest of South America | |
| Europe | United Kingdom |
| Germany | |
| France | |
| Italy | |
| Spain | |
| Russia | |
| Rest of Europe | |
| Asia Pacific | China |
| India | |
| Japan | |
| South Korea | |
| Australia | |
| Southeast Asia | |
| Rest of Asia Pacific | |
| Middle East | United Arab Emirates |
| Saudi Arabia | |
| Turkey | |
| Rest of Middle East | |
| Africa | South Africa |
| Nigeria | |
| Egypt | |
| Rest of Africa |
| By Component | Software | |
| Services | ||
| By Deployment Model | Cloud | |
| On-Premise | ||
| By Enterprise Size | Large Enterprises | |
| Small and Medium Enterprises (SMEs) | ||
| By Risk Domain | Operational Risks | |
| Financial Risks | ||
| Geopolitical Risks | ||
| Cybersecurity Risks | ||
| Predictive-Analytics-Led Risks | ||
| Other Risk Domains | ||
| By End-Use Industry | Manufacturing | |
| Retail and E-Commerce | ||
| Healthcare and Pharmaceuticals | ||
| Food and Beverage | ||
| Energy and Utilities | ||
| Other End-Use Industries | ||
| By Geography | North America | United States |
| Canada | ||
| Mexico | ||
| South America | Brazil | |
| Argentina | ||
| Rest of South America | ||
| Europe | United Kingdom | |
| Germany | ||
| France | ||
| Italy | ||
| Spain | ||
| Russia | ||
| Rest of Europe | ||
| Asia Pacific | China | |
| India | ||
| Japan | ||
| South Korea | ||
| Australia | ||
| Southeast Asia | ||
| Rest of Asia Pacific | ||
| Middle East | United Arab Emirates | |
| Saudi Arabia | ||
| Turkey | ||
| Rest of Middle East | ||
| Africa | South Africa | |
| Nigeria | ||
| Egypt | ||
| Rest of Africa | ||


Key Questions Answered in the Report
What is the current valuation of the supply chain risk management market?
The market stands at USD 5.12 billion in 2026.
How fast is the supply chain risk management market expected to grow?
It is projected to register a 13.11% CAGR through 2031.
Which deployment model leads adoption of supply-chain risk solutions?
Cloud-hosted platforms captured 72.41% of revenue in 2025 because they process real-time external data efficiently.
Why are cybersecurity risks gaining attention in supply-chain oversight?
A supplier breach can provide attackers with indirect entry into buyer networks, making cybersecurity the fastest-growing risk domain at a 14.19% CAGR.
Which region is forecast to grow most rapidly?
Asia Pacific is expected to expand at a 14.16% CAGR as firms diversify sourcing and adopt risk analytics.
What drives service spending in this market?
Integration complexity and demand for expert configuration push services to grow faster than software, at 14.87% CAGR through 2031.
Page last updated on:


