Vendor Risk Management Market Size and Share
Market Overview
| Study Period | 2020 - 2031 |
|---|---|
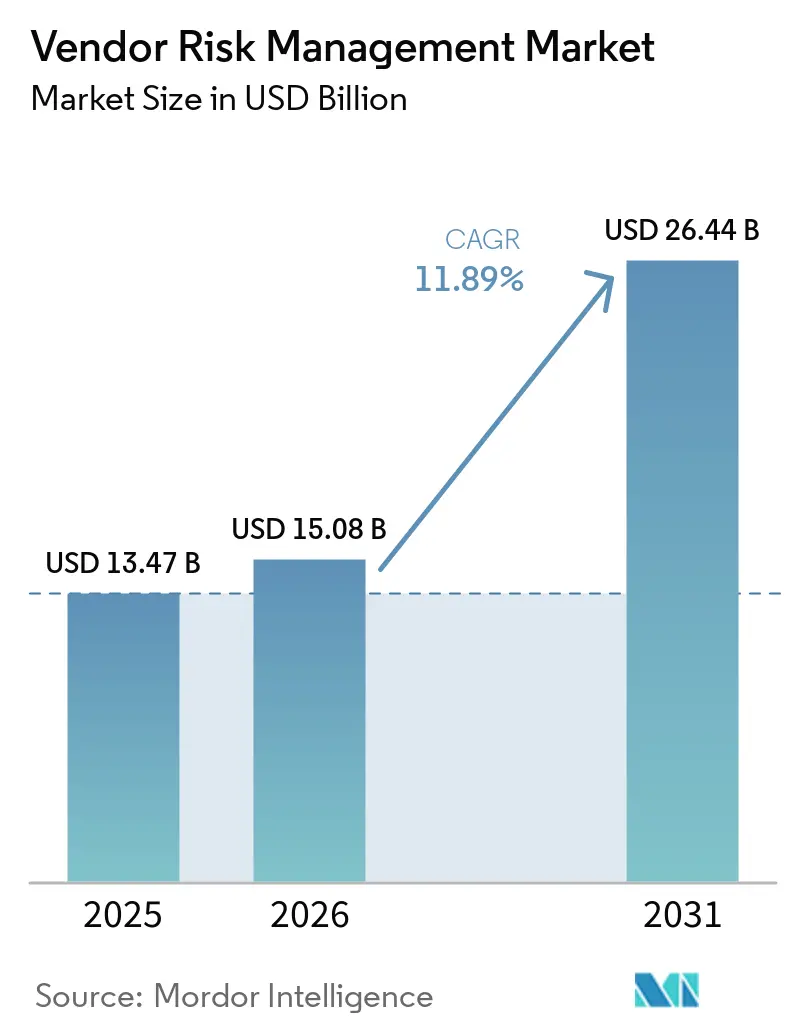
| Market Size (2026) | USD 15.08 Billion |
| Market Size (2031) | USD 26.44 Billion |
| Growth Rate (2026 - 2031) | 11.89% CAGR |
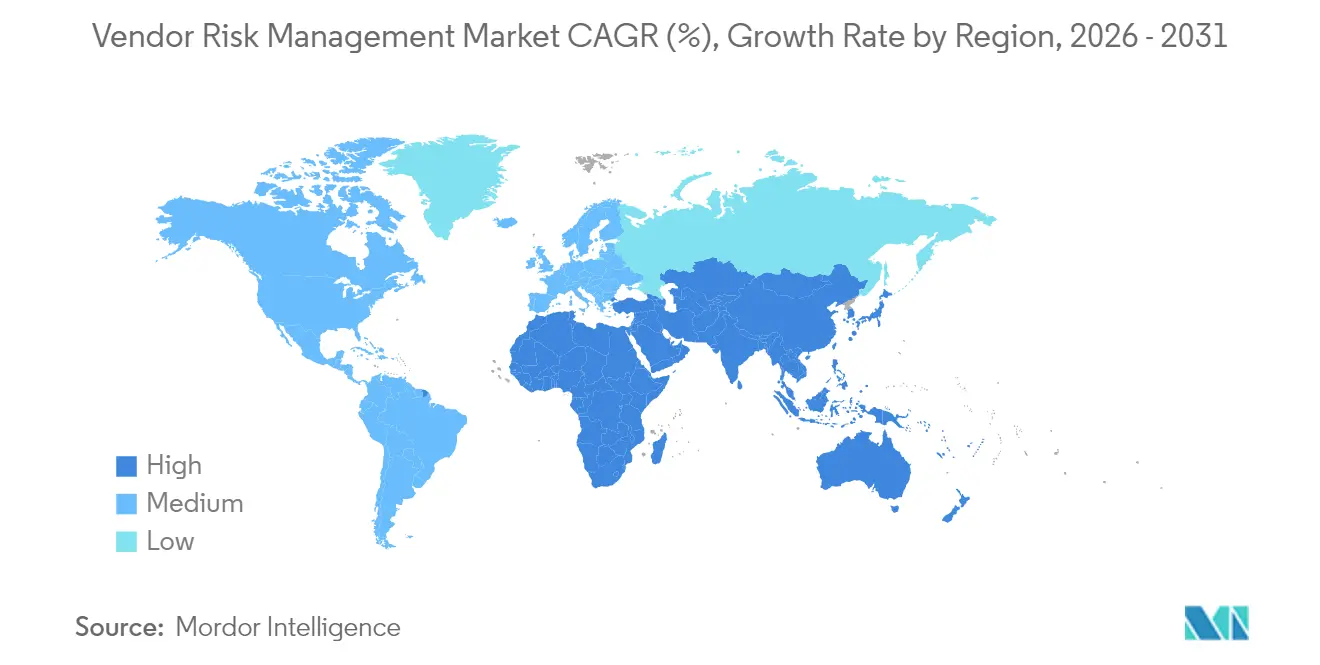
| Fastest Growing Market | North America |
| Largest Market | Asia Pacific |
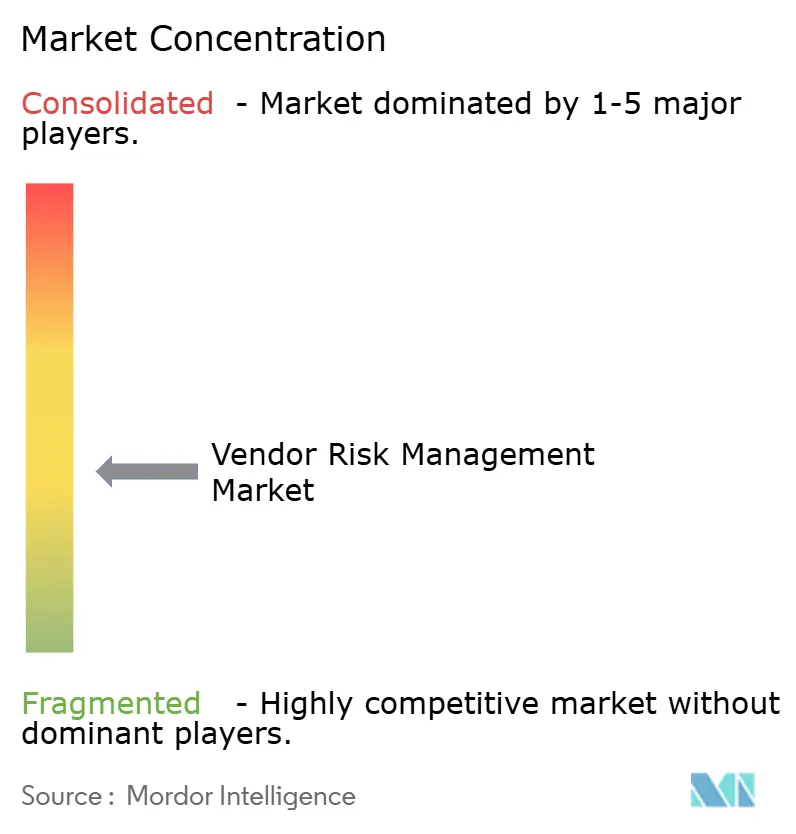
| Market Concentration | Medium |
Major Players *Disclaimer: Major Players sorted in no particular order Image © Mordor Intelligence. Reuse requires attribution under CC BY 4.0. | |
Vendor Risk Management Market Analysis by Mordor Intelligence
The vendor risk management market size was valued at USD 13.47 billion in 2025 and estimated to grow from USD 15.08 billion in 2026 to reach USD 26.44 billion by 2031, at a CAGR of 11.89% during the forecast period (2026-2031). Growth is anchored in the shift from periodic, compliance-driven checks to continuous oversight as supply-chain cyber attacks intensify and regulators demand broader third-party visibility. Cloud deployment, the rise of ESG due diligence mandates, and widening vendor ecosystems in finance, healthcare, and manufacturing are expanding addressable demand. Providers are differentiating through AI-enabled analytics, industry-specific content, and modular architectures that lower adoption barriers for mid-market buyers. North America remains the largest regional buyer base, while Asia-Pacific generates the fastest incremental spend as digital-native firms scale multi-cloud estates.
Key Report Takeaways
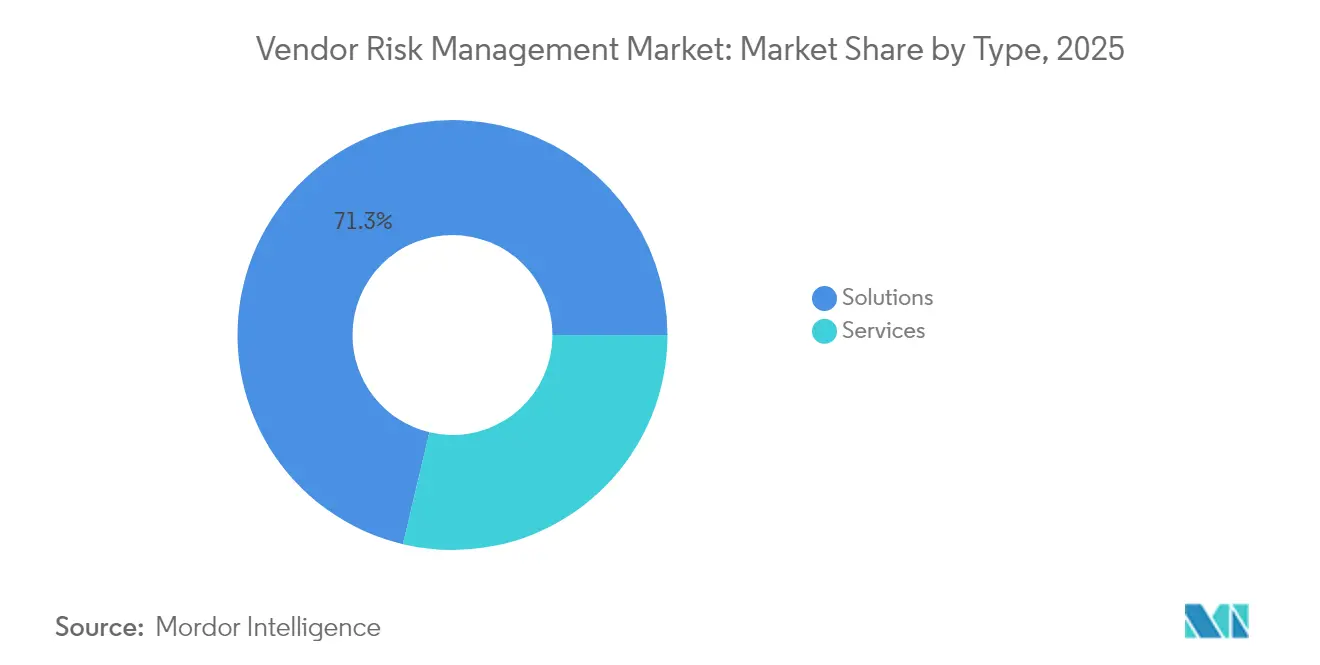
- By type, solutions held 71.30% of the vendor risk management market share in 2025, while services are projected to expand at a 14.12% CAGR through 2031.
- By deployment model, cloud captured 64.40% of the vendor risk management market size in 2025 and is set to grow at a 14.58% CAGR to 2031.
- By organization size, large enterprises accounted for 69.20% of the revenue in the vendor risk management market in 2025; small and mid-sized enterprises are expected to advance at a 13.62% CAGR through 2031.
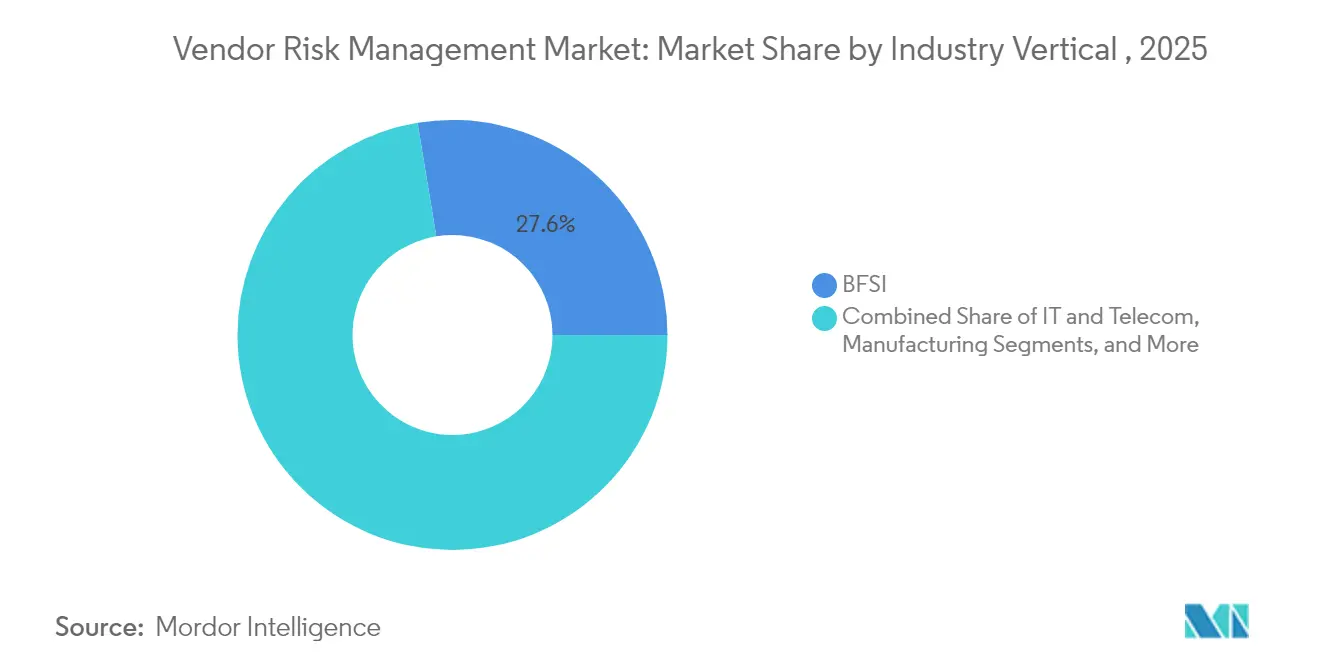
- By industry vertical, the BFSI segment led with a 27.60% revenue share of the vendor risk management market in 2025, whereas the healthcare segment is forecast to rise at a 14.88% CAGR through 2031.
- By risk domain, operational risk accounted for 34.70% of the vendor risk management market size in 2025, while ESG risk is the fastest-growing domain, with an 17.35% CAGR.
- By geography, North America accounted for 34.60% of the vendor risk management market revenue in 2025, while the Asia-Pacific region is projected to log a 13.86% CAGR between 2026 and 2031.
Note: Market size and forecast figures in this report are generated using Mordor Intelligence’s proprietary estimation framework, updated with the latest available data and insights as of 2026.
Global Vendor Risk Management Market Trends and Insights
Drivers Impact Analysis*
| Driver | (~) % Impact on CAGR Forecast | Geographic Relevance | Impact Timeline |
|---|---|---|---|
| Escalating Supply-Chain Cyber-Attacks Triggering Enterprise-Wide 3rd-Party Risk Programs | +3.2% | North America, with spillover to Europe and Asia-Pacific | Medium term (2-4 years) |
| Proliferation of ESG Due-Diligence Mandates in EU Corporate Sustainability Reporting Directive | +2.5% | Europe, with global impact on multinational corporations | Long term (≥ 4 years) |
| Accelerated Cloud Adoption Complicating Vendor Footprints Among APAC Digital-Native Firms | +2.1% | Asia-Pacific, with influence on global cloud service providers | Medium term (2-4 years) |
| Banking Regulators' Heightened Scrutiny of Outsourcing Risk Fueling BFSI Spend | +1.8% | Global, with emphasis on North America and Europe | Short term (≤ 2 years) |
| Cost-Efficiency Gains From AI-Driven Continuous Vendor Monitoring Solutions | +1.5% | Global, with early adoption in North America | Medium term (2-4 years) |
| Emergence of Industry-Specific Vendor Risk Exchanges in Healthcare and Life Sciences | +1.3% | North America, with gradual expansion to Europe | Long term (≥ 4 years) |
| Source: Mordor Intelligence | |||
Escalating Supply-Chain Cyber-Attacks Triggering Enterprise-Wide Third-Party Risk Programs
Supply-chain cyber incidents surged by 431% between 2021 and 2023, elevating third-party risk to a strategic board priority. Manufacturing, healthcare, and finance now routinely integrate continuous monitoring, incident response playbooks, and collaborative procurement-security workflows. The UK Cyber Security Breaches Survey 2025 notes that 43% of firms endured a breach in the past year, and 85% involved phishing campaigns exploiting trusted vendors [1]UK Department for Science, Innovation and Technology, “Cyber Security Breaches Survey 2025,” gov.uk. Board-level visibility into supplier controls, attack-surface analytics, and real-time alerts is accelerating platform upgrades and favouring providers with AI-driven detection engines.
Proliferation of ESG Due-Diligence Mandates in EU CSRD
The Corporate Sustainability Reporting Directive broadened mandatory ESG disclosure to roughly 50,000 companies from January 2024, obliging risk teams to map and monitor environmental and human-rights exposure across supply chains. Firms must integrate greenhouse-gas, labour, and diversity metrics into vendor selection and continuously screen for adverse impacts. Coupled with the forthcoming Corporate Sustainability Due Diligence Directive, the rules prioritise traceability and remediation, spurring investments in platforms that unify financial, cyber, and ESG risk signals. Early adopters in automotive, retail, and pharmaceuticals are piloting shared assessment exchanges to streamline evidence collection.
Accelerated Cloud Adoption Complicating Vendor Footprints Among APAC Digital-Native Firms
Asia-Pacific’s digital-native enterprises often juggle several cloud service providers and hundreds of SaaS contracts, creating sprawling supplier estates. Misunderstandings around the shared-responsibility model persist, leading to under-protected workloads [2] ISACA, “Navigating Risk When Transitioning to the Cloud,” isaca.org. The Financial Services Sector Coordinating Council identifies transparency gaps and concentration risk, urging robust due diligence and contractual safeguards [4]Financial Services Sector Coordinating Council, “Cloud-Outsourcing Issues and Considerations,” sifma.org. Organizations are therefore standardising cloud-specific questionnaires, adopting multi-cloud visibility tools, and aligning supplier contracts with zero-trust architectures.
Banking Regulators’ Heightened Scrutiny of Outsourcing Risk Fueling BFSI Spend
The European Central Bank flags that over 30% of banks’ outsourcing budgets sit with only ten providers, heightening concentration risk [3]European Central Bank, “Rise in Outsourcing Calls for Attention – ECB Banking Supervision,” bankingsupervision.europa.eu. In the United States, amended Regulation S-P enforces stricter oversight of service firms handling consumer data beginning August 2024, while Europe’s Digital Operational Resilience Act sets new contractual standards from January 2025. Financial institutions are deploying integrated vendor risk suites capable of continuous control validation, automated evidence capture, and board-ready reporting to satisfy auditors and examiners.
Restraints Impact Analysis*
| Restraint | (~) % Impact on CAGR Forecast | Geographic Relevance | Impact Timeline |
|---|---|---|---|
| Fragmented Vendor Data Taxonomies Hindering Interoperability Across Enterprise Systems | -1.2% | Global, with greater impact in regions with diverse regulatory frameworks | Medium term (2-4 years) |
| High Total Cost of Ownership for Integrated GRC Suites Among Mid-Market Organizations | -0.9% | Global, with particular impact on emerging markets | Short term (≤ 2 years) |
| Talent Shortage in Third-Party Risk Analysts Constraining Implementation Velocity in MEA | -0.7% | Middle East and Africa, with spillover effects globally | Medium term (2-4 years) |
| Perceived Data-Privacy Concerns Around Sharing Supplier Risk Scores With External Networks | -0.6% | Global, with heightened impact in regions with strict data protection laws | Long term (≥ 4 years) |
| Source: Mordor Intelligence | |||
Fragmented Vendor Data Taxonomies Hindering Interoperability Across Enterprise Systems
Inconsistent metadata standards block seamless data exchange between procurement, contract, and ERP platforms. A Nature study underscores that ill-matched structures slow integration and limit analytics quality. Siloed formats force manual reconciliations, prolong implementation cycles, and dilute the value of predictive scoring. Global industry consortia are working on common ontologies, yet divergent privacy rules and legacy architectures mean progress will be gradual.
High Total Cost of Ownership for Integrated GRC Suites Among Mid-Market Organizations
Comprehensive governance, risk, and compliance platforms often require high subscription fees, complex configuration, and skilled staff, weighing on mid-market budgets. Vendors are responding with modular packages, managed-service options, and usage-based pricing, but initial costs and change-management demands still deter many buyers. As a result, some firms stay with spreadsheets or narrow point tools, slowing the broad adoption of unified vendor oversight.
*Our forecasts treat driver/restraint impacts as directional, not additive. The impact forecasts reflect baseline growth, mix effects, and variable interactions.
Segment Analysis
By Type: Solutions Maintain Dominance While Service Engagement Climbs
Solutions accounted for 71.30% of vendor risk management market revenue in 2025 as firms prioritised core infrastructures such as vendor information management and compliance modules. The vendor risk management market size for solutions is projected to widen steadily, although organisations now demand AI-assisted document parsing and automated evidence gathering to cut analyst workloads. Services, spanning implementation, advisory, and managed operations, are gaining ground at 14.12% CAGR as buyers seek expertise to navigate sprawling regulations and integrate risk data streams.
Service uptake is strongest in healthcare and manufacturing, where in-house teams face resource gaps. Advisory partners assist with control mapping against CSRD, DORA, and sector-specific norms, while managed-service providers deliver continuous vendor surveillance. The shift indicates that talent shortages and heightened board expectations are pushing organisations toward hybrid delivery models blending software with expert support.


By Deployment Type: Cloud Acceleration Reshapes Implementation Models
Cloud delivery captured 64.40% of the vendor risk management market in 2025. Benefiting from rapid rollout, elastic scaling, and browser access, the vendor risk management market share for cloud platforms is projected to rise further as multinationals consolidate tools onto single stacks that serve global teams. Hybrid approaches persist where data-sovereignty obligations limit full migration, yet even highly regulated banks and insurers now use cloud for low-risk data processing and analytics.
On-premises installations remain important for defence, public-sector, and critical-infrastructure clients. However, cloud platform vendors are addressing concerns through dedicated hosting zones, encryption key management, and audit-ready logging. Growing confidence in shared-responsibility frameworks and improved contractual terms is reducing barriers, enabling organizations to phase critical workflows into secure cloud environments.
By Organization Size: Large Enterprises Lead While SMEs Catch Up
Large enterprises commanded 69.20% of 2025 spending as they oversee thousands of suppliers across multiple jurisdictions. One-third of major financial institutions now manage over 1,000 vendors, necessitating scalable workflows and extensive integration with procurement and security platforms. These buyers demand enterprise-grade configurability, extensive API libraries, and role-based analytics.
Small and mid-sized enterprises are forecast to expand spend at 13.62% CAGR as board directors recognise that third-party failures can threaten revenue and brand value. The Cybersecurity and Infrastructure Security Agency’s vendor-risk template for SMBs offers a lightweight starting point, helping firms ask the right questions and automate reminders. Suppliers are packaging off-the-shelf control libraries, guided questionnaires, and affordable continuous-scanning tiers that match the budget and skill realities of smaller teams.
By Industry Vertical: BFSI Sustains Leadership While Healthcare Accelerates
The BFSI sector held 27.60% of 2025 revenue due to stringent outsourcing oversight and the financial impact of service disruptions. European Central Bank reviews found multiple banks with non-compliant vendor contracts, prompting immediate remediation programmes. Institutions are embedding vendor risk analytics in procurement workflows, aligning exposure ratings with capital adequacy calculations and recovery planning.
Healthcare is set to rise at 14.88% CAGR as ransomware and patient-data breaches tied to business associates surge. Providers now require evidence of HIPAA safeguards, secure coding practices, and cyber insurance from suppliers. Industry consortia are piloting vendor-risk exchanges that allow hospitals to share assessment artefacts, reducing duplicative effort. Telecommunications, manufacturing, and government segments also deepened investments, driven by sustainability mandates and geopolitical supply-chain scrutiny.
By Risk Domain: Operational Risk Dominates While ESG Surges
Operational risk retained a 34.70% share in 2025, reflecting the universal need for uninterrupted service delivery. Downtime penalties and lost revenue compel organisations to scrutinise supplier resiliency, capacity planning, and incident history. Real-time key-performance indicators and scenario dashboards support proactive escalation.
ESG risk is the fastest riser with 17.35% CAGR as investors and regulators link sustainability performance to enterprise value. CSRD, CSDDD, and similar rules necessitate granular mapping of labour practices, carbon output, and anti-corruption controls across tiers. Platforms now ingest supplier-reported metrics, satellite imagery, and whistle-blower feeds to score ESG posture. Cybersecurity, compliance, and financial-health domains remain critical, but integrated views across categories enable more balanced sourcing decisions.
Geography Analysis
North America generated 34.60% of 2025 revenue, supported by rigorous privacy law enforcement and mature financial and healthcare ecosystems. The SEC’s revised Regulation S-P obliges financial services firms to document vendor oversight and incident workflows, spurring technology upgrades. Healthcare providers contend with a 287% surge in breaches routed through business associates, prompting greater allocation to continuous scanning and contract hygiene.
Asia-Pacific is the fastest-growing region at 13.86% CAGR. Rapid cloud adoption, new data-protection statutes, and heightened enforcement in markets such as Singapore and India push enterprises to formalise supplier oversight. Regional security spending is projected to reach USD 52 billion by 2027, and multinational corporations often pilot unified vendor risk management programmes in their APAC subsidiaries to harmonise global standards.
Europe’s trajectory is shaped by CSRD and the 2025 introduction of DORA. Large firms must map environmental and human-rights impacts across extended supply chains, while banks are required to update critical-service contracts under new resilience rules. Data-transfer constraints under GDPR and upcoming AI governance laws further raise the compliance bar, increasing demand for centralised repositories, automated evidence workflows and auditable decision trails.

Competitive Landscape
The vendor risk management market features a blend of enterprise software giants, focused risk-tech specialists, and venture-backed innovators. Leading platforms integrate continuous rating feeds, contract lifecycle management, and policy mapping into configurable workspaces. MetricStream’s 2025 partnership with Glencore illustrates demand for industry-tuned content, combining mining-specific ESG metrics with global audit workflows. ServiceNow, Coupa, and SAP extend procurement and IT-service roots to embed vendor-risk dashboards in existing user interfaces, reducing change-management friction.
AI-native entrants automate document extraction, control mapping, and predictive scoring, lowering analyst workloads amid a widening talent gap. Some providers are experimenting with blockchain-secured assessment ledgers to eliminate duplicate attestations and to prove data integrity. Meanwhile, managed-service specialists target mid-market buyers that lack in-house bandwidth, bundling technology, analyst expertise, and compliance reporting in subscription packages. Competitive intensity is driving module unbundling, value-based pricing, and increased openness through APIs and standard data models.
Vendor Risk Management Industry Leaders
RSA Security LLC
Genpact Limited
Lockpath (NAVEX)
MetricStream Inc.
IBM Corporation
- *Disclaimer: Major Players sorted in no particular order

Recent Industry Developments
- May 2025: Venminder reported that 41.8% of fintech breaches stem from third parties, underscoring personnel security gaps in the sector.
- April 2025: MetricStream partnered with Glencore to deepen risk, audit, and compliance programmes across mining operations.
- March 2025: TrustCloud rolled out AI-driven third-party risk assessment features to streamline evidence reviews and scoring.
- January 2025: Censinet launched continuous monitoring and controls validation modules tailored to healthcare vendor ecosystems.


Research Methodology Framework and Report Scope
Market Definitions and Key Coverage
Our study treats the vendor risk management (VRM) market as all software platforms and professional services that identify, assess, monitor, and mitigate operational, cyber, financial, compliance, and ESG threats originating from third-party vendors across the full engagement life-cycle, from onboarding to off-boarding.
Scope exclusion: point solutions built solely for internal governance, risk, and compliance (GRC) activities without third-party modules are left outside this market.
Segmentation Overview
- By Type
- Solutions
- Vendor Information Management
- Quality Assurance Management
- Financial Control
- Compliance Management
- Audit Management
- Contract Management and Others
- Services
- Professional Services
- Managed Services
- Solutions
- By Deployment Type
- On-Premises
- Cloud
- By Organization Size
- Small and Medium-Sized Enterprises
- Large Enterprises
- By Industry Vertical
- Banking, Financial Services and Insurance (BFSI)
- IT and Telecom
- Manufacturing
- Government
- Healthcare
- Others (Energy and Utilities, and Retail and Consumer Goods)
- By Risk Domain
- Cybersecurity Risk
- Financial Risk
- Operational Risk
- Compliance Risk
- ESG / Sustainability Risk
- By Geography
- North America
- United States
- Canada
- Mexico
- South America
- Brazil
- Argentina
- Chile
- Peru
- Rest of South America
- Europe
- Germany
- United Kingdom
- France
- Italy
- Spain
- Rest of Europe
- Asia-Pacific
- China
- Japan
- South Korea
- India
- Australia
- New Zealand
- Rest of Asia-Pacific
- Middle East and Africa
- Middle East
- United Arab Emirates
- Saudi Arabia
- Turkey
- Rest of Middle East
- Africa
- South Africa
- Nigeria
- Egypt
- Rest of Africa
- Middle East
- North America
Detailed Research Methodology and Data Validation
Primary Research
Mordor analysts spoke with CISOs, procurement heads, and leading audit consultants across North America, Europe, and APAC. Interviews clarified average third-party counts per enterprise, real-world pricing of SaaS VRM suites, and emerging demand for continuous ESG screening, letting us adjust model assumptions and close information gaps.
Desk Research
We began with public datasets that map the demand pool, such as U.S. OCC and EU-EBA guidance on third-party oversight, SEC cyber-incident disclosures, NIST vulnerability feeds, and supplier count statistics released by the National Association of Manufacturers. Company 10-Ks, vendor prospectuses, and trusted media coverage were mined for spending benchmarks. Where revenue splits or shipment-level clues were sparse, proprietary tools inside Dow Jones Factiva and D&B Hoovers gave us directional vendor-side revenues. These examples merely illustrate the wider set of secondary inputs consulted.
A final sweep of trade association white papers, patent filings accessed through Questel, and customs data from Volza helped verify technology adoption rates and regional trade flows before numbers were frozen.
The list above is not exhaustive; dozens of other credible sources informed data collection and clarification.
Market-Sizing & Forecasting
A top-down and bottom-up blend was applied. Top-down reconstruction started with the population of active vendor relationships and compliance audit spend by industry, which are then linked to adoption rates, average seat counts, and subscription fees. Supplier roll-ups and channel checks served as selective bottom-up validation. Key variables like the number of critical vendors per firm, frequency of regulator-mandated assessments, average cost per due-diligence cycle, incident-led budget spikes, and cloud migration share drive the revenue curve. Forecasts rely on multivariate regression that ties spend per vendor to GDP-weighted cyber-incident frequency and tightening regulatory notices, creating low, base, and high scenarios. Gaps where vendor revenues were incomplete were bridged with sampled ASP × volume ranges cross-checked during expert calls.
Data Validation & Update Cycle
Outputs undergo variance checks against independent indicators, followed by a two-step peer review within our team. Reports refresh annually, with mid-cycle updates triggered by material events; just before release, an analyst runs a final sense check so clients receive the latest view.
Why Mordor's Vendor Risk Management Baseline Commands Reliability
Published estimates regularly diverge because firms differ in scope, input depth, and refresh cadence.
Key gap drivers include whether services revenue is counted alongside software, the depth of ESG risk coverage, currency conversion timing, and how aggressively price compression is modeled. Our analysts publish a base case that balances conservative and accelerated adoption paths, and we refresh it every twelve months, which many studies do not.
Benchmark comparison
| Market Size | Anonymized source | Primary gap driver |
|---|---|---|
| USD 13.47 B (2025) | Mordor Intelligence | |
| USD 10.67 B (2024) | Regional Consultancy A | Excludes managed services and applies 18-month-old FX rates |
| USD 11.50 B (2023) | Trade Journal B | Treats third-party risk as a subset of wider GRC spend, inflating overlap |
| USD 7.99 B (2023) | Global Consultancy C | Uses vendor count sample limited to North America, then extrapolates globally |
Taken together, the comparison shows that by selecting the right scope, validating prices through interviews, and following a strict update rhythm, our baseline offers decision-makers the most balanced and transparent view available.


Key Questions Answered in the Report
What is the current value of the vendor risk management market?
The market is valued at USD 15.08 billion in 2026 and is projected to reach USD 26.44 billion by 2031.
Which region is growing the fastest?
Asia-Pacific posts the highest forecast CAGR at 13.86% due to rapid digitalisation and evolving regulatory pressure.
Why are cloud deployments preferred for vendor risk management?
Cloud models offer rapid implementation, elastic scalability and seamless updates, enabling 64.40% of organisations to adopt them in 2025 and grow usage at 14.58% CAGR.
Which industry vertical spends the most on vendor risk oversight?
Banking, financial services and insurance lead with 27.60% of 2025 revenue, reflecting strict outsourcing rules and high cyber exposure.
What is driving the rise in ESG-focused vendor assessments?
The EU Corporate Sustainability Reporting Directive requires extensive disclosures across value chains, pushing firms to integrate ESG metrics into supplier selection and monitoring, driving the ESG risk domain at an 17.35% CAGR.
How do AI capabilities improve vendor risk programmes?
AI automates document review, detects anomalies and delivers continuous monitoring, allowing enterprises to scale oversight despite a shortage of specialised analysts.
Page last updated on:


