
Technology, Media and Telecom
5th MayPricing Strategy for Semiconductor Components
3 Min Read
The Inventory Management Market is Segmented by Application (Inventory Control and Tracking, Order Management, and More), Deployment Type (Cloud-Based, On-Premise, and Hybrid), End-User Enterprise Size (Large Enterprises, Small and Medium Enterprises), Component (Software, and Services), End-User Industry (Retail, E-Commerce, and More), and Geography. The Market Forecasts are Provided in Terms of Value (USD).
Market Overview
| Study Period | 2020 - 2031 |
|---|---|
| Market Size (2026) | USD 2.95 Billion |
| Market Size (2031) | USD 4.14 Billion |
| Growth Rate (2026 - 2031) | 6.99 % CAGR |
| Fastest Growing Market | Asia Pacific |
| Largest Market | North America |
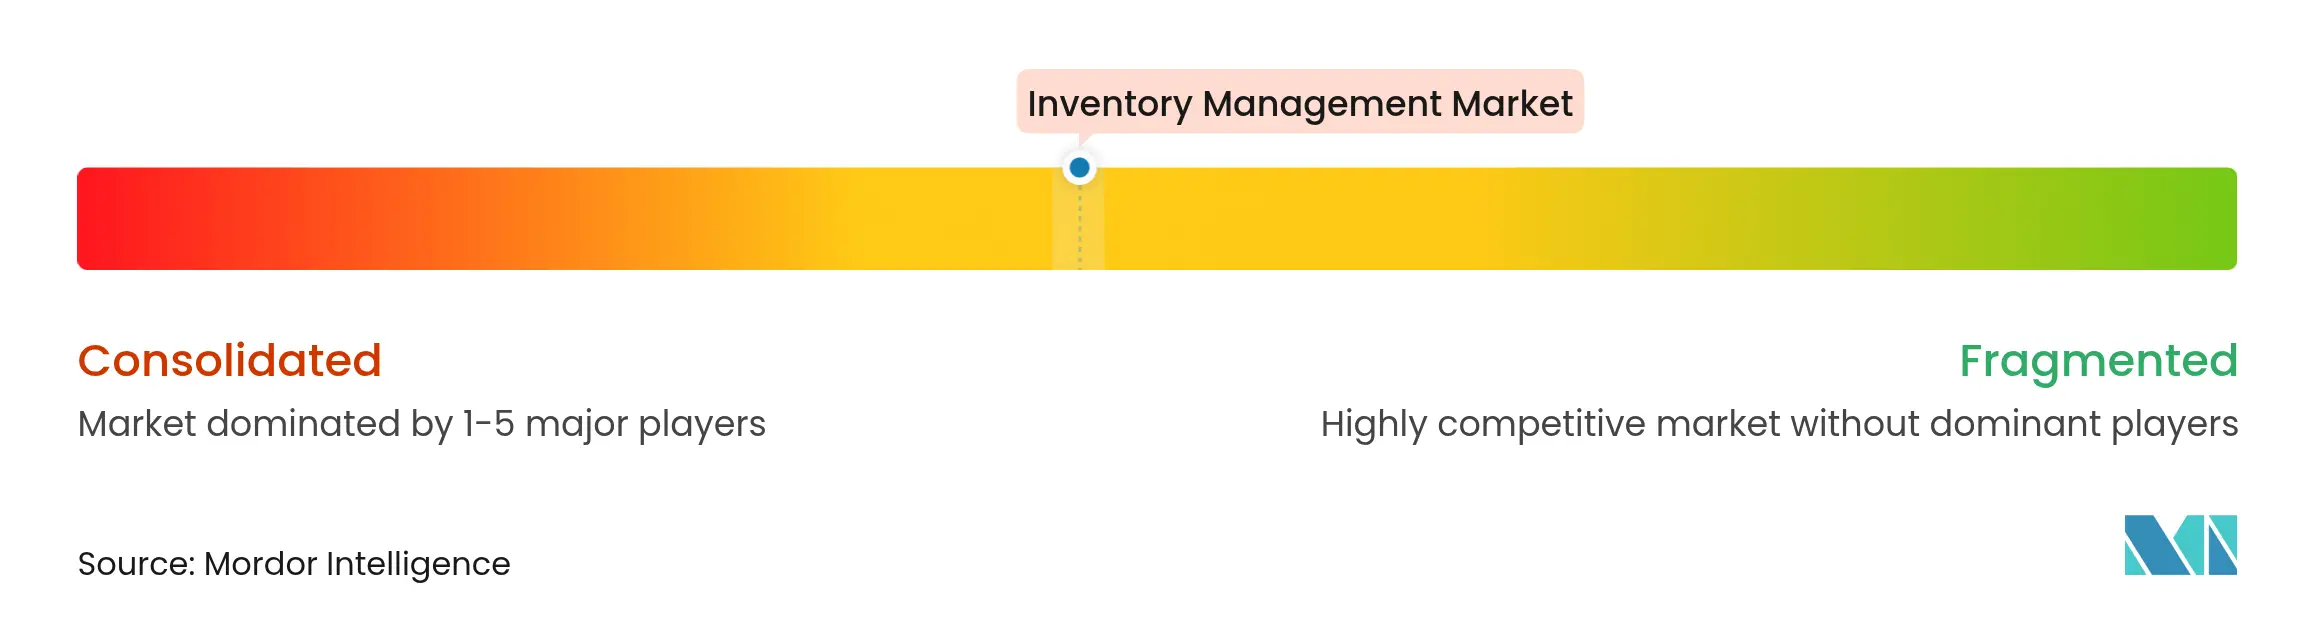
| Market Concentration | Medium |
Major Players *Disclaimer: Major Players sorted in no particular order. Image © Mordor Intelligence. Reuse requires attribution under CC BY 4.0. |
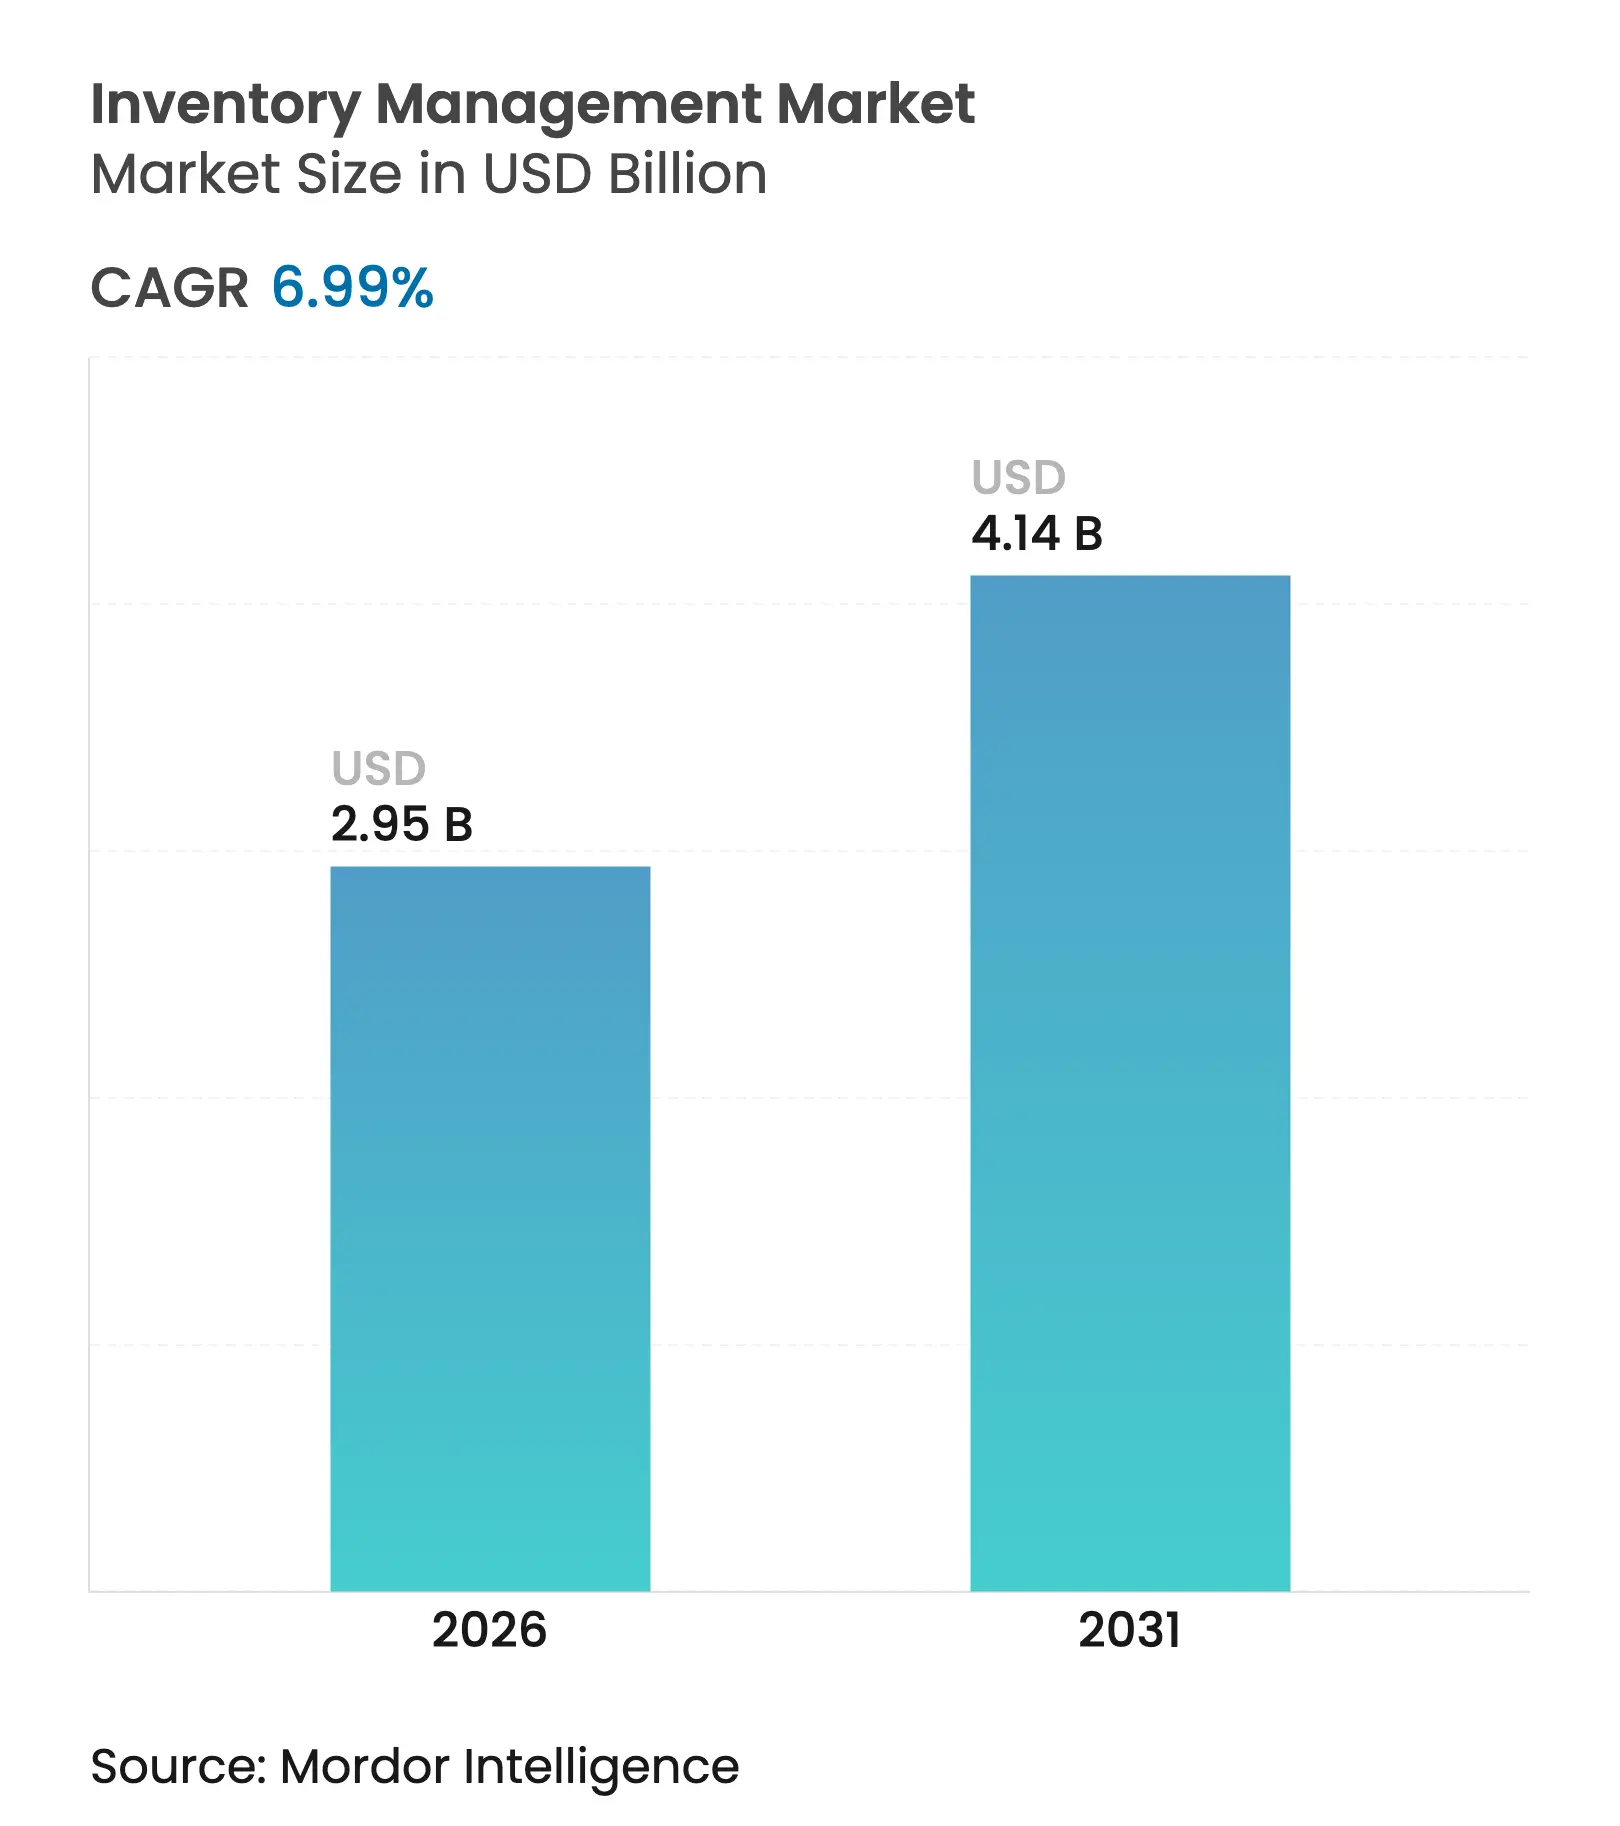
The inventory management market size is expected to grow from USD 2.76 billion in 2025 to USD 2.95 billion in 2026 and is forecast to reach USD 4.14 billion by 2031 at 6.99% CAGR over 2026-2031. Uptake is accelerating as enterprises digitize replenishment workflows, connect global fulfillment nodes, and harmonize scattered inventory pools. Cloud platforms, AI-enhanced demand sensing, and composable micro-services stacks are reshaping deployment preferences, while Scope-3 emissions mandates are turning real-time inventory visibility into a compliance necessity. Across every end-market, board-level urgency to lower carrying costs and avoid stockouts is translating into sustained investment, particularly as surging SKU counts in omnichannel retail strain legacy systems. Together, these factors position the inventory management market for healthy, broad-based expansion in the current planning horizon.
Key Report Takeaways
Note: Market size and forecast figures in this report are generated using Mordor Intelligence's proprietary estimation framework, updated with the latest available data and insights as of 2026.
Drivers Impact Analysis
| Driver | (~) % Impact on CAGR Forecast | Geographic Relevance | Impact Timeline | |||
|---|---|---|---|---|---|---|
Cloud migration of inventory suites
Cloud migration of inventory suites
| +1.8% | Global, led by North America and Europe | Medium term (2-4 years) |
(~) % Impact on CAGR Forecast
:
+1.8%
|
Geographic Relevance
:
Global, led by North America and Europe
|
Impact Timeline
:
Medium term (2-4 years)
|
Explosive SKU growth from omnichannel retail
Explosive SKU growth from omnichannel retail
| +1.5% | Global, strongest in developed retail markets | Short term (≤ 2 years) | |||
AI-driven demand forecasting accuracy gains
AI-driven demand forecasting accuracy gains
| +1.2% | Asia-Pacific core, spill-over to North America and Europe | Medium term (2-4 years) | |||
Emergence of composable micro-services stacks
Emergence of composable micro-services stacks
| +0.9% | North America and EU; early uptake across Asia-Pacific | Long term (≥ 4 years) | |||
Corporate Scope-3 mandates
Corporate Scope-3 mandates
| +0.7% | Global, most acute in EU and California | Medium term (2-4 years) | |||
Rising demand for warehouse automation
Rising demand for warehouse automation
| +0.6% | Global, manufacturing-heavy regions prioritized | Long term (≥ 4 years) | |||
| Source: Mordor Intelligence | ||||||
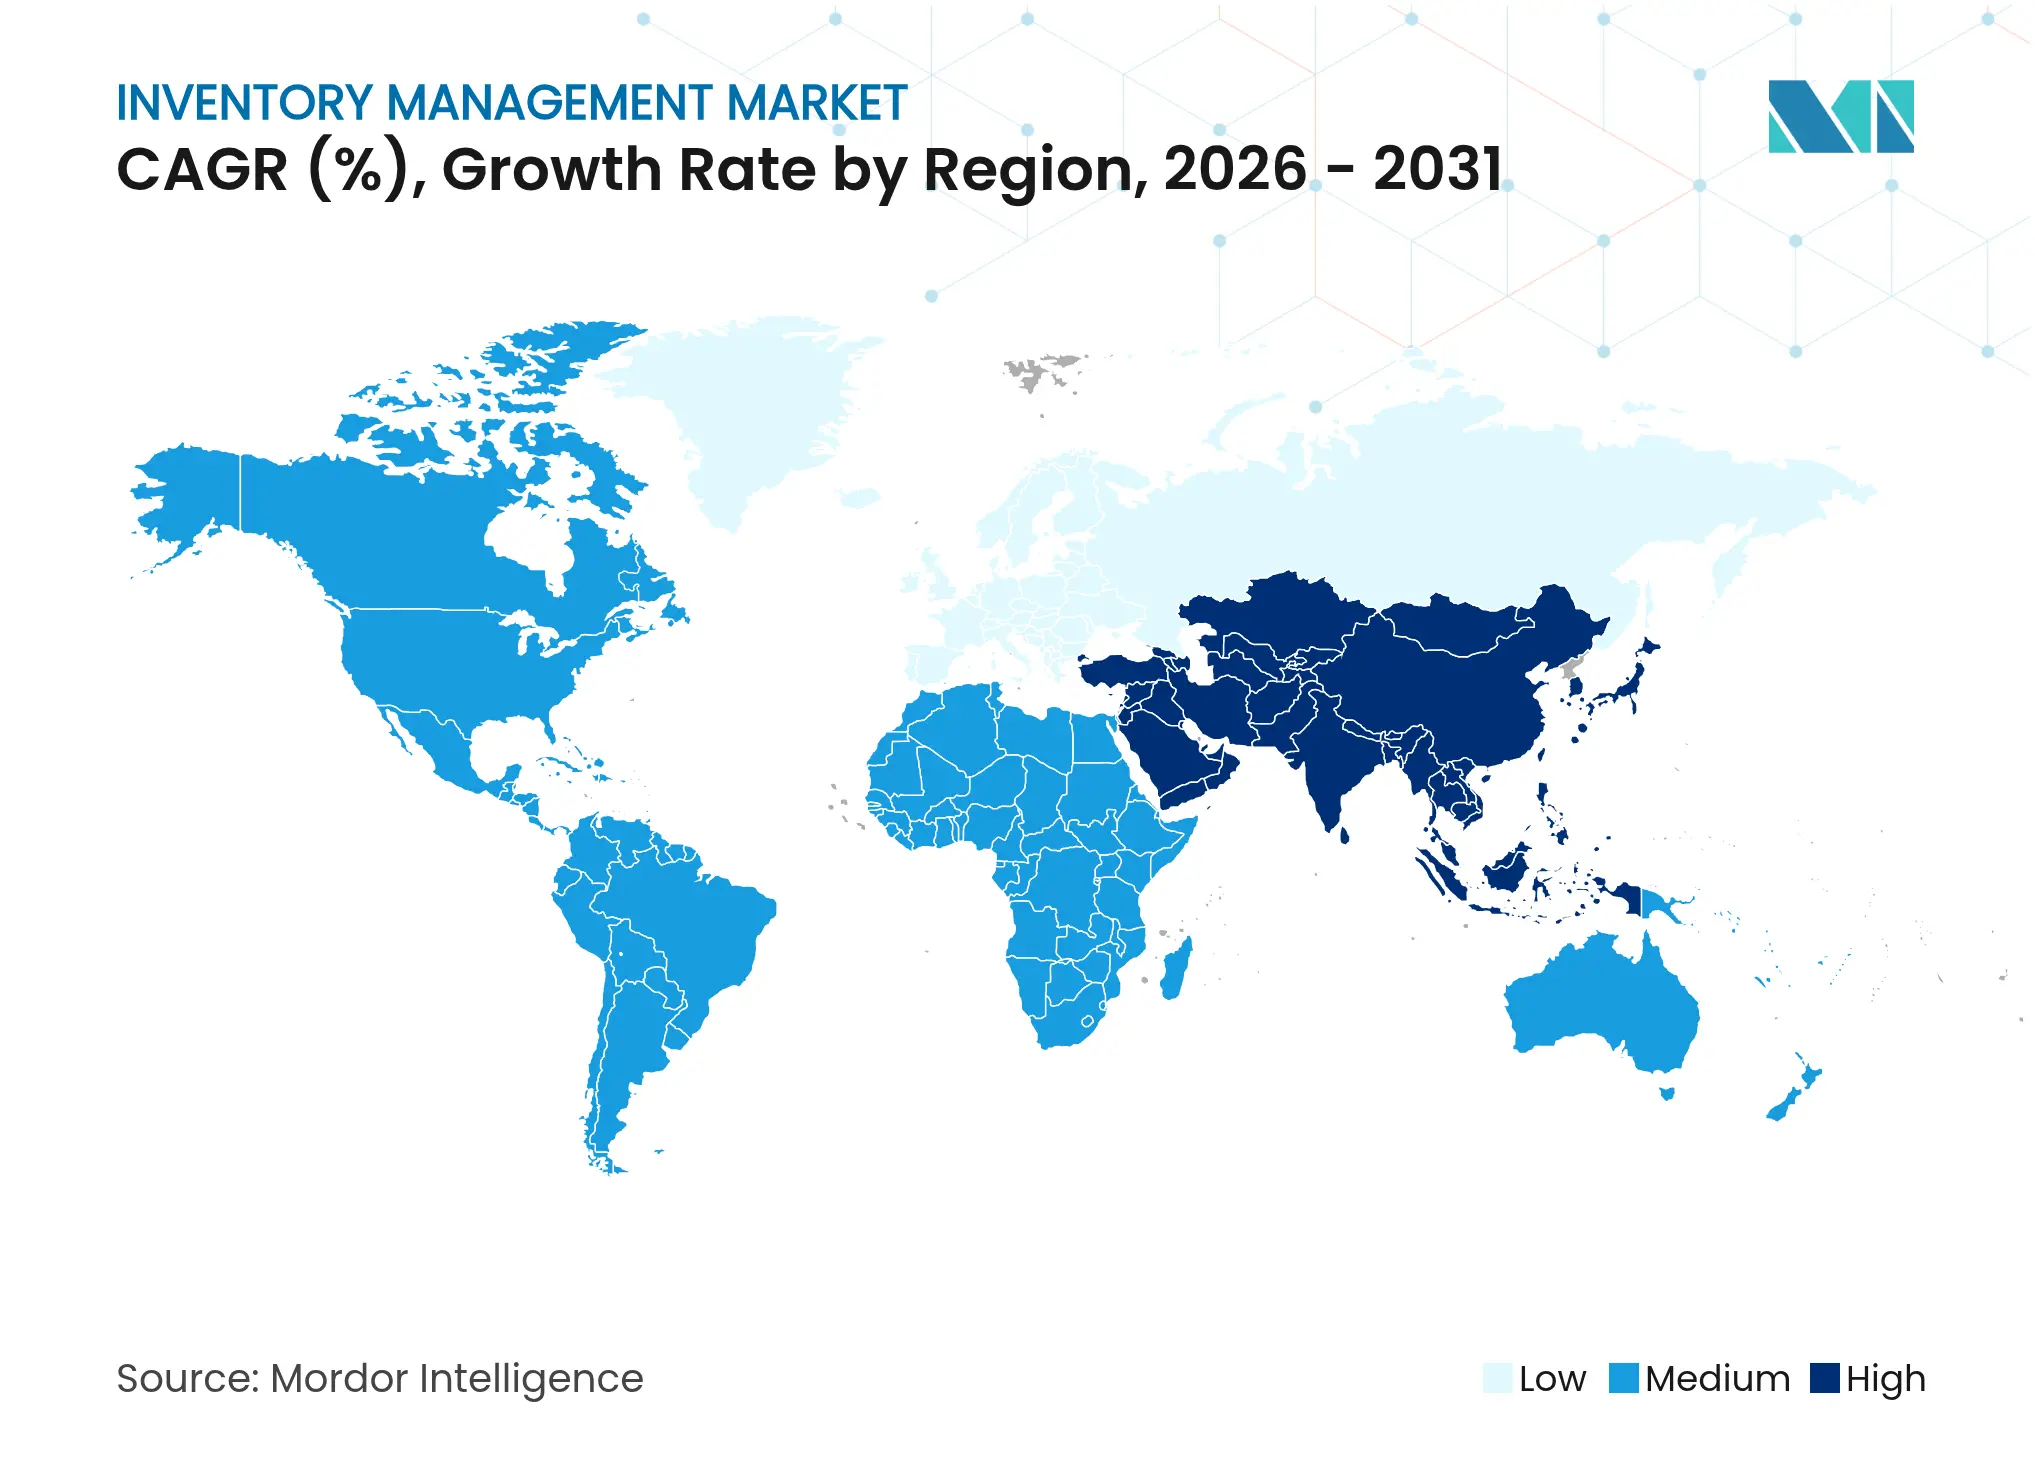
Asia Pacific is Expected to Witness a High Market Growth Rate
Enterprises increasingly dismantle on-premise inventory platforms in favor of API-first, cloud-native architectures capable of synchronizing global stock positions in near real time. Elastic compute lets planners run fine-grained forecasting models without costly local servers, while shared portals reduce bullwhip effects across supply networks [1]NetSuite, “The real cost of ERP ownership: 2024 survey,” netsuite.com. Transition phases remain complex because legacy systems must co-exist with cloud micro-services, yet firms that complete the journey reap faster update cycles, more frequent security patches, and easier partner integration.
Explosive SKU Growth from Omnichannel Retail
Retailers now juggle tens of thousands of active SKUs spanning stores, e-commerce, and third-party marketplaces. Maintaining service levels without bloating inventory outlays is impossible without multi-objective optimisation engines that weigh lead time, safety stock, and channel priority simultaneously. Retail TouchPoints notes that unified stock pools capable of fulfilling from any node are becoming mainstream, pushing demand for systems that support location-agnostic allocation, real-time ATP (available-to-promise), and granular performance analytics. “Just-right” buffering strategies use AI to modulate replenishment, letting firms redirect goods swiftly when demand surges in one channel and softens in another.
AI-Driven Demand Forecasting Accuracy Gains
Neural networks trained on weather feeds, social sentiment, and macro-economic indicators routinely outperform classical statistical models on Mean Absolute Error and Root Mean Squared Error, boosting accuracy by 10-20 percentage points according to peer-reviewed studies. Multi-level algorithms project demand at SKU, family, and category layers concurrently, enabling precise reorder-point tuning even for volatile promotional items. Emerging agentic AI components autonomously adjust safety-stock targets and reorder triggers, freeing planners to focus on exception handling rather than manual adjustments.
Emergence of Composable Micro-Services IMS Stacks
Best-of-breed forecasting engines, warehouse control towers, and order-routing services can now be stitched together through RESTful APIs, letting customers avoid lock-in to any single suite. Retail majors have confirmed that decoupled services shorten innovation cycles and accelerate adoption of new technologies such as IoT or blockchain provenance tracking. Data-governance complexity rises under this approach, yet event-driven orchestration layers help ensure the master record stays consistent across modules.
Restraints Impact Analysis
| Restraint | (~) % Impact on CAGR Forecast | Geographic Relevance | Impact Timeline | |||
|---|---|---|---|---|---|---|
High upfront integration costs
High upfront integration costs
| -1.1% | Global, greatest for mid-market firms | Short term (≤ 2 years) |
(~) % Impact on CAGR Forecast
:
-1.1%
|
Geographic Relevance
:
Global, greatest for mid-market firms
|
Impact Timeline
:
Short term (≤ 2 years)
|
Change-management complexity
Change-management complexity
| -0.6% | Global, acute in diversified enterprises | Short term (≤ 2 years) | |||
Cyber-security risks
Cyber-security risks
| -0.8% | Global, amplified in regulated verticals | Medium term (2-4 years) | |||
Data-sovereignty regulations
Data-sovereignty regulations
| -0.5% | EU, LATAM, and Asia-Pacific states with strict residency rules | Medium term (2-4 years) | |||
| Source: Mordor Intelligence | ||||||
High Upfront Integration Costs
Total cost of ownership often equals 3-5% of annual revenue for mid-size companies, driven by data migration, testing, and end-user training requirements. The skills gap is widening: Supply Chain Brain reports that 52% of enterprises struggle to hire supply-chain analytics talent, extending project timelines and inflating consulting fees.
Cyber-Security Risks
Ivanti’s 2024 warehouse survey found 32% of professionals flag social engineering as the primary attack vector, yet only 58% of managers prioritize cyber-security investments. API-rich architectures introduce more potential entry points, while data-residency mandates compel firms to split workloads across regional clouds, complicating threat-monitoring and patch governance.
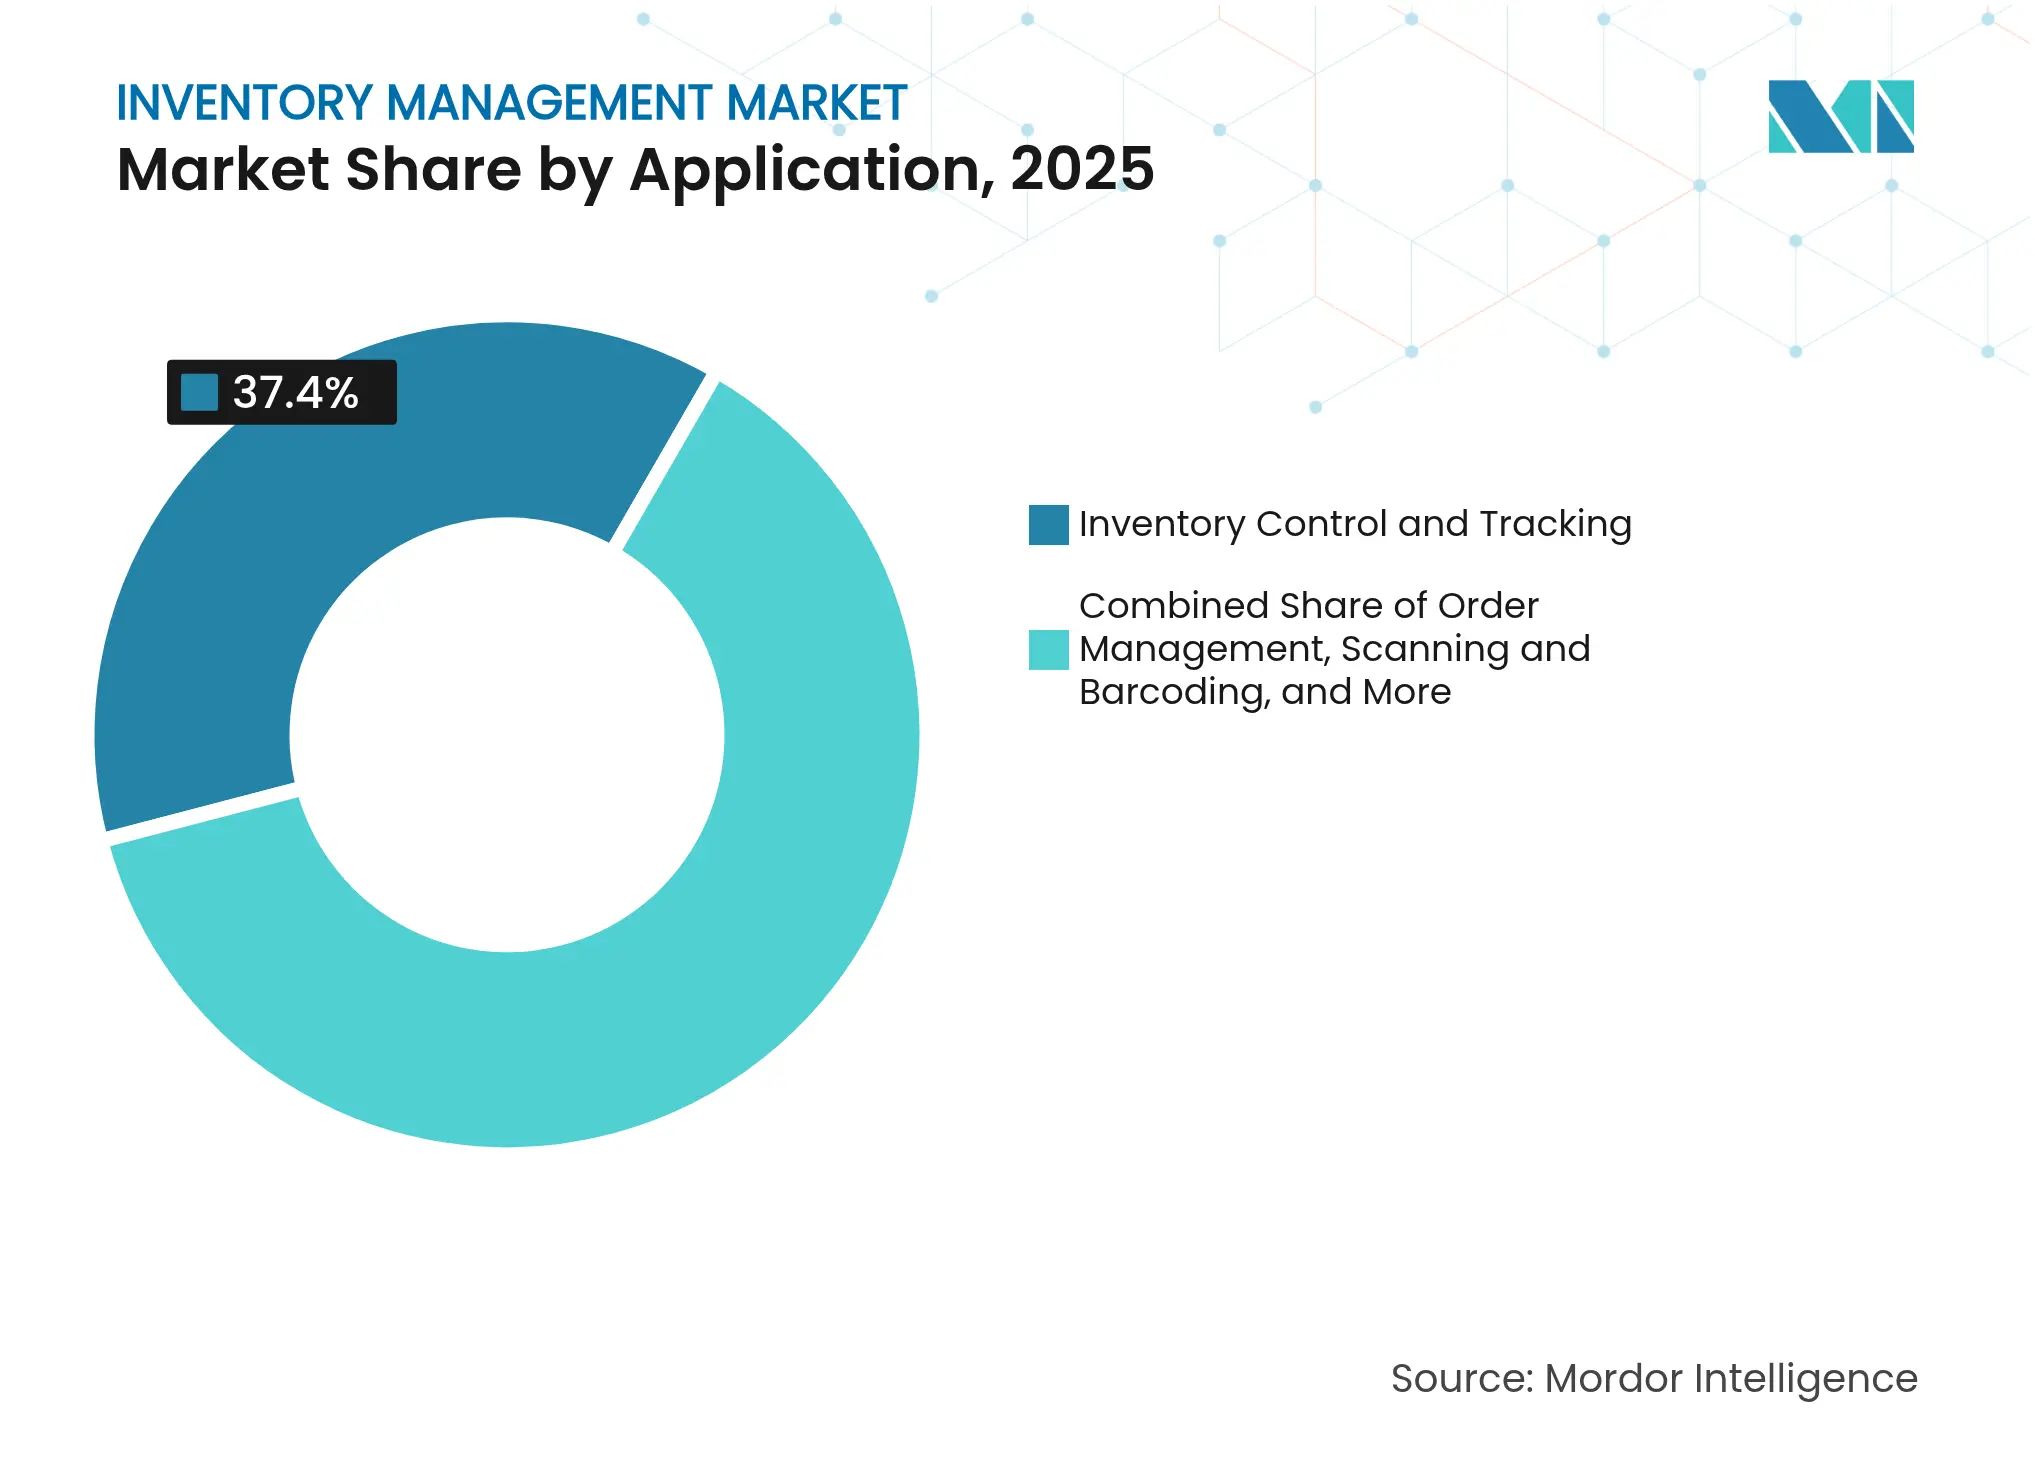
By Application: Control Systems Drive Market Foundation
Inventory control and tracking platforms captured 37.40% of the inventory management market in 2025, reflecting their indispensability for stock-ledger accuracy and service-level adherence. These systems sit at the very core of fulfilment execution and feed downstream order-management engines responsible for coordinating customer promises. Control modules integrate barcode scanners, RFID gateways, and IoT beacons, allowing planners to reconcile physical movement with system records continuously. Order-management layers orchestrate reservations, back-orders, and split shipments across mixed channels, while scanning infrastructure supplies the real-time telemetry that underpins everything else. Asset management, though smaller, is pacing at a 12.18% CAGR; demand stems from manufacturers and field-service operators that need to track tools, returnable containers, and high-value spares. The convergence of RFID and low-power Bluetooth tags enables automated, non-line-of-sight logging, eliminating manual counts and theft risk.
Companies migrating to unified platforms merge these sub-applications, reducing duplicate data entry and accelerating reconciliation cycles. Add-on modules for lot control, expiry tracking, and compliance reporting gain traction in regulated verticals where audit trails are mandatory. As scanning infrastructure fuses with real-time locating systems, the boundary between warehouse control and asset visibility blurs, pushing vendors to deliver holistic dashboards that surface on-hand, in-transit, and work-in-process data side by side.
Note: Segment shares of all individual segments available upon report purchase
By Deployment Mode: Cloud Architectures Reshape Operations
Cloud deployments commanded 61.20% of the inventory management market share in 2025 and are climbing at a 13.95% CAGR, signaling that hosted delivery has moved from experimental to default. The enormous uptick reflects faster time-to-value, subscription pricing that mirrors cash flow, and automatic upgrade paths that small IT teams can handle. Hybrid models remain common whenever data-sovereignty or low-latency warehouse-control considerations apply. Vendors now respond with regionally segmented sovereign clouds that replicate public-cloud economics while remaining under local jurisdiction.
On-premise deployments persist in defense, aerospace, and certain public-sector warehouses, where facilities depend on air-gapped networks. Yet even these environments frequently bolt on cloud-based demand-sensing or vendor-managed-inventory portals, underscoring an inexorable drift toward connectivity. Continuous delivery pipelines mean cloud tenants receive weekly algorithm tweaks, patching vulnerabilities before hackers can exploit them, and a growing roster of self-service APIs widens the integration funnel without bespoke middleware.
By End-user Enterprise Size: SMEs Accelerate Digital Adoption
Large enterprises held 54.30% of revenue in 2025 thanks to global rollouts spanning distribution-center networks, yet small and medium enterprises are expanding at a 12.85% CAGR. The driver is twofold: simplified implementation templates reduce consulting hours, and embedded AI features automate complexity away from non-technical users. Low-code configuration and guided workflows let SME planners launch statistical forecasts without hiring data scientists, while subscription tiers align platform capability with business maturity. Skills shortages complicate large-enterprise initiatives as well, prompting them to outsource algorithm-maintenance or adopt managed-services overlays that assure model performance and KPI tracking.
Despite budget constraints, SMEs increasingly insist on end-to-end visibility, because e-commerce exposes them to global buyers who expect Amazon-like transparency. Solutions vendors accommodate by bundling much of the advanced math into templated “industry packs” that pre-tune reorder-point strategies for fashion, consumer-packaged goods, and industrial spare-parts categories. As a result, the inventory management market grows evenly across company sizes rather than relying on marquee mega-projects alone.

Recognized by Experts. Trusted by Leaders.
A trusted intelligence partner to global decision-makers across 90+ countries.


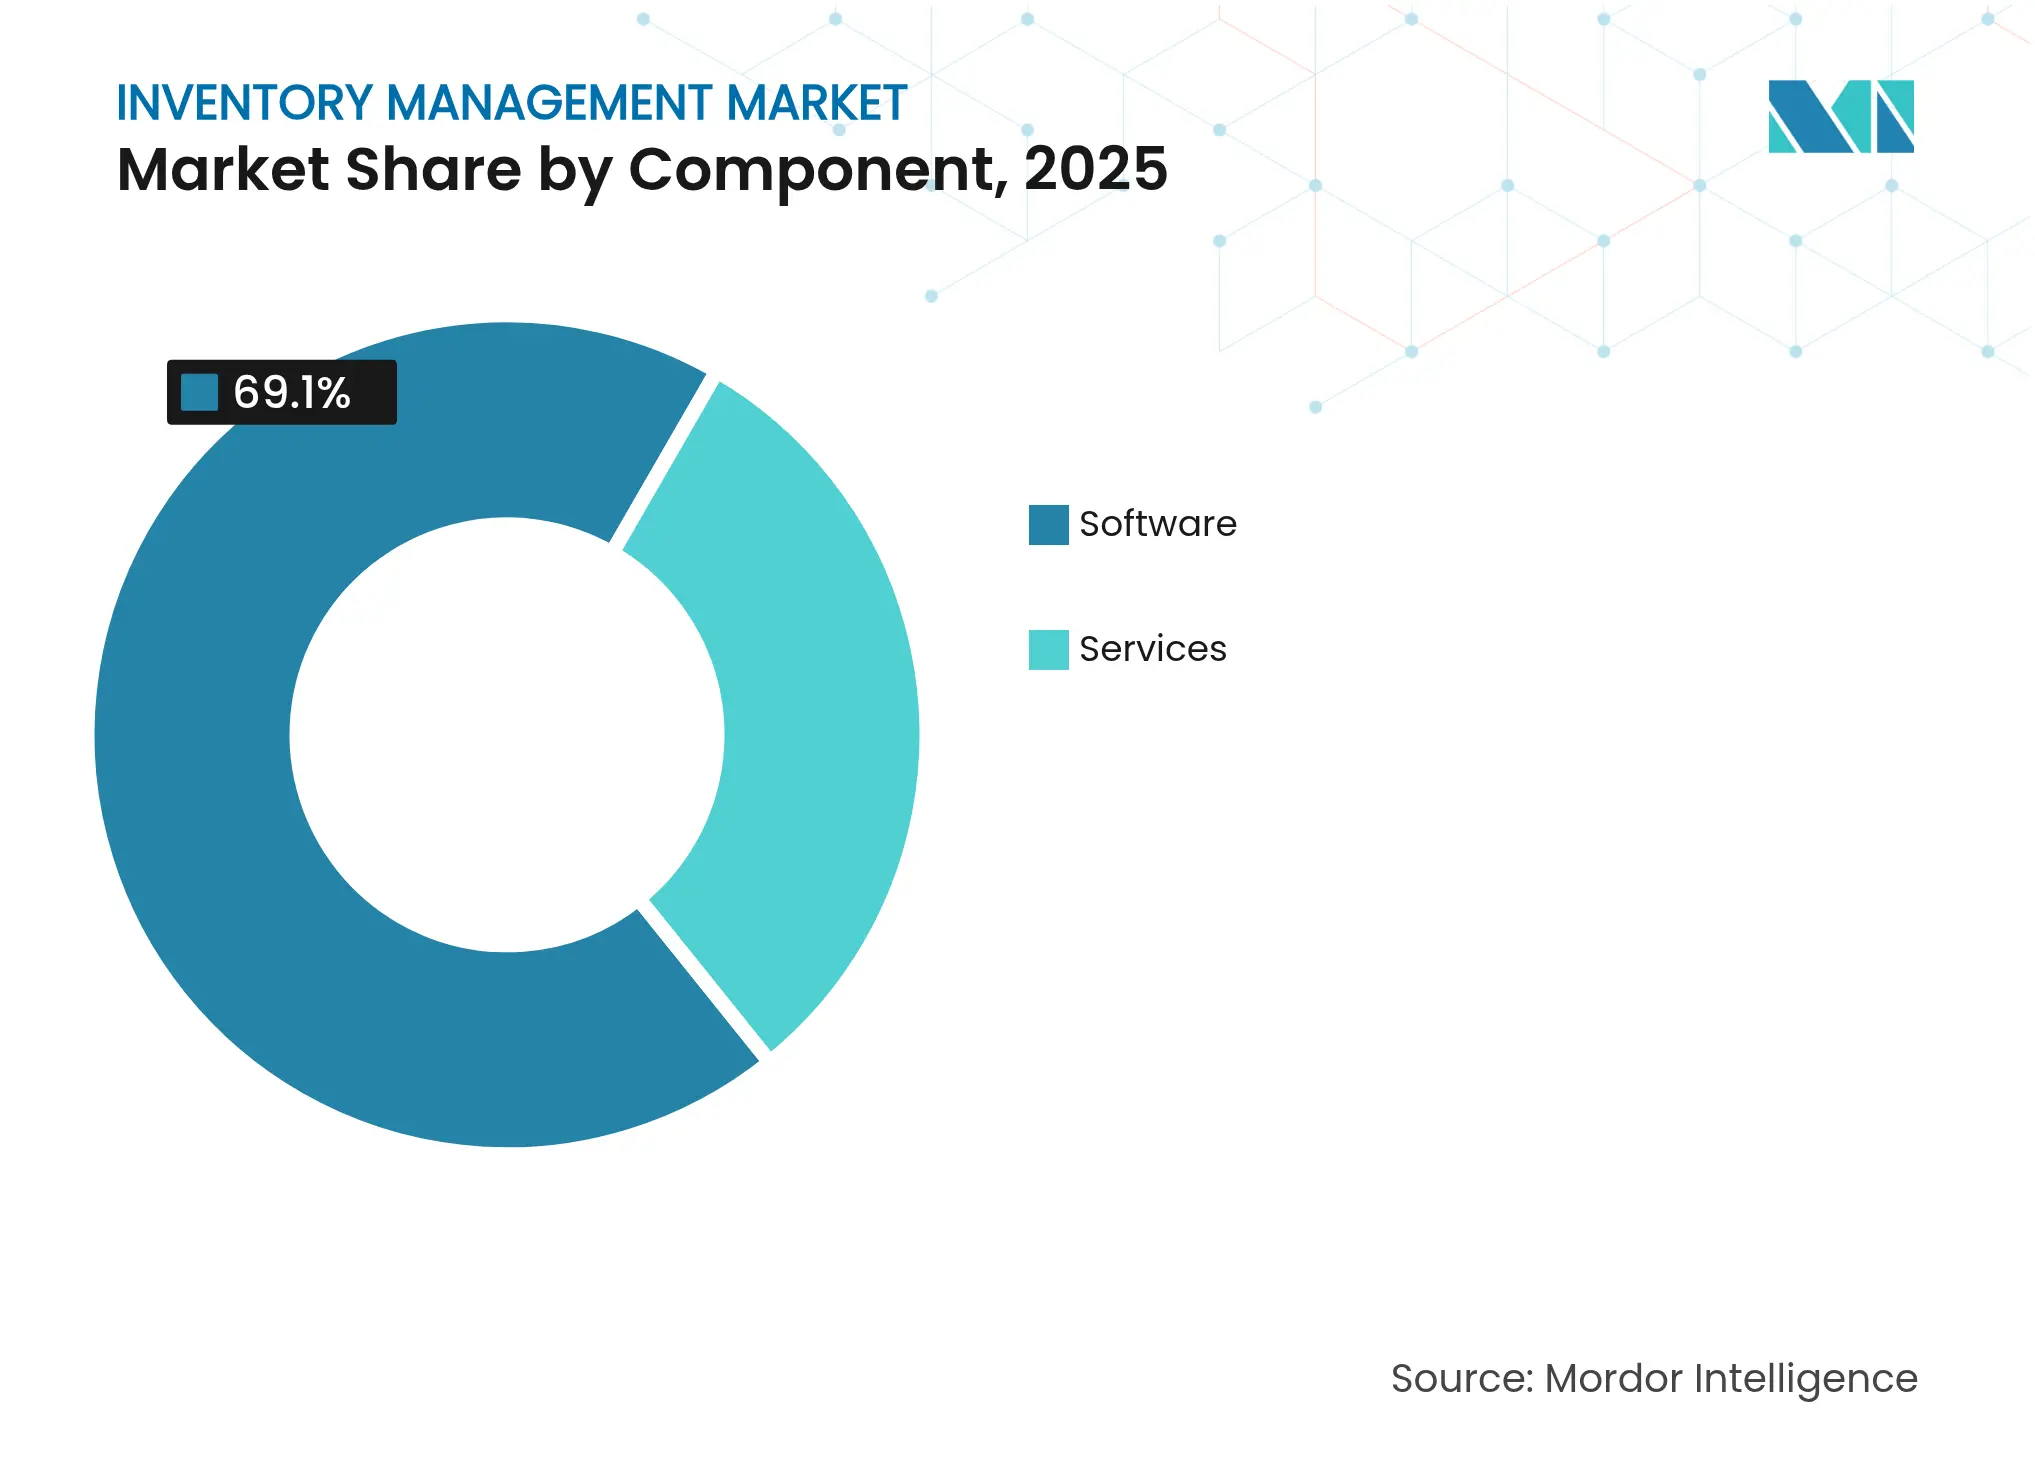
By Component: Services Bridge Implementation Gaps
Software elements represented 69.10% of the inventory management market size in 2025, yet services—implementation, integration, managed support—are advancing at an 11.59% CAGR. Enterprises lean on specialists to choreograph complex data migration, cleanse legacy records, and deploy middleware that federates warehouse management, order entry, and merchandising systems. AI-centric deployments extend service scope because algorithms require continuous retraining to cope with seasonality, promotions, and product rollouts. Vendors respond with analytics-as-a-service retainers that guarantee forecast-error ceilings and deliver dashboards benchmarking on-shelf availability at peer-group level.
Managed services find eager buyers among firms with thin IT benches; providers run the platform, tweak models, and troubleshoot interface messages 24/7. Advisory engagements also surge around change-management: training floor managers to trust machine-generated reorder proposals and embedding new processes into standard operating procedures. As talent bottlenecks persist, service partners position themselves not just as implementers but as long-term stewards of inventory performance.
Note: Segment shares of all individual segments available upon report purchase
By End-User Industry: E-Commerce Transforms Retail Dynamics
Retail owned 27.60% of revenue in 2025 because bricks-and-clicks players pioneered precise, location-level stock visibility to enable buy-online-pick-up-in-store. Yet pure-play e-commerce and marketplace operators should post a 14.65% CAGR to 2031, driven by marketplace expansions into groceries, personal-care, and bulky goods that need regional micro-fulfillment. Manufacturers prize work-in-process tracking across assembly lines, while logistics providers focus on in-transit inventory to shrink detention charges and detention-related carbon emissions.
Healthcare organisations pursue expiry management and patient-safety compliance, requiring systems that track batch, lot, and temperature exposure. Food and beverage processors adopt full farm-to-fork traceability to prove sustainability claims and comply with evolving labeling laws in the United States and European Union. Automotive and aerospace sectors rely on serialized component histories to streamline recalls and warranty settlement, embedding inventory management inside broader product-lifecycle systems.
North America dominated with 34.70% revenue in 2025, underpinned by widespread adoption of cloud inventory platforms and aggressive investment in warehouse automation. United States retailers integrate real-time store inventory with last-mile delivery networks to guarantee same-day or curbside pickup, while Canadian manufacturers deploy digital twins of production lines to fine-tune replenishment cycles. Mexico’s maquiladora corridor modernises cross-border inventory flows, leveraging unified portals that show U.S. customers stock levels at Mexican plants without exposing proprietary cost data. Regulatory variation across state lines still complicates data-privacy compliance, prompting vendors to offer granular policy-based access control within multi-tenant clouds.
Asia-Pacific is forecast to achieve a 13.32% CAGR to 2031, propelled by e-commerce proliferation and government-backed smart-manufacturing programs. Chinese manufacturers embed sensors at each workstation, feeding cloud planning engines that auto-generate kanban replenishment orders. Indian retailers adopt cloud inventory suites via mobile-first interfaces, increasing assortment depth without risking outsized stock-outs. Japan and South Korea push the technological frontier with autonomous forklifts and goods-to-person robots, exporting best-practice playbooks to Southeast Asian peers . Fragmented infrastructure and uneven broadband coverage still slow rural deployments, yet mobile networks deliver sufficient bandwidth for smartphone-based stock updates, driving leapfrog adoption patterns.
Europe presents both opportunity and complexity: sustainability mandates and data-privacy rules create immediate demand for granular inventory visibility, but compliance constraints delay full-cloud migrations in highly regulated sectors. The region's focus on Scope-3 emissions reporting is creating demand for inventory management systems that can provide granular visibility into supply chain carbon footprints and support decarbonization initiatives . German industry turns to edge gateways that buffer machine sensor data locally before uploading summaries to the cloud, respecting data-sovereignty laws. United Kingdom grocers leverage AI-driven prediction to cut fresh-produce waste, aligning with net-zero pledges, while Italian luxury brands deploy RFID for item-level tracking to combat counterfeits and support omnichannel showrooming experiences. Vendors differentiate by packaging carbon-ledger modules that calculate emissions at SKU-movement granularity, meeting Scope-3 reporting duties without forcing customers to export data to third-party calculators.
Market Concentration
The inventory management market remains moderately concentrated, with enterprise-suite heavyweights contending alongside niche specialists and born-in-cloud disruptors. SAP, Oracle, and Microsoft leverage expansive ERP ecosystems, embedding inventory functions inside broader finance and procurement suites to lock in data continuity and drive cross-module upsell. Manhattan Associates, Blue Yonder, and HighJump go deep into warehouse orchestration and order routing, often partnering with automation vendors to supply the software brains behind robotic fulfilment cells.
Composable architectures shift the battleground toward open APIs: customers now expect pre-built connectors to adjacent platforms—commerce fronts, transport-management, supplier portals—rather than monolithic, code-level integrations. IBM’s 2024 acquisition of Accelalpha underscores rising demand for services talent that can harmonize Oracle inventory modules with third-party analytics environments. SAP’s February 2025 launch of Business Data Cloud demonstrates the push to layer unified semantic models across operational systems, simplifying AI projects that need consistent data structures. Smaller players exploit these openings by offering plug-and-play demand-sensing engines or AI co-pilots that integrate within days.
Cyber-security emerges as a brand differentiator: vendors now tout zero-trust architectures, SOC 2 certifications, and real-time anomaly detection to reassure risk-averse buyers. Pricing competition intensifies as subscription tiers proliferate, but value-added services—algorithm-maintenance, carbon-ledger reporting, machine-learning feature stores—provide higher-margin revenue. Market-share shifts will hinge on ecosystem strategy: suppliers that cultivate integrator alliances and marketplace listings will outpace rivals trapped in proprietary silos.

*Disclaimer: Major Players sorted in no particular order
1. INTRODUCTION
2. RESEARCH METHODOLOGY
3. EXECUTIVE SUMMARY
4. MARKET LANDSCAPE
5. MARKET SIZE AND GROWTH FORECASTS (VALUE)
6. COMPETITIVE LANDSCAPE
7. MARKET OPPORTUNITIES AND FUTURE TRENDS
Market Definitions and Key Coverage
Segmentation Overview
Detailed Research Methodology and Data Validation
Primary Research
Desk Research
Market-Sizing & Forecasting
Data Validation & Update Cycle
Why Mordor's Inventory Management Baseline Earns Confidence
Benchmark comparison
| Market Size | Anonymized source | Primary gap driver | ||
|---|---|---|---|---|
USD 2.76 B | Mordor Intelligence | - | Anonymized source:Mordor Intelligence | Primary gap driver:- |
USD 3.74 B | Global Consultancy A | Includes ancillary SCM modules and on-prem integration services | ||
USD 2.51 B | Industry Analyst Firm B | Uses vendor revenue aged to 2023 and linear growth assumption |
Pricing Strategy for Semiconductor Components
3 Min Read
Accelerating Additive Manufacturing Adoption in India
3 Min Read
Unlocking Saudi Arabia’s Regional Tourism Growth Potential
5 Min Read
When decisions matter, industry leaders turn to our analysts. Let’s talk.