Projection Mapping Market Size and Share
Market Overview
| Study Period | 2020 - 2031 |
|---|---|
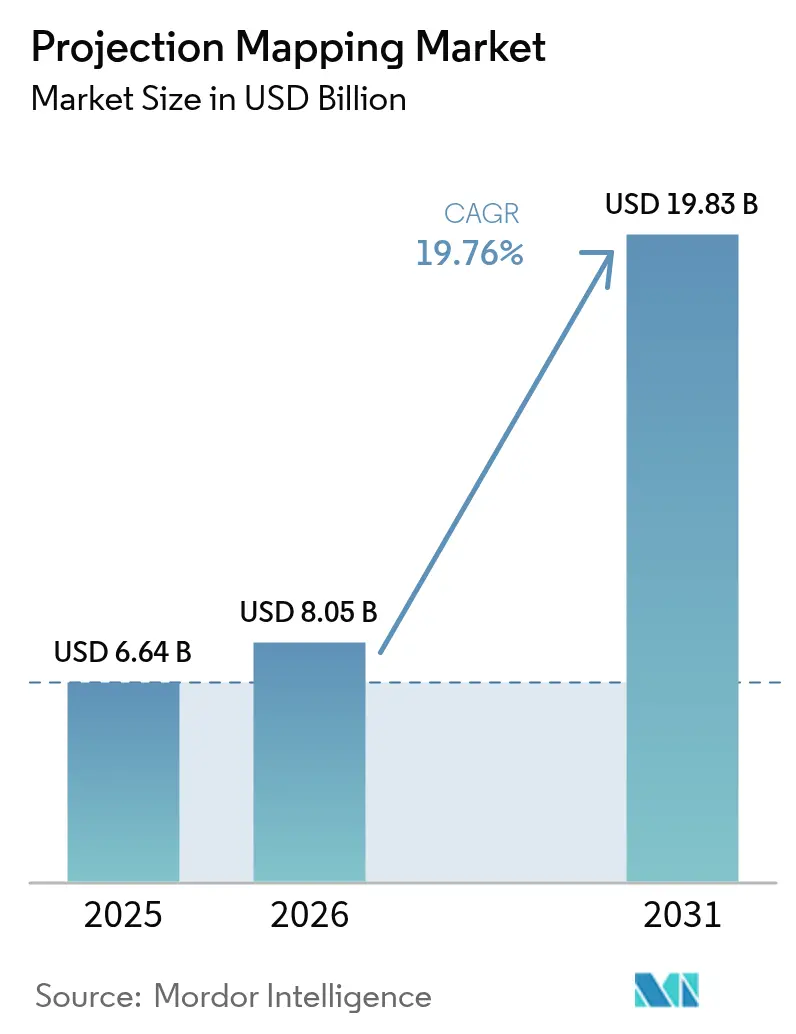
| Market Size (2026) | USD 8.05 Billion |
| Market Size (2031) | USD 19.83 Billion |
| Growth Rate (2026 - 2031) | 19.76% CAGR |
| Fastest Growing Market | Asia Pacific |
| Largest Market | North America |
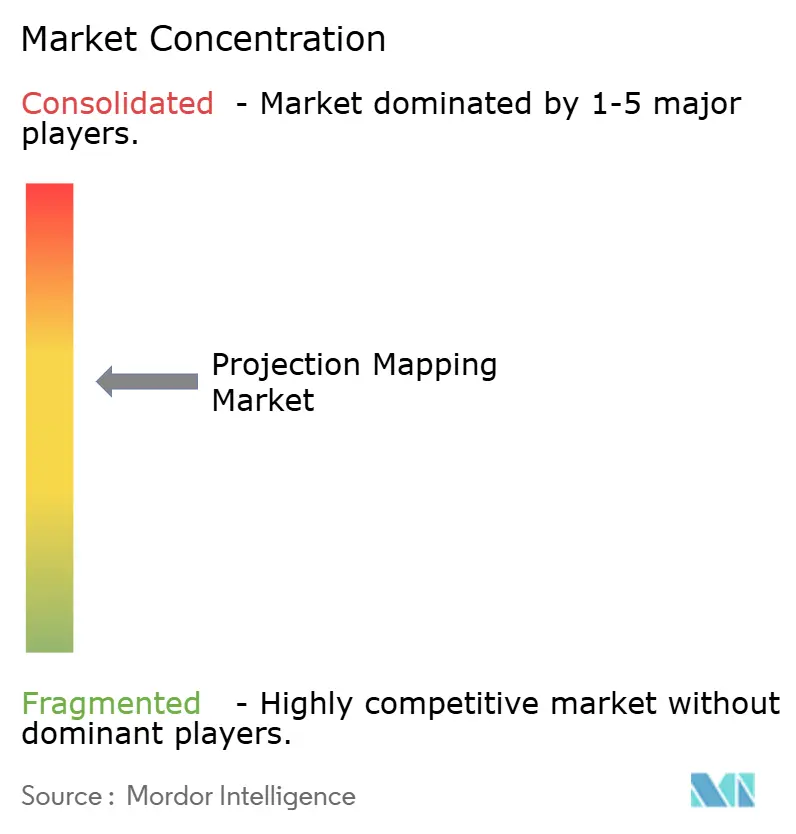
| Market Concentration | Medium |
Major Players *Disclaimer: Major Players sorted in no particular order Image © Mordor Intelligence. Reuse requires attribution under CC BY 4.0. | |
Projection Mapping Market Analysis by Mordor Intelligence
The projection mapping market size is projected to expand from USD 6.64 billion in 2025 and USD 8.05 billion in 2026 to USD 19.83 billion by 2031, registering a CAGR of 19.76% between 2026 to 2031. Widespread adoption of high-brightness laser projectors, falling cost-per-lumen metrics, and real-time generative-AI content workflows are accelerating deployments across civic landmarks, theme parks, and retail flagships. Municipal smart-city programs in Japan, Saudi Arabia, and the UAE are reclassifying projection mapping as permanent infrastructure, assured of predictable tourism dividends and lower on-site labor enabled by camera-based auto-calibration. Brands are reallocating advertising budgets toward immersive façade takeovers that deliver social-media amplification ratios exceeding 15:1, outpacing static LED in narrative depth and memorability. Hardware vendors now bundle cloud content platforms that monitor uptime and energy consumption, creating recurring service revenue and reducing projector downtime by up to 50%.
Key Report Takeaways
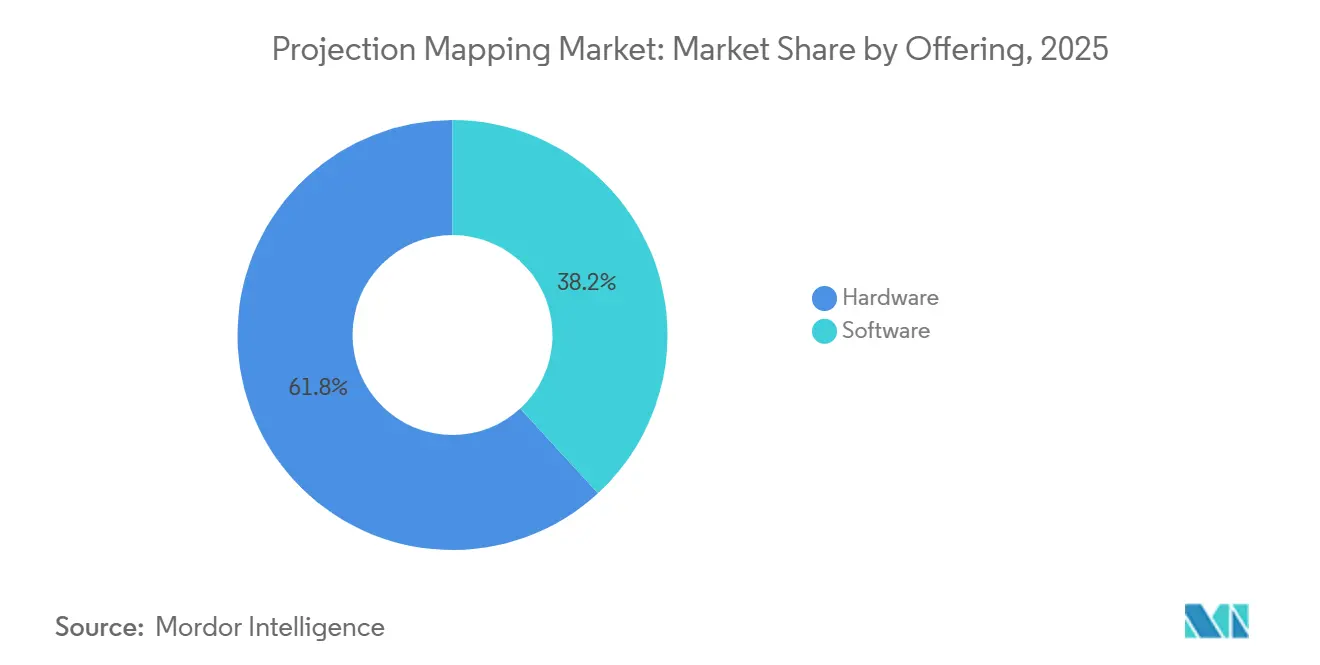
- By offering, hardware commanded 61.83% projection mapping market share in 2025, whereas software is projected to register the fastest 21.11% CAGR through 2031.
- By dimension, 3D led with 55.72% share in 2025 while 4D and immersive formats are forecast to expand at a 20.82% CAGR to 2031.
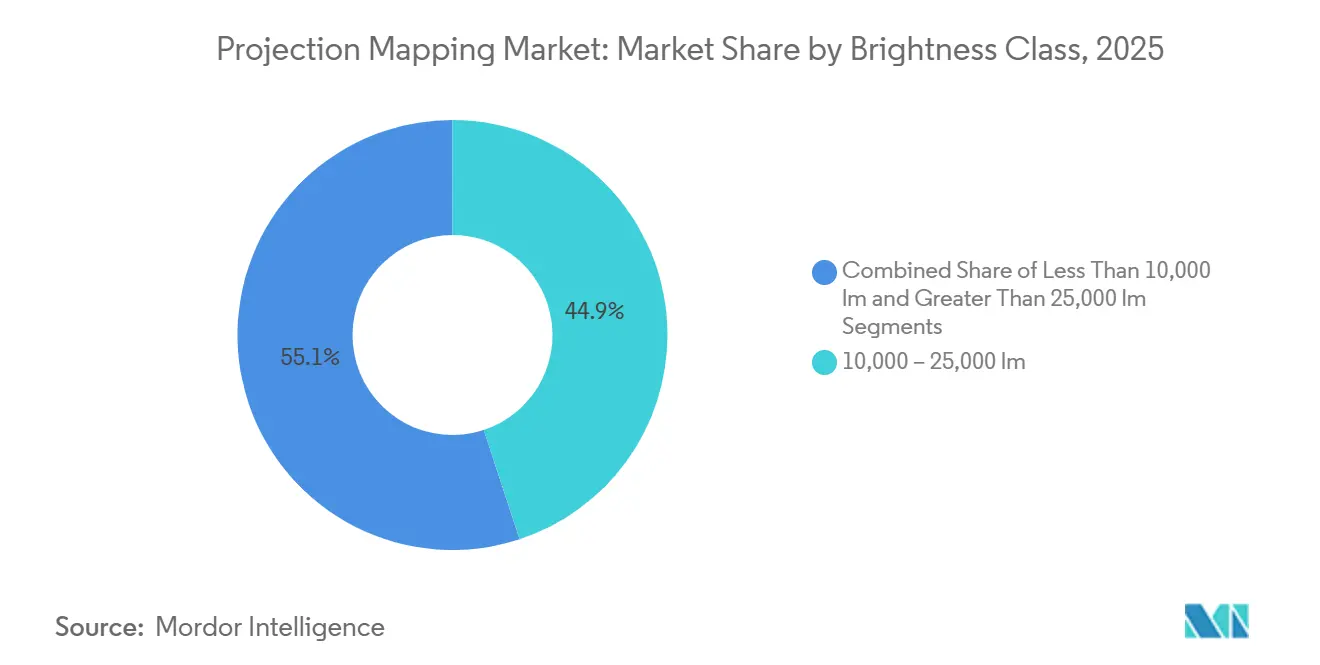
- By brightness class, the 10,000-25,000 lumen band held 44.94% projection mapping market share in 2025, and projectors above 25,000 lumens are set to grow at a 19.96% CAGR during 2026-2031.
- By projection technology, DLP retained 51.64% share in 2025 and LCD is positioned for a 20.41% CAGR through 2031.
- By mapping surface, building façades accounted for 40.86% of the projection mapping market size in 2025, whereas objects and products will rise fastest at a 20.57% CAGR up to 2031.
- By application, large venues and façades contributed 35.88% revenue in 2025, while cultural and heritage sites are anticipated to advance at a 20.92% CAGR over the forecast period.
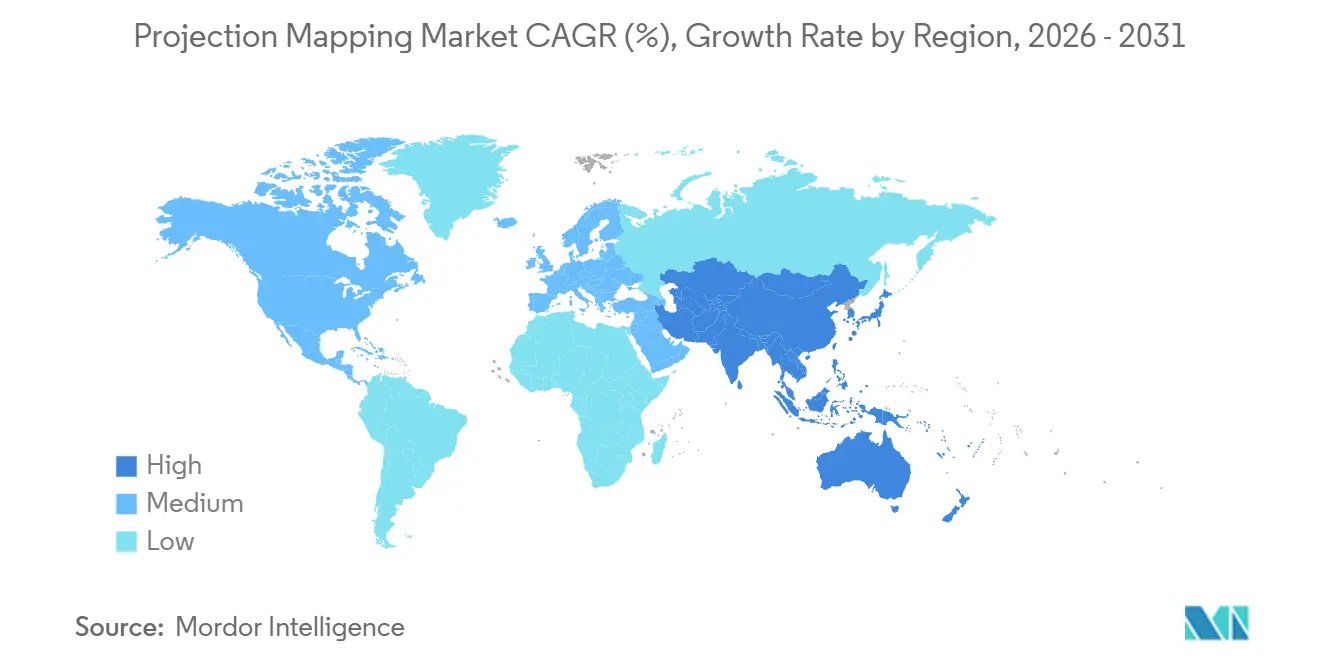
- By geography, North America led with 33.57% share in 2025, whereas Asia-Pacific is poised for the strongest regional expansion at a 21.66% CAGR through 2031.
Note: Market size and forecast figures in this report are generated using Mordor Intelligence’s proprietary estimation framework, updated with the latest available data and insights as of 2026.
Global Projection Mapping Market Trends and Insights
Drivers Impact Analysis*
| Driver | (~) % Impact on CAGR Forecast | Geographic Relevance | Impact Timeline |
|---|---|---|---|
| Immersive Advertising and Live-Event Experiences | +3.2% | Global, with concentration in North America, Europe, Asia-Pacific urban centers | Short term (≤ 2 years) |
| High-Brightness Laser Projectors Adoption | +2.8% | Global, led by North America and Middle East for outdoor permanent installations | Medium term (2-4 years) |
| Smart-City Landmark Illumination Programs | +3.5% | Asia-Pacific (Japan, China, South Korea), Middle East (UAE, Saudi Arabia), Europe (Spain, France) | Medium term (2-4 years) |
| Declining Cost-Per-Lumen from RGB Laser Engines | +2.9% | Global, accelerating adoption in price-sensitive markets (India, Southeast Asia, Latin America) | Long term (≥ 4 years) |
| Real-Time Generative-AI Content Workflows | +3.1% | North America and Europe early adopters, Asia-Pacific following | Short term (≤ 2 years) |
| XR Stage Demand for Complementary Mapping | +2.4% | North America (Hollywood, Vancouver), Europe (UK, Germany), Asia-Pacific (South Korea) | Medium term (2-4 years) |
| Source: Mordor Intelligence | |||
Immersive Advertising And Live-Event Experiences
Brands are shifting spend from static billboards to façade takeovers that generate superior engagement metrics and large volumes of user-generated social content.[1]AVIXA, “Japan’s Largest Video Mapping Event of 2025,” AVIXA.ORG Coca-Cola’s Piccadilly Lights activation and Adidas’s Oxford Street wrap proved that storytelling across complex surfaces matches LED cost-per-impression while delivering cinematic depth. Theme parks duplicate the approach; Universal Orlando Resort’s CineSational show extended average guest dwell time by 22 minutes, directly lifting food-and-beverage sales. Stadium corridors now feature interactive projections that convert circulation space into sponsorable media, while free-admission festivals in Japan demonstrate sponsorship-led monetization models. Permanent installations benefit from lower per-event setup costs, improving ROI over multiyear cycles.
High-Brightness Laser Projectors Adoption
RGB laser engines exceeding 25,000 lumens provide 20,000-hour lifespans, slashing maintenance visits and enabling unmanned rooftop arrays.[2]Panasonic Holdings Corporation, “Panasonic in Numbers: Permanent Projection Mapping Display,” PANASONIC.COM Panasonic’s PT-RQ50K series covers 13,905 square meters on the Tokyo Metropolitan Government Building and operates nightly without on-site staff. Christie Digital deploys 45,000-lumen models in arenas where daylight readability was once impossible with lamp-based units. The laser price premium has narrowed to 1.8×, and total cost of ownership now favors laser in five-year models. Middle East megaprojects specify laser-only procurement to contain ten-year service budgets.
Smart-City Landmark Illumination Programs
Tokyo’s Night and Light initiative attracted 450,000 visitors within a year, adding USD 12 million to nearby hospitality revenue.[3] Derek Wiley, “Tokyo Government Building Features New Projection Mapping Show,” SVC Online, SVCONLINE.COM Barcelona’s annual Llum BCN festival has institutionalized projection mapping as a winter tourism anchor, drawing city funding for more than 40 sites. Osaka streams civic data feeds onto city-hall façades, illustrating utility beyond entertainment. Saudi Arabia’s NEOM embeds projection mapping in master-plans, with dedicated fiber backhaul for low-latency content delivery. European municipalities align with ISO 50001, demanding adaptive brightness algorithms that trim power during low-footfall hours.
Real-Time Generative-AI Content Workflows
Disguise Designer r24.1 integrates Stable Diffusion and DALL-E to trim animation hours from 300 to 80 for a five-minute show. Unreal Engine and Unity now deliver live edits based on crowd sentiment tracking, while Institute of Science Tokyo demonstrated sub-0.11 millisecond latency facial projection for retail makeup trials. Cosmetics chains piloting the technology report conversion gains of 18-25%. Virtual-production studios combine ceiling projectors with LED volumes, reducing compositing costs by up to 40% and widening access for mid-market museums and event producers.
Restraints Impact Analysis*
| Restraint | (~) % Impact on CAGR Forecast | Geographic Relevance | Impact Timeline |
|---|---|---|---|
| High Up-Front Installation and Content Costs | -2.1% | Global, acute in price-sensitive markets (Latin America, Southeast Asia, Africa) | Short term (≤ 2 years) |
| Complex Site-Specific Calibration Delays | -1.8% | Europe and Asia-Pacific heritage sites, North America historic districts | Medium term (2-4 years) |
| Light-Pollution / Heritage-Facade Regulation | -1.5% | Europe (EU Directive 2024/1619), North America (Dark Sky ordinances), select Asia-Pacific cities | Long term (≥ 4 years) |
| Laser-Diode Supply-Chain Volatility | -1.3% | Global, with acute shortages affecting North America and Europe during semiconductor downturns | Short term (≤ 2 years) |
| Source: Mordor Intelligence | |||
High Up-Front Installation And Content Costs
A permanent civic installation on a 2,500-square-meter façade demands USD 0.8-1.5 million, restricting adoption to municipalities, Fortune 500 brands, and tier-1 museums. Rental deployments cost less but suffer 70-80% idle time, eroding fleet margins. Content creation stays labor-intensive; a 10-minute show can incur USD 40,000-80,000 in creative fees each year. Financing models such as equipment-as-a-service and tourism-tax bonds remain confined to North America and Western Europe. Lack of standardized ROI benchmarks further slows budget approvals in price-sensitive regions.
Complex Site-Specific Calibration Delays
Irregular heritage façades require pixel-level correction that can extend commissioning by up to eight weeks, delaying revenue realization. Camera-based systems reduce alignment time on simple rectangles to hours, yet deep relief surfaces still need iterative night testing. UNESCO guidelines forbid masonry penetrations, necessitating custom rigging that adds months to schedules. Weather windows, technician scarcity, and stringent photometric studies create seasonal bottlenecks, discouraging speculative projects and constraining first-time buyers.
*Our forecasts treat driver/restraint impacts as directional, not additive. The impact forecasts reflect baseline growth, mix effects, and variable interactions.
Segment Analysis
By Offering: Software Momentum From Cloud Workflows
Hardware accounted for 61.83% of 2025 revenue, reflecting the capital-intensive nature of projectors, lenses, and media servers. Software, however, is rising at a 21.11% CAGR because cloud platforms cut on-site labor and enable real-time playlist updates. Subscription licensing converts one-time sales into predictable annuities while remote diagnostics slash downtime. Disguise, Dataton, and Panasonic’s AcroSign now ship bundled analytics dashboards that monitor brightness drift and power draw, helping venues meet ISO 50001 reporting requirements. Competing cloud suites integrate audience heat-mapping, offering venues monetizable data packages for sponsors. As most projector OEMs now preload calibration tools, software lock-in is shifting pricing power toward platform owners.
Over the forecast window, many mid-sized museums will forgo outright projector ownership, instead renting hardware while investing in perpetual cloud software seats. That pivot will raise software’s share of the projection mapping market to levels last seen in digital signage, mirroring the SaaS transition previously observed in broadcast graphics. Platforms embedding generative AI are expected to command premium fees, further widening the revenue gap between code and metal.


By Dimension: 4D Immersion Strengthens Ticket Premiums
3D installations held 55.72% of 2025 spending, yet audiences now seek multisensory immersion that smartphones cannot replicate. Venues bundling haptics, fragrance diffusion, and synchronized drones with projection mapping routinely charge night-time visitor premiums of USD 30-50. Such 4D formats, growing at a 20.82% CAGR, bolster guest stay times and ancillary spend on retail and food. Museums leverage 2D overlays for cost-sensitive educational exhibits, but AI depth-estimation plugins are turning legacy 2D libraries into quasi-3D content, extending the life of assets.
Because immersive attractions discourage casual recording, operators protect intellectual property and minimize free online leaks. That exclusivity sustains higher average ticket values, ensuring 4D will capture incremental share of the projection mapping market size by 2031. Although safety regulations in heritage districts limit pyrotechnics, most 4D effects, such as wind jets and scent, comply when properly documented, easingan permitting.
By Brightness Class: Ultra-High Lumens Anchor Urban Permanence
Units delivering 10,000-25,000 lumens owned 44.94% of 2025 shipments, serving rental fleets and indoor venues. Permanent outdoor canvases in cities now demand greater than 25,000 lumens to overcome ambient light and visual noise; this band is forecast to climb at 19.96% CAGR. Panasonic and Christie ship 40,000-50,000 lumen laser projectors that deliver contrast above 500:1 even under 50-lux street lighting. Laser cost-per-lumen dropped by 47% between 2020 and 2025, decisively tipping lifecycle economics in favor of laser in five-year ROI scenarios.
Energy-efficient models help European municipalities satisfy aggressive sustainability mandates, giving laser an additional policy tailwind. The sub-10,000 lumen niche remains viable for boutique galleries and pop-up retail, where portability and short throw distances trump raw brightness; however, LED walls are eroding share in that segment, pressing vendors to enhance mapping flexibility and color gamut.

By Projection Technology: LCD Closes The Gap
DLP delivered 51.64% of 2025 turnover thanks to durable chipsets and compact chassis desirable for touring shows. LCD is staging a comeback, expanding at 20.41% CAGR, as panel makers now ship 4K native resolution with vivid color matching essential for heritage sandstone or marble façades. Lower upfront costs and higher lumen-per-watt efficiency improve total cost of ownership in regions with costly electricity. LCoS occupies an ultra-premium niche-Olympic ceremonies, royal events-where 8K resolution warrants a two-to-three-fold hardware premium.
The technology race increasingly centers on service intervals and interoperability with AI-driven calibration. DLP boasts longer service intervals, but LCD suppliers are investing in sealed optics and laser light sources to minimize downtime. Over the forecast, hybrid clusters that network multiple mid-lumen LCD units via cloud orchestration may match single high-lumen DLP units at lower capital cost, potentially redrawing technology preference lines.
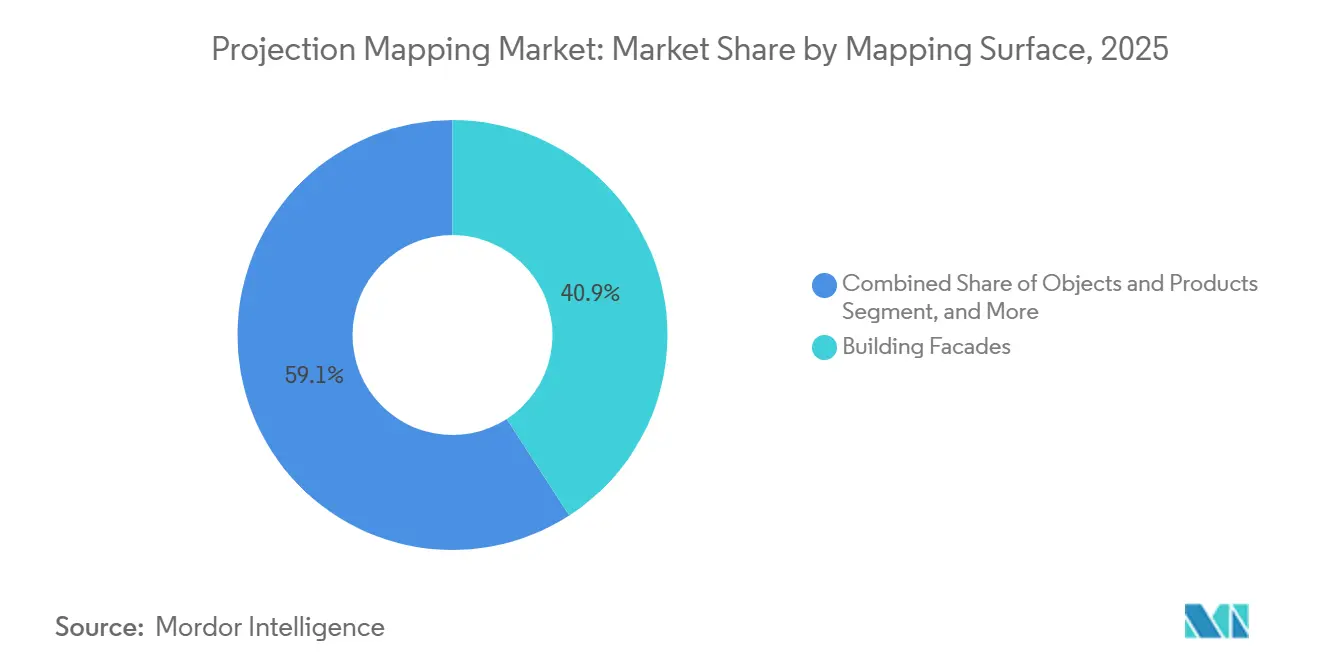
By Mapping Surface: Objects And Products Accelerate
Building façades controlled 40.86% of 2025 spend, buoyed by civic landmark programs and large-scale brand launches. Objects and products, however, are growing 20.57% CAGR as automotive, electronics, and luxury brands animate physical merchandise for social-media-friendly reveals. Retailers report 12-18% reductions in returns when customers preview furniture finishes or cosmetics via projection overlays before purchase. Museums protect priceless artifacts by projecting reconstructed textures rather than applying physical treatments, satisfying conservation rules.
Façades will remain the dominant canvas in terms of area, yet the faster growth in object mapping underscores a commercial shift toward ROI-measurable activations. Water screens and natural terrain stay niche due to weather risk and high pump operating costs, but they deliver unique translucent imagery that commands premium resort pricing.
By Application: Heritage Sites Monetize Night-Time Hours
Large venues and façades yielded 35.88% of 2025 revenue, spanning stadium bowls and hotel exteriors that double as dynamic billboards. Cultural and heritage sites are forecast to expand at 20.92% CAGR as UNESCO endorses projection mapping for after-dark storytelling without permanent modifications. Casa Batlló’s 110,000 paid visitors to its evening show validated willingness to pay for curated heritage experiences. Theme parks adopt projection mapping to postpone costly ride-build cycles, achieving equivalent guest satisfaction at a fraction of capex.
Sports arenas embed pre-game projections to unlock new sponsorship slots worth USD 0.5-1.5 million annually. Corporate campuses and commercial spaces increasingly rely on modular projectors that can be moved among auditoriums, atriums, and shareholder meetings, maximizing utilization. Across applications, the shift from one-off spectacles to evergreen infrastructure places a premium on cloud content management and long-term service contracts, elements expected to raise the recurring portion of projection mapping market revenue.
Geography Analysis
Asia-Pacific leads growth with a 21.66% CAGR as Japan institutionalizes projection mapping within urban policy, and the Middle East funds mega-installations through sovereign programs that bundle fiber backhaul and GPU edge nodes. North America, while still the largest revenue contributor in 2025, is transitioning from new hardware rollouts toward content refresh cycles, stabilizing growth at mid-single-digit rates.
Europe maintains steady adoption anchored in heritage tourism, yet EU Directive 2024/1619 imposes brightness caps and operating-hour limits that lengthen permitting timelines. Municipal pilots in Barcelona and Amsterdam nonetheless demonstrate that adaptive-dimming algorithms can comply with regulations while maintaining visitor flow.
Emerging opportunities arise in India, South Korea, and Southeast Asia, where declining projector prices intersect with heritage-tourism initiatives. South America and Africa lag due to budget constraints and a scarcity of integrators, though World Cup legacy infrastructure in Brazil and archaeological showcases in Egypt hint at future uptake once financing tools mature.

Competitive Landscape
Five hardware OEMs-Panasonic, Epson, Barco, Christie Digital, and Sony-command a significant share of global shipments, supporting a moderately concentrated hardware tier. Software remains fragmented across more than 15 specialized platforms, each tuned to live events, broadcast, or architectural permanence. Hardware leaders now acquire or partner with software firms; Panasonic co-developed calibration pipelines with Disguise, while Barco integrates Green Hippo servers into turnkey offers.
Competition is fiercest in rentals, where hardware commoditization drives price wars during off-peak quarters. Permanent installations, by contrast, yield multiyear service margins of 50-60%, prompting OEMs to bundle remote monitoring and ISO-compliant energy reports. Patent filings now cluster around AI calibration and adaptive brightness, signaling that intellectual property will increasingly separate premium providers from volume players.
White-space opportunities include edge-rendered generative content for rapid campaign cycles, sub-millisecond facial mapping for cosmetics retail, and underground pedestrian networks where projection displaces static signage. Vendors that integrate these capabilities into cloud platforms stand to capture expanded share of the projection mapping market by 2028.
Projection Mapping Industry Leaders
Panasonic Corporation
Seiko Epson Corporation
Pixel Rain Digital
Barco NV
Christie Digital Systems USA, Inc.
- *Disclaimer: Major Players sorted in no particular order

Recent Industry Developments
- December 2025: World Bank reported that 72 regional data centers in the Gulf now host GPU clusters that enable local rendering for smart-city projection mapping, lowering latency and easing data-sovereignty concerns .
- March 2025: Japan’s “Departure” projection event at Anabuki Arena Kagawa drew 6,000 opening-day visitors under a sponsorship-funded, free-admission model that boosted social amplification by 40% .
- February 2025: Institute of Science Tokyo published research achieving 0.107 millisecond facial mapping latency, validating commercial viability for retail makeup overlays .
- January 2025: Panasonic Connect’s Tokyo Metropolitan Government Building installation welcomed its 450,000th visitor, confirming USD 12 million in incremental local spend and demonstrating unmanned nightly operation via cloud monitoring.


Global Projection Mapping Market Report Scope
Projection mapping is a video projection technology that allows video to be mapped onto any surface, unlike traditional projectors that map only on flat screens. It turns common objects such as runways, large venues, and stages into interactive displays that function as canvases with graphics projected onto their surfaces.
The Projection Mapping Market Report is Segmented by Offering (Hardware and Software), Dimension (2D, 3D, and 4D/Immersive), Brightness Class (Less than 10,000 lm, 10,000-25,000 lm, and Greater than 25,000 lm), Projection Technology (DLP, LCD, LCoS and Others), Mapping Surface (Building Facades, Indoor Walls and Floors, Objects and Products, and Water Screens and Natural Terrain), Application (Large Venues and Facades, Events and Festivals, Theme Parks and Attractions, Sports Arenas and Stadiums, Cultural and Heritage Sites, and Commercial Spaces), and Geography (North America, South America, Europe, Asia Pacific, Middle East, and Africa). The Market Forecasts are Provided in Terms of Value (USD).
| Hardware |
| Software |
| 2D |
| 3D |
| 4D / Immersive |
| Less Than 10,000 lm |
| 10,000 - 25,000 lm |
| Greater Than 25,000 lm |
| DLP |
| LCD |
| LCoS and Others |
| Building Facades |
| Indoor Walls and Floors |
| Objects and Products |
| Water Screens and Natural Terrain |
| Large Venues and Facades |
| Events and Festivals |
| Theme Parks and Attractions |
| Sports Arenas and Stadiums |
| Cultural and Heritage Sites |
| Commercial Spaces (Retail, Corporate, Education) |
| Other Application |
| North America | United States |
| Canada | |
| Mexico | |
| South America | Brazil |
| Argentina | |
| Rest of South America | |
| Europe | Germany |
| France | |
| United Kingdom | |
| Italy | |
| Rest of Europe | |
| Asia-Pacific | China |
| Japan | |
| South Korea | |
| India | |
| Rest of Asia-Pacific | |
| Middle East | Saudi Arabia |
| United Arab Emirates | |
| Rest of Middle East | |
| Africa | South Africa |
| Egypt | |
| Rest of Africa |
| By Offering | Hardware | |
| Software | ||
| By Dimension | 2D | |
| 3D | ||
| 4D / Immersive | ||
| By Brightness Class (ANSI lm) | Less Than 10,000 lm | |
| 10,000 - 25,000 lm | ||
| Greater Than 25,000 lm | ||
| By Projection Technology | DLP | |
| LCD | ||
| LCoS and Others | ||
| By Mapping Surface | Building Facades | |
| Indoor Walls and Floors | ||
| Objects and Products | ||
| Water Screens and Natural Terrain | ||
| By Application | Large Venues and Facades | |
| Events and Festivals | ||
| Theme Parks and Attractions | ||
| Sports Arenas and Stadiums | ||
| Cultural and Heritage Sites | ||
| Commercial Spaces (Retail, Corporate, Education) | ||
| Other Application | ||
| By Geography | North America | United States |
| Canada | ||
| Mexico | ||
| South America | Brazil | |
| Argentina | ||
| Rest of South America | ||
| Europe | Germany | |
| France | ||
| United Kingdom | ||
| Italy | ||
| Rest of Europe | ||
| Asia-Pacific | China | |
| Japan | ||
| South Korea | ||
| India | ||
| Rest of Asia-Pacific | ||
| Middle East | Saudi Arabia | |
| United Arab Emirates | ||
| Rest of Middle East | ||
| Africa | South Africa | |
| Egypt | ||
| Rest of Africa | ||


Key Questions Answered in the Report
What is the projected CAGR for the projection mapping market from 2026 to 2031?
The market is forecast to register a 19.76% CAGR over 2026-2031.
Which brightness class is expanding fastest through 2031?
Projectors delivering more than 25,000 lumens are set to grow at a 19.96% CAGR.
How are smart-city programs shaping adoption in Asia-Pacific?
Japan and Middle East smart-city budgets now treat façade illumination as permanent infrastructure, driving double-digit annual growth and predictable multi-year service contracts.
What technology currently dominates hardware shipments?
DLP projectors held 51.64% share in 2025, reflecting strong preference among rental fleets for compact, high-contrast units.
Which restraint most affects new heritage-site projects?
Complex site-specific calibration can extend commissioning by up to eight weeks, delaying revenue starts and inflating project costs.
How does generative-AI content creation improve ROI?
AI-assisted workflows trim artist hours on a five-minute show from 300 to 80, accelerating turnaround and cutting production expense by roughly two-thirds.
Page last updated on:


