Stadium Security Market Size and Share
Market Overview
| Study Period | 2020 - 2031 |
|---|---|
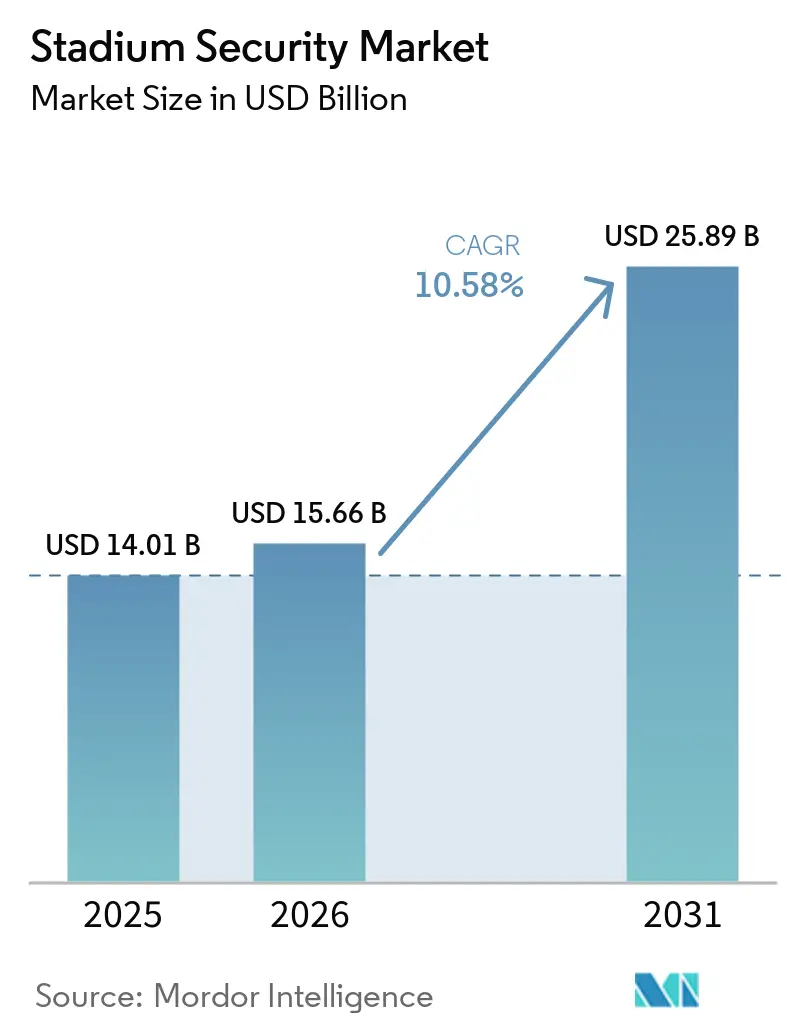
| Market Size (2026) | USD 15.66 Billion |
| Market Size (2031) | USD 25.89 Billion |
| Growth Rate (2026 - 2031) | 10.58% CAGR |
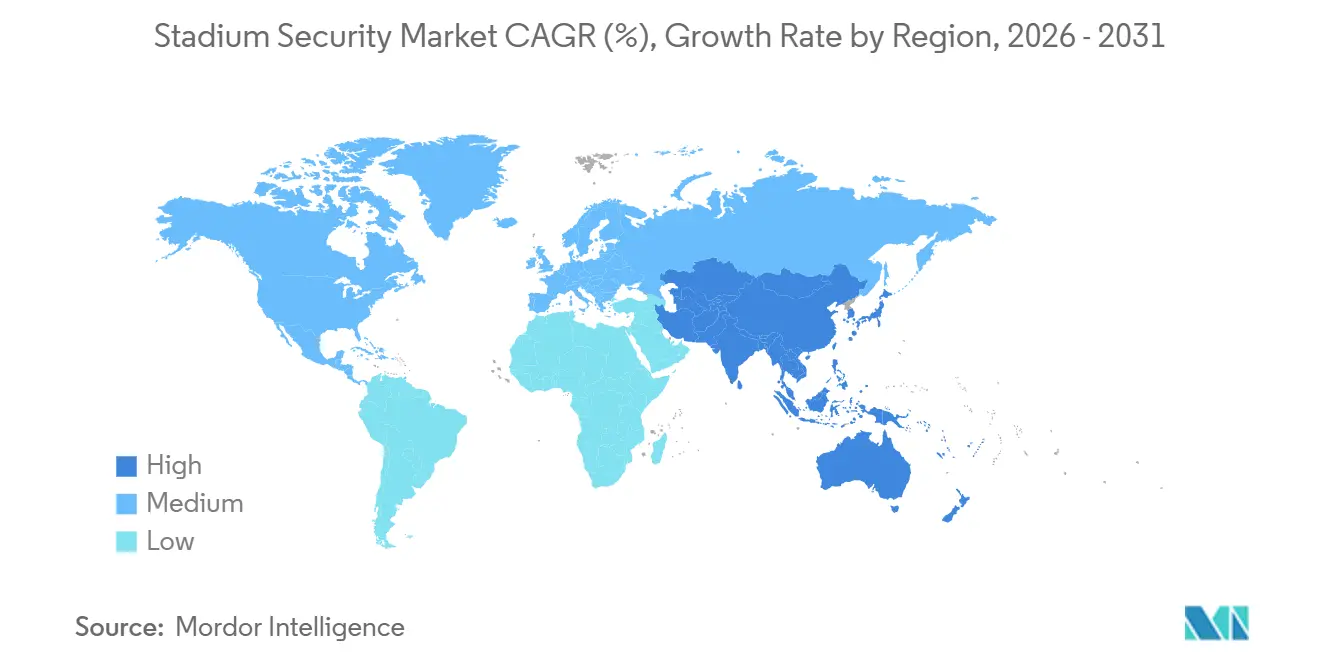
| Fastest Growing Market | Asia Pacific |
| Largest Market | North America |
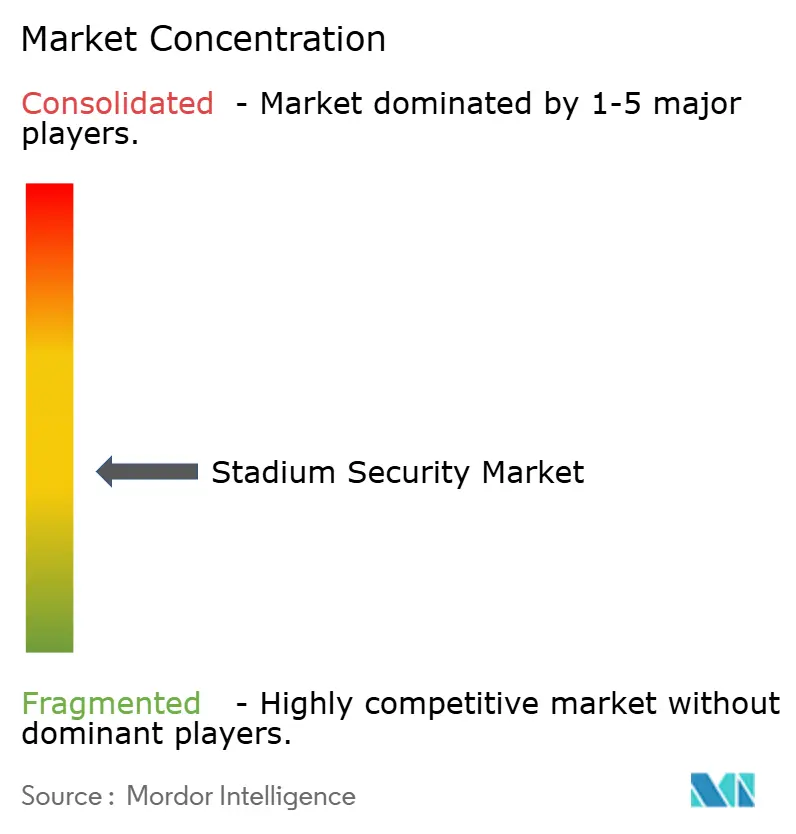
| Market Concentration | Medium |
Major Players *Disclaimer: Major Players sorted in no particular order Image © Mordor Intelligence. Reuse requires attribution under CC BY 4.0. | |
Stadium Security Market Analysis by Mordor Intelligence
The stadium security market size is projected to expand from USD 14.01 billion in 2025 and USD 15.66 billion in 2026 to USD 25.89 billion by 2031, registering a CAGR of 10.58% between 2026 to 2031. Rising incident severity, mega-event calendars, and federal funding streams are accelerating capital programs even among budget-constrained venues. North American host cities for the FIFA World Cup 2026 are unlocking FEMA grants and counter-drone appropriations that shorten purchase cycles, while Asia-Pacific governments are packaging security upgrades inside broader smart-stadium renovations. Hardware sales still dominate revenues, yet managed-security contracts are scaling faster as operators seek predictable costs, remote expertise, and analytics updates. Vendors are embedding cloud storage, AI software, and incident-response services into multi-year bundles that shift spending from capital to operating budgets, creating recurring revenue streams and lowering adoption barriers.
Key Report Takeaways
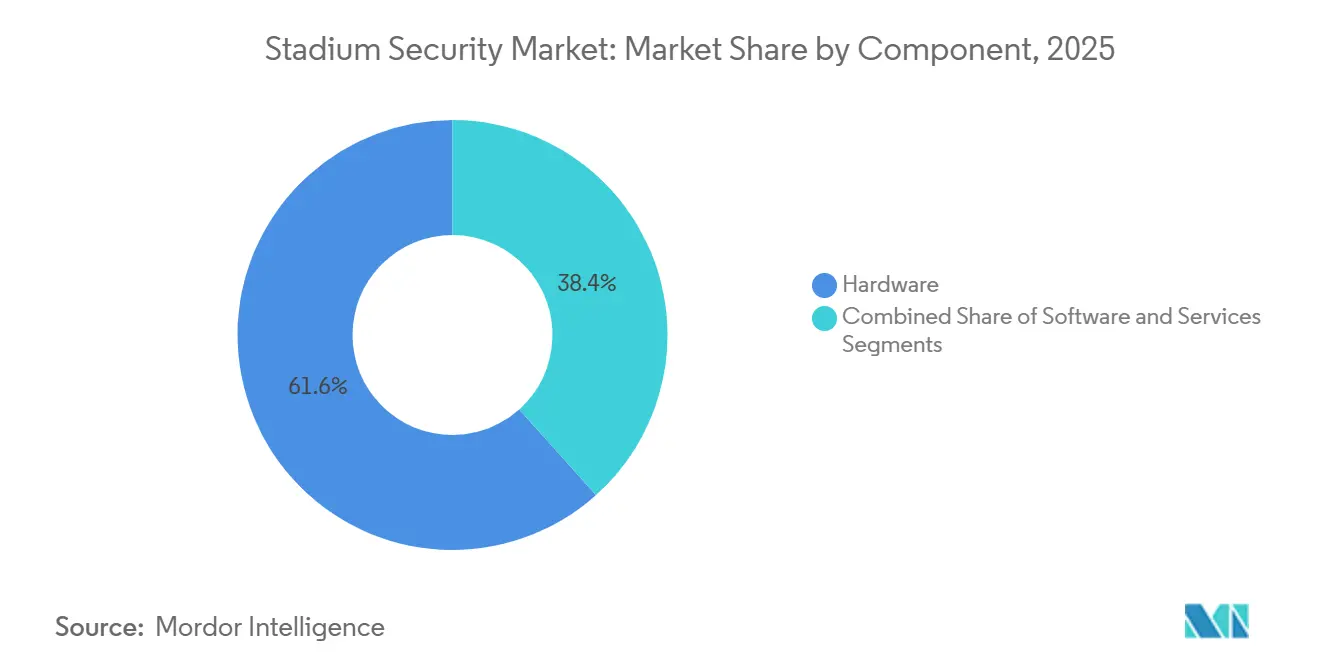
- By component, hardware led with 61.63% of the stadium security market share in 2025, whereas services are advancing at a 10.78% CAGR to 2031.
- By solution type, video surveillance systems accounted for 43.28% share of the stadium security market size in 2025, while cybersecurity and network monitoring are projected to grow at 10.91% CAGR through 2031.
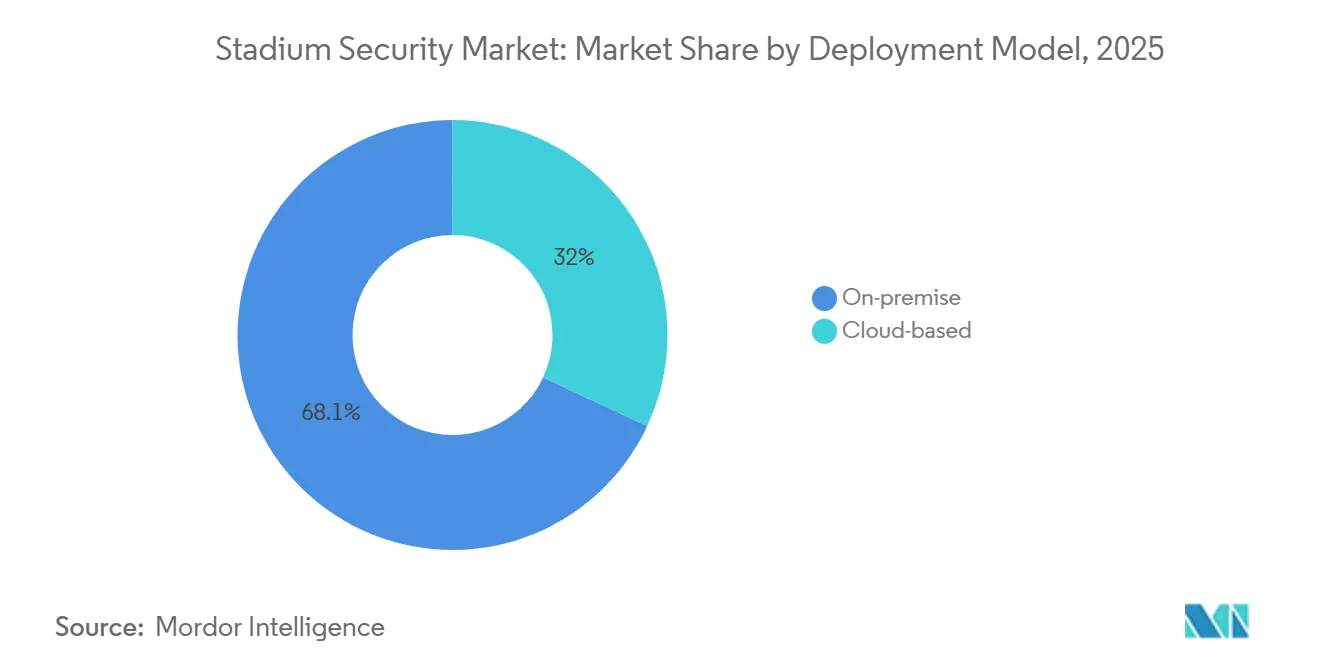
- By deployment model, on-premise platforms held 68.05% of the stadium security market share in 2025, whereas cloud-based solutions are forecast to expand at a 10.73% CAGR to 2031.
- By stadium capacity, the 30,000-50,000-seat tier commanded 46.19% share of the stadium security market size in 2025, and venues under 30,000 seats are registering the quickest growth at 11.28% CAGR through 2031.
- By geography, North America captured 38.55% of the stadium security market share in 2025, while Asia-Pacific represents the fastest regional trajectory at 11.31% CAGR over 2026-2031.
Note: Market size and forecast figures in this report are generated using Mordor Intelligence’s proprietary estimation framework, updated with the latest available data and insights as of January 2026.
Global Stadium Security Market Trends and Insights
Drivers Impact Analysis*
| Driver | (~) % Impact on CAGR Forecast | Geographic Relevance | Impact Timeline |
|---|---|---|---|
| Heightened Terrorism Threat Accelerating Mandatory Security Compliance | +2.1% | Global, focus on North America and Europe | Short term (≤ 2 years) |
| Rapid Adoption of AI-Powered Video Analytics for Real-Time Threat Detection | +1.9% | North America and Asia-Pacific | Medium term (2-4 years) |
| Government-Funded Smart-Stadium Renovations Ahead of 2026-2028 Mega-Events | +1.6% | North America, Middle East, Europe | Short term (≤ 2 years) |
| Migration from Analog CCTV to IP/PoE Lowering TCO | +1.4% | Global, early gains in Asia-Pacific and South America | Medium term (2-4 years) |
| Monetization of Crowd-Flow Data for Sponsor Analytics | +0.9% | Europe and North America, emerging Asia-Pacific | Long term (≥ 4 years) |
| Temporary Private-5G Network-in-a-Box Kits for Event Security | +0.7% | North America and Europe, pilot Middle East | Medium term (2-4 years) |
| Source: Mordor Intelligence | |||
Heightened Terrorism Threat Accelerating Mandatory Security Compliance
The July 2024 Copa America pitch invasion exposed perimeter weaknesses and intelligence gaps, motivating regulators to embed security clauses into hosting contracts. FEMA tied USD 625 million in grants to weapon-detection, counter-drone, and cybersecurity milestones, forcing venues that once planned five-year rollouts to compress projects into 18 months.[1]Federal Emergency Management Agency, “FEMA Announces Protective Security Grants for FIFA World Cup Host Cities,” fema.gov Insurance carriers now peg premium discounts to AI analytics and biometric access control, ensuring a durable demand baseline even during discretionary-spending pauses.
Rapid Adoption of AI-Powered Video Analytics for Real-Time Threat Detection
AI video analytics that flag unattended bags, crowd surges, and weapon signatures are moving from pilots to mass deployment. Convergint integrated object-recognition software that cut control-room headcount by 60% at multiple U.S. venues.[2]Convergint Technologies, “AI Analytics Reduce Stadium Control Room Staffing,” convergint.com Royal Challengers Bangalore funded 300-plus AI cameras for predictive congestion alerts and facial recognition in January 2026, illustrating Asia-Pacific’s leapfrog adoption.[3]Royal Challengers Bangalore, “RCB Invests in AI Cameras for Chinnaswamy Stadium,” royalchallengers.com
Government-Funded Smart-Stadium Renovations Ahead of 2026-2028 Mega-Events
Federal and sovereign-wealth subsidies are flowing into integrated security suites for FIFA 2026 host cities, UEFA Euro 2028 arenas, and Saudi Arabia’s 2034 World Cup pipeline. These investments aim to enhance security infrastructure and ensure the safety of attendees and participants. In the United States, grants are being utilized for perimeter hardening and counter-UAS arrays, focusing on advanced threat detection and mitigation. Meanwhile, Saudi Arabia has allocated significant funds for biometric ticketing systems and cybersecurity operations centers, which are integral to its 15-venue program. These measures reflect the growing emphasis on leveraging technology to address evolving security challenges in large-scale sporting events.
Migration from Analog CCTV to IP/PoE Lowering TCO
IP cameras, utilizing IEEE 802.3bt PoE, significantly reduce cabling labor, facilitate remote firmware updates, and support advanced edge analytics, capabilities that traditional analog systems cannot offer. These features not only enhance operational efficiency but also lower overall installation and maintenance costs. According to Security Sales and Integration, the adoption of such systems results in installation savings of 30-40%. Additionally, IPVM case studies reveal substantial hardware cost reductions, ranging from USD 200,000 to 300,000, when replacing analog systems at large venues with a seating capacity of 60,000. This transition underscores the growing preference for IP-based solutions in modern security infrastructure.[4]Security Sales and Integration, “IP/PoE Migration Cuts Cabling Costs,” securitysales.com
Restraints Impact Analysis*
| Restraint | (~) % Impact on CAGR Forecast | Geographic Relevance | Impact Timeline |
|---|---|---|---|
| High Upfront CapEx for Integrated Security Suites | -1.3% | Global, acute in South America and Africa | Short term (≤ 2 years) |
| Privacy Regulations Constraining Biometric Deployment | -1.1% | Europe, North America, emerging Asia-Pacific | Medium term (2-4 years) |
| Shortage of Skilled Security Analysts for AI Platforms | -0.6% | Global, pronounced in Asia-Pacific and Middle East | Long term (≥ 4 years) |
| RF Congestion from Dense IoT Devices Causing Sensor Interference | -0.4% | North America and Europe, emerging Asia-Pacific | Medium term (2-4 years) |
| Source: Mordor Intelligence | |||
High Upfront CapEx for Integrated Security Suites
A mid-tier stadium, with a capacity of 40,000 seats, allocates a budget of USD 8-12 million for AI cameras, biometrics, intrusion sensors, and a unified command center. However, these stadiums often stagger their purchases due to budget constraints, which creates security gaps and reduces their return on investment (ROI). This fragmented approach to security upgrades can leave vulnerabilities unaddressed for extended periods. In regions like South America and Africa, operators are increasingly turning to incremental upgrades or managed security as-a-service solutions. These strategies help them avoid significant upfront capital expenditures while maintaining a degree of operational security. Such approaches also allow for flexibility in adapting to evolving security needs over time.
Privacy Regulations Constraining Biometric Deployment
Fines imposed on FC Barcelona, LaLiga, and CA Osasuna for GDPR violations, along with litigation under Illinois' Biometric Information Privacy Act, have significantly dampened the enthusiasm for facial-recognition rollouts. These penalties highlight the growing regulatory scrutiny surrounding biometric technologies. Additionally, the EU's AI Act now requires conformity assessments and human oversight for real-time biometric applications, further complicating compliance efforts. These stringent requirements have extended deployment timelines, making it more challenging for organizations to adopt such technologies swiftly. As a result, many venues are shifting their focus towards anonymized analytics to mitigate regulatory risks while still leveraging data-driven insights.
*Our forecasts treat driver/restraint impacts as directional, not additive. The impact forecasts reflect baseline growth, mix effects, and variable interactions.
Segment Analysis
By Component: Services Outpace Hardware Despite Smaller Base
Hardware anchored 61.63% of stadium security market share in 2025 on the back of cameras, turnstiles, and perimeter sensors, yet services are pacing the expansion at 10.78% CAGR to 2031 as venues outsource integration, 24-hour monitoring, and compliance audits. The shift is most visible in facilities under 30,000 seats that lack in-house IT depth and pivot to subscription models for algorithm tuning and incident response.
The services boom aligns with managed-security bundles from Genetec and Convergint that convert capital sales into annuities, while software sits between the two streams, monetizing IP camera migrations with video management licensing and predictive crowd modules. Evolv Technologies’ per-scan bag-screening fees illustrate how hardware vendors pivot to consumption economics, extending customer lifetime value without heavy refresh cycles.


By Solution Type: Cybersecurity Emerges as Fastest-Growing Category
Video surveillance accounted for 43.28% of the stadium security market in 2025, cementing cameras as the primary security layer. Cybersecurity, though a smaller slice, is accelerating at 10.91% CAGR because ransomware, distributed denial-of-service risks, and OT network exposures threaten event continuity. Fortinet secured ticketing, point-of-sale, and surveillance networks at FC Barcelona, while Nozomi Networks monitors HVAC controllers for anomalous traffic.
Access control, perimeter detection, and alarm platforms post steady mid-single-digit growth, supported by biometrics mandates in Middle East venues and automated PTZ radar tracking that stretches protection 500 m beyond stadium fences. Insurers require annual penetration testing, effectively hard-wiring cybersecurity demand into lease covenants and sponsorship agreements.
By Deployment Model: Cloud Gains Traction Despite On-Premise Dominance
On-premises systems accounted for 68.05% of 2025 revenue due to data sovereignty, latency, and evidence-chain concerns, yet cloud video storage-as-a-service is growing at a 10.73% CAGR as Acre Security and Wasabi remove the need for local server rooms. Hanwha Vision’s OnCloud VSAAS, showcased in March 2026, underlines how updates and analytics can flow automatically without on-site patches.
Hybrid designs capture real-time weapon detections at the edge, sending archives to the cloud for forensic analysis, all while balancing latency and cost. These systems are designed to optimize performance by leveraging edge computing for immediate detection and cloud storage for long-term analysis. The speed of adoption hinges on connectivity reliability and regional regulations. For instance, fiber-rich metro markets tend to adopt a cloud-first approach, benefiting from robust infrastructure. In contrast, municipalities that prohibit cross-border data transfer opt to keep footage local, ensuring compliance with data sovereignty laws.
By Stadium Capacity: Smaller Venues Drive Fastest Growth
The 30,000-50,000-seat band delivered 46.19% of 2025 demand, reflecting pro-sports footprints, yet sub-30,000-seat complexes are sprinting ahead at 11.28% CAGR as insurers and city ordinances push compliance. Evolv Express portals at FC Cincinnati’s TQL Stadium demonstrate how cloud-connected screening reduces footprints and staff loads.
Large venues with 50,000+ seats are increasingly investing in private 5G networks, AI-driven crowd analytics, and sponsor monetization tools to enhance operational efficiency and revenue generation. However, the growth in this segment is primarily driven by technology upgrades and refreshes rather than the construction of new facilities. On the other hand, smaller arenas focus on liability protection by adopting modular solutions that are cost-effective and scalable. These solutions are typically offered with monthly subscription fees, aligning with annual budgets under USD 500,000. This approach allows smaller venues to manage costs while addressing safety and operational needs effectively.
Geography Analysis
North America retained 38.55% stadium security market share in 2025, lifted by FEMA funding, NFL and Major League Baseball security mandates, and a dense integrator ecosystem. MetLife Stadium, SoFi Stadium, and AT&T Stadium all upgraded to AI analytics, biometric gates, and counter-drone radar ahead of FIFA 2026. Canadian and Mexican venues mirror the pattern, with Axis Communications integrating license-plate recognition and facial analytics at Estadio Azteca.
Asia-Pacific, with a 11.31% CAGR, is the fastest-growing region. Royal Challengers Bangalore’s January 2026 camera project and China-financed deployments in Southeast Asia underscore how new builds skip analog entirely. Australia is installing counter-UAS systems for the 2032 Brisbane Olympics, and Japan is tying stadium networks into smart-city grids for emergency services. Data-protection fragmentation remains a wild card, particularly in India, where national biometric rules are still pending.
Europe, the Middle East, and Africa show mixed momentum. GDPR fines temper biometric rollouts in Spain and Denmark, but privacy-preserving facial analytics at Paris Saint-Germain reveal a commercial workaround. Saudi Arabia’s sovereign-funded 15-stadium initiative positions the Middle East for rapid category adoption, while South America rebuilds confidence after the Copa America breach, with Brazil and Argentina mandating QR ticket checks and expanded guard staffing. African venues proceed gradually, prioritizing incremental upgrades within fiscal constraints.

Competitive Landscape
The stadium security market remains moderately fragmented as camera heavyweights Axis Communications, Hanwha Vision, and Hikvision vie with weapon-detection specialists Evolv Technologies and Xtract One. Evolv has screened more than 3 billion patrons and now bundles eXpedite bag scans into Gen2 portals to deepen account penetration. Xtract One secured Department of Homeland Security SAFETY Act designation, offering liability shields that fast-track procurements in risk-averse municipalities.
Strategic pivots center on recurring revenue. Vendors embed cloud storage, AI analytic subscriptions, and remote monitoring in first-year quotes, turning hardware placements into multi-year annuity streams. Teledyne FLIR’s February 2026 Ranger radar upgrade marries faster 60-RPM scans with AI classification, targeting FEMA counter-drone budgets. Private 5G innovators such as Verizon and Antevia Networks threaten Wi-Fi and two-way radio incumbents by consolidating CCTV backhaul, point-of-sale, and push-to-talk on a single low-latency network.
Competitive pressure is highest in North America, where sophisticated RFPs squeeze margins, but first movers in Asia-Pacific and the Middle East secure beachheads by navigating localized regulations. White-space opportunities lie in OT cybersecurity, where adoption still trails physical upgrades despite mounting ransomware incidents, and in crowd analytics monetization, where less than 10% of venues track fan sentiment for sponsor pricing.
Stadium Security Industry Leaders
Avigilon Corporation
Genetec Inc.
Axis Communications AB
Hangzhou Hikvision Digital Technology Co., Ltd.
Zhejiang Dahua Technology Co., Ltd.
- *Disclaimer: Major Players sorted in no particular order

Recent Industry Developments
- March 2026: Evolv Technologies upgraded Houston Astros’ Daikin Park to Gen2 portals and added eXpedite bag screening.
- March 2026: Hanwha Vision unveiled Wisenet 9 SoC, OnCloud VSAAS, and OnCAFE access control at ISC West 2026.
- March 2026: Tennessee Titans renewed Evolv Gen2 portals and will migrate the platform to their new stadium in 2027.
- March 2026: Bank of America Stadium expanded Evolv Express coverage with eXpedite bag screening.


Global Stadium Security Market Report Scope
The Stadium Security Market encompasses a wide range of technologies, services, and integrated solutions designed to ensure the safety of spectators, staff, players, and infrastructure at stadiums and large live-event venues. This includes advanced video surveillance systems, access control mechanisms, perimeter protection solutions, and screening systems. Additionally, it covers crowd monitoring tools, emergency communication systems, and comprehensive security management software. These solutions aim to address the growing need for enhanced security measures in response to increasing safety concerns and regulatory requirements.
The Stadium Security Market Report is Segmented by Component (Hardware, Software, and Services), Solution Type (Video Surveillance Systems, Access Control Systems, Perimeter Intrusion Detection Systems, Alarm and Notification Systems, Cybersecurity and Network Monitoring), Deployment Model (On-Premise, and Cloud-Based), Stadium Capacity (Less Than 30,000 Seats, 30,000-50,000 Seats, and Greater Than 50,000 Seats), and Geography (North America, Europe, Asia-Pacific, Middle East and Africa, and South America). The Market Forecasts are Provided in Terms of Value (USD).
| Hardware |
| Software |
| Services |
| Video Surveillance Systems |
| Access Control Systems |
| Perimeter Intrusion Detection Systems |
| Alarm and Notification Systems |
| Cybersecurity and Network Monitoring |
| On-Premise |
| Cloud-Based |
| Less Than 30,000 Seats |
| 30,000-50,000 Seats |
| Greater Than 50,000 Seats |
| North America | United States |
| Canada | |
| Mexico | |
| Europe | Germany |
| United Kingdom | |
| France | |
| Russia | |
| Rest of Europe | |
| Asia-Pacific | China |
| Japan | |
| India | |
| South Korea | |
| Australia | |
| Rest of Asia-Pacific | |
| South America | |
| Middle East and Africa |
| By Component | Hardware | |
| Software | ||
| Services | ||
| By Solution Type | Video Surveillance Systems | |
| Access Control Systems | ||
| Perimeter Intrusion Detection Systems | ||
| Alarm and Notification Systems | ||
| Cybersecurity and Network Monitoring | ||
| By Deployment Model | On-Premise | |
| Cloud-Based | ||
| By Stadium Capacity | Less Than 30,000 Seats | |
| 30,000-50,000 Seats | ||
| Greater Than 50,000 Seats | ||
| By Geography | North America | United States |
| Canada | ||
| Mexico | ||
| Europe | Germany | |
| United Kingdom | ||
| France | ||
| Russia | ||
| Rest of Europe | ||
| Asia-Pacific | China | |
| Japan | ||
| India | ||
| South Korea | ||
| Australia | ||
| Rest of Asia-Pacific | ||
| South America | ||
| Middle East and Africa | ||


Key Questions Answered in the Report
What is the forecast value of global stadium security spending by 2031?
Spending is projected to reach USD 25.89 billion by 2031, reflecting a 10.58% CAGR from 2026.
Which region is growing fastest in venue protection solutions?
Asia-Pacific leads with an 11.31% CAGR thanks to IPL investments, new Chinese arenas, and Brisbane Olympic preparations.
How are small stadiums justifying security upgrades?
Insurance discounts and local ordinances are prompting sub-30,000-seat venues to adopt modular weapon-detection portals and cloud video that fit sub-USD 500,000 yearly budgets.
Why is cybersecurity demand accelerating in sports venues?
Convergence of IT and OT networks exposes ticketing, POS, and HVAC systems to ransomware, making cybersecurity the fastest-growing solution category at 10.91% CAGR.
What deployment model will gain share over the next five years?
Cloud video storage and access control are expanding at 10.73% CAGR as vendors bundle retention and analytics into subscription services.
Which technology is reshaping perimeter defense against aerial threats?
AI-enhanced counter-drone radar, exemplified by Teledyne FLIR’s 60-RPM Ranger upgrade, is receiving dedicated FEMA grant funding.
Page last updated on:


