
Technology, Media and Telecom
5th MayPricing Strategy for Semiconductor Components
3 Min Read
The Infrastructure Protection Market is Segmented by Component (Hardware, Software, Services), Security Type (Physical Security, Cybersecurity), Deployment Mode (On-Premise, Cloud/Hybrid), Vertical (Energy and Utilities, Transportation and Logistics, BFSI, and More), and Geography. The Market Forecasts are Provided in Terms of Value (USD).
Market Overview
| Study Period | 2020 - 2031 |
|---|---|
| Market Size (2026) | USD 146.52 Billion |
| Market Size (2031) | USD 192.25 Billion |
| Growth Rate (2026 - 2031) | 5.58 % CAGR |
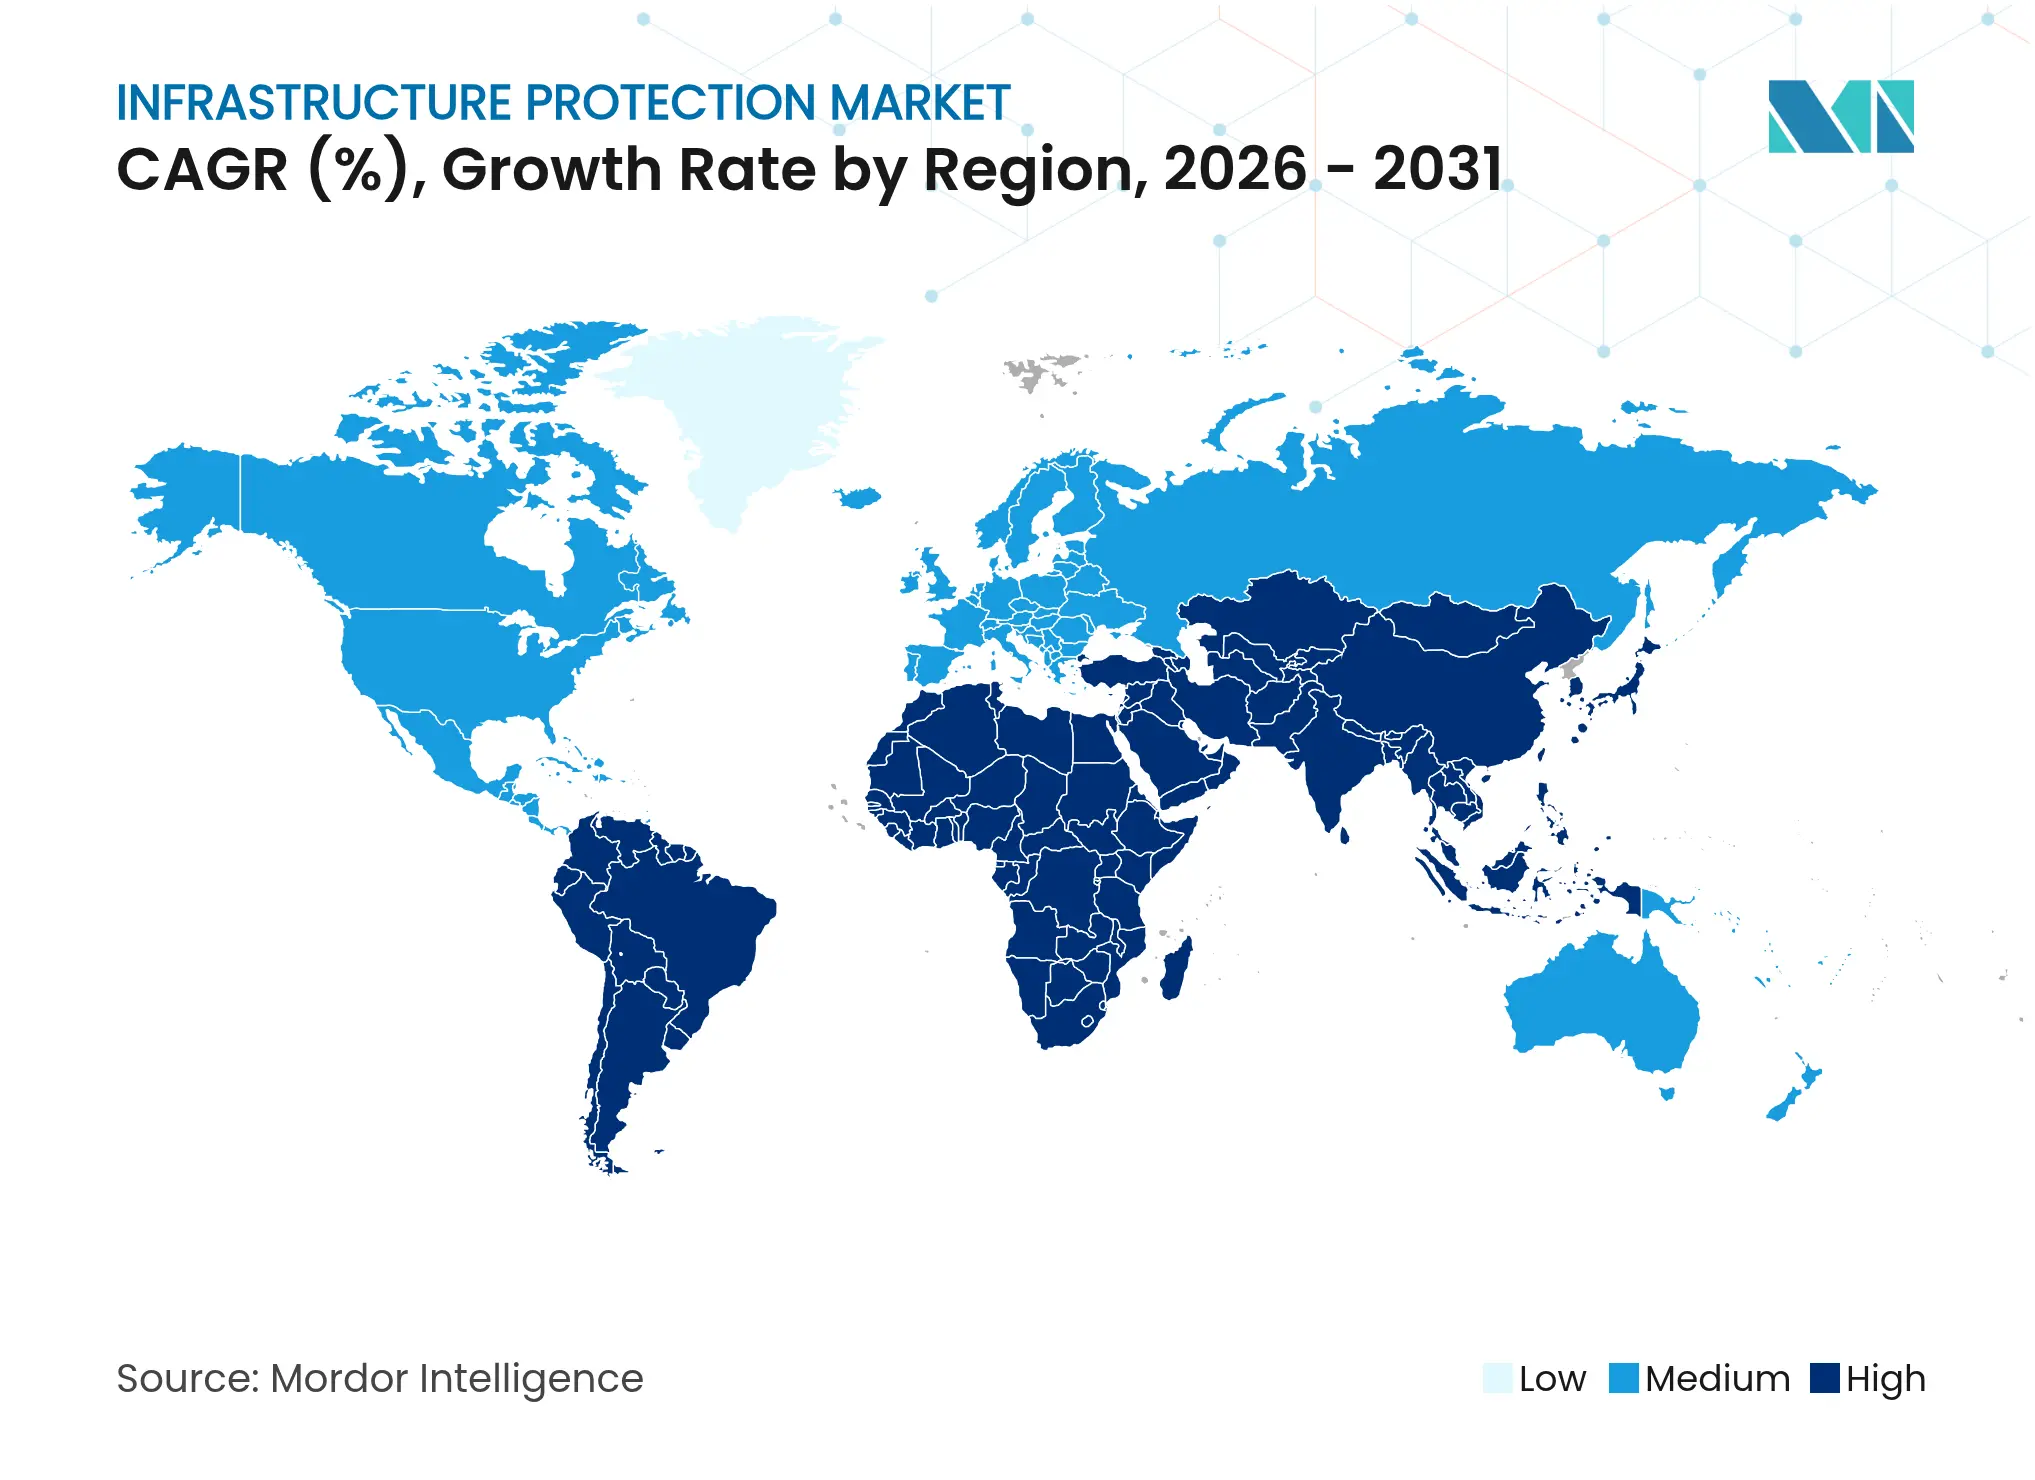
| Fastest Growing Market | Middle East and Africa |
| Largest Market | Asia Pacific |
| Market Concentration | Medium |
Major Players *Disclaimer: Major Players sorted in no particular order. Image © Mordor Intelligence. Reuse requires attribution under CC BY 4.0. |
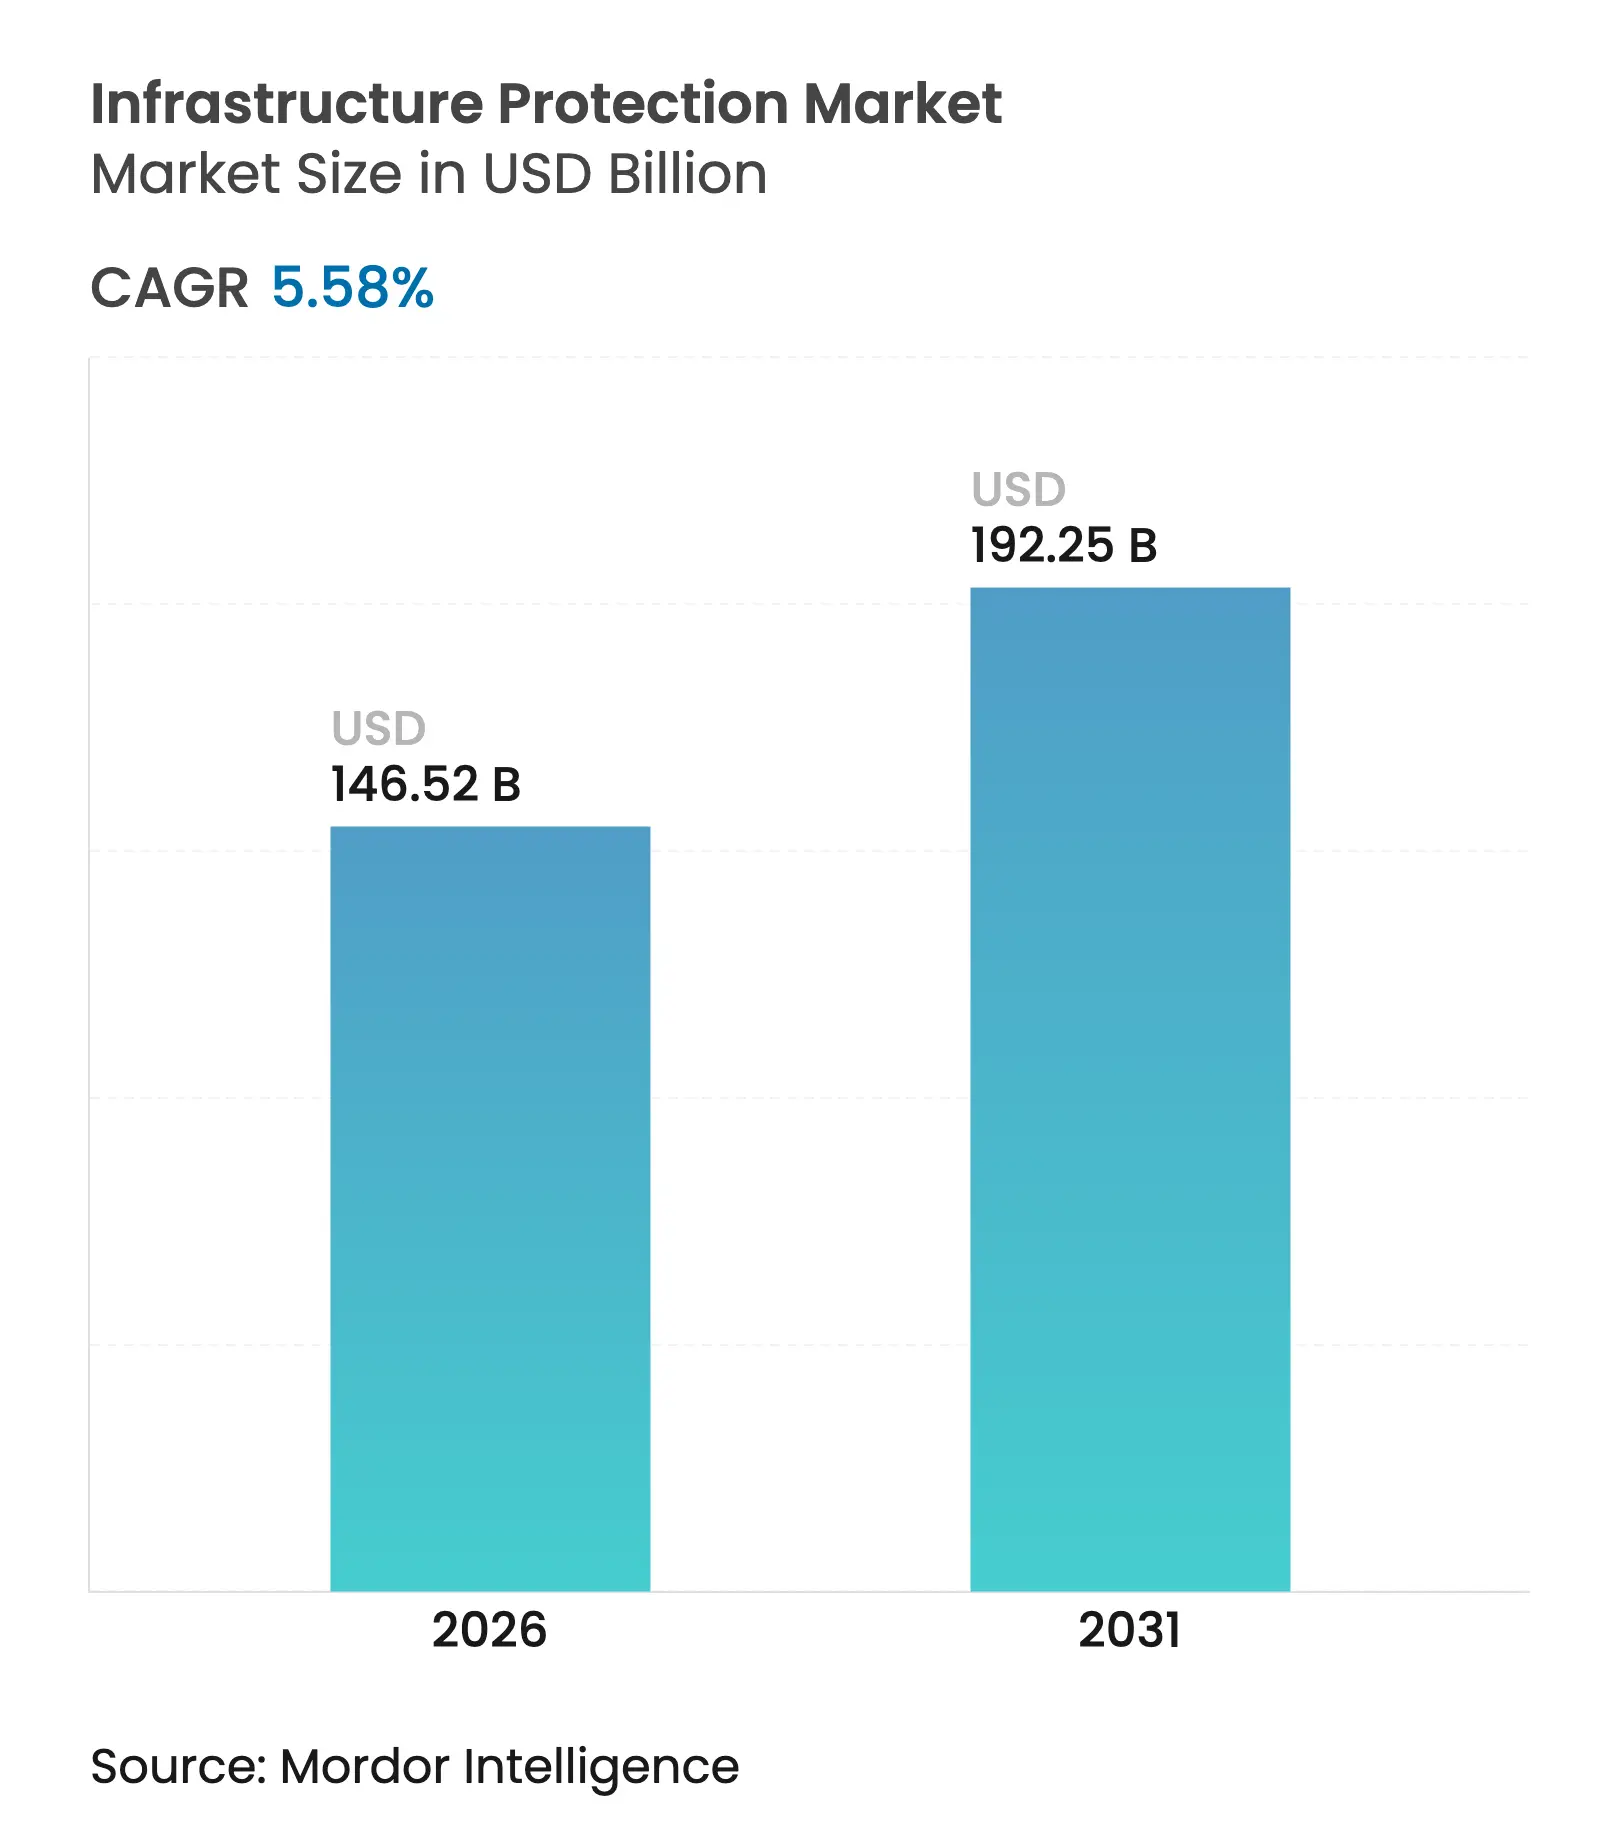
The infrastructure protection market size is expected to grow from USD 138.78 billion in 2025 to USD 146.52 billion in 2026 and is forecast to reach USD 192.25 billion by 2031 at 5.58% CAGR over 2026-2031. This trajectory mirrors the growing sophistication of blended physical-cyber threats and the adoption of AI-driven risk-mitigation platforms. Hardware currently captures the largest value pool while cloud-enabled security services are scaling rapidly, reflecting enterprise demand for flexible defenses, real-time analytics, and lower total cost of ownership. Energy & Utilities remains the highest-revenue vertical, yet Transportation & Logistics is scaling fastest as connected transport corridors and smart-hub programs mature. Regionally, Asia Pacific commands the highest revenue share, followed by North America, but the Middle East posts the strongest CAGR on the back of mega-project pipelines and mandatory cyber regulations. Strategic focus is shifting toward zero-trust architectures, cyber-fusion centers, and digital twins, indicating that long-term competitive advantage will favor vendors with integrated, cross-domain portfolios.
Key Report Takeaways
Note: Market size and forecast figures in this report are generated using Mordor Intelligence's proprietary estimation framework, updated with the latest available data and insights as of 2026.
Drivers Impact Analysis
| Driver | (~) % Impact on CAGR Forecast | Geographic Relevance | Impact Timeline | |||
|---|---|---|---|---|---|---|
Rapid rollout of 5G‐enabled industrial IoT in energy & utilities Rapid rollout of 5G‐enabled industrial IoT in energy & utilities | +1.2% | Asia, North America | Medium term (2-4 years) | (~) % Impact on CAGR Forecast:+1.2% | Geographic Relevance:Asia, North America | Impact Timeline:Medium term (2-4 years) |
Public-private cyber-fusion centres safeguarding metro transport hubs Public-private cyber-fusion centres safeguarding metro transport hubs | +0.8% | Europe | Medium term (2-4 years) | |||
Mandatory NERC-CIP v7 compliance expanding OT security budgets Mandatory NERC-CIP v7 compliance expanding OT security budgets | +1.0% | US & Canada | Short term (≤ 2 years) | |||
Accelerated digital-twin retrofits of brownfield power plants Accelerated digital-twin retrofits of brownfield power plants | +0.7% | Middle East | Medium term (2-4 years) | |||
Surge in AI-enabled perimeter sensor deployments around LNG terminals Surge in AI-enabled perimeter sensor deployments around LNG terminals | +0.6% | APAC | Short term (≤ 2 years) | |||
| Source: Mordor Intelligence | ||||||
Rapid rollout of 5G-enabled industrial IoT in energy & utilities
Ultra-reliable low-latency links created by 5G are allowing utilities to move from periodic asset inspection toward real-time situational awareness, thereby expanding the addressable infrastructure protection market. Cellular IoT connections are forecast to reach 5 billion by 2025, and each new link introduces potential lateral-movement paths for attackers. Utilities are consequently embedding encryption, network slicing, and OT/IT segmentation into new buildouts, often co-designing with telecom operators. The Nozomi–Nokia alliance typifies the new ecosystem play, combining telco-grade 5G with OT visibility to close detection gaps across substations and distributed renewable sites.[1]Defense Intelligence Agency, “US DIA 2025 Threat Assessment Warns of Growing Complexity in Global Threats to National Security,” industrialcyber.co
Public-private cyber-fusion centres safeguarding metro transport hubs
European metropolitan transport authorities are pooling video analytics, badge-access logs, and cyber telemetry in joint operations centers that orchestrate incident response within minutes rather than hours. Funding commitments under the U.S. Infrastructure Investment and Jobs Act reinforce the commercial potential of this model. Vendors that can supply open-API platforms and privacy-centric analytics are best placed to secure these multistakeholder procurement cycles.
Mandatory NERC-CIP v7 compliance expanding OT security budgets
North American power generators have added dedicated OT SOCs, privileged-access vaults, and asset-discovery tools into 2025 capital plans, lifting infrastructure protection market demand for specialized services.[2]Southwest Power Pool, “2025 Budget,” spp.org Compliance projects are also accelerating the pivot toward zero-trust, yet utilities report skills shortages that delay full policy rollout. Service firms offering turnkey audit readiness and workforce augmentation are gaining share.
Accelerated digital-twin retrofits of brownfield power plants
Middle-Eastern operators retrofit older gas and steam facilities with virtual replicas to stress-test cyber scenarios without production impact. Digital twins improve threat-hunting efficiency and maintenance scheduling, thus lowering risk exposure and operating costs simultaneously. Systems integrators integrating AI-driven anomaly detection into twin platforms are differentiating on predictive accuracy.
Restraints Impact Analysis
| Restraint | (~) % Impact on CAGR Forecast | Geographic Relevance | Impact Timeline | |||
|---|---|---|---|---|---|---|
Fragmented legacy SCADA protocols inflating integration costs Fragmented legacy SCADA protocols inflating integration costs | -0.7% | Global | Medium term (2-4 years) | (~) % Impact on CAGR Forecast:-0.7% | Geographic Relevance:Global | Impact Timeline:Medium term (2-4 years) |
Shortage of OT-focused cyber talent delaying roll-outs Shortage of OT-focused cyber talent delaying roll-outs | -0.6% | Europe, North America | Short term (≤ 2 years) | |||
Low CAPEX headroom for municipal infrastructure in Africa & Caribbeans Low CAPEX headroom for municipal infrastructure in Africa & Caribbeans | -0.4% | Africa, Caribbean | Long term (≥ 4 years) | |||
Protracted certification cycles for radiation-hardened hardware Protracted certification cycles for radiation-hardened hardware | -0.2% | Global | Medium term (2-4 years) | |||
| Source: Mordor Intelligence | ||||||
Fragmented legacy SCADA protocols inflating integration costs
Utilities and transport operators running proprietary fieldbus and custom RTUs face high middleware spend when migrating to unified zero-trust frameworks. Emerson notes that the OT cybersecurity market could rise from USD 12.75 billion in 2023 to USD 21.6 billion in 2028, partly due to protocol conversion demand. Vendors that prepackage protocol gateways and reference architectures will lower total integration costs and unlock deferred projects.
Shortage of OT-focused cyber talent delaying roll-outs
Europe and North America confront a ballooning 3.4 million-person cyber labor gap, with OT specialists particularly scarce. Elevated stress and turnover prompt CISOs to outsource monitoring to MSSPs and invest in automation, but nuanced process-control knowledge remains irreplaceable. Time-to-deploy for major protection upgrades is therefore lengthening, marginally dampening infrastructure protection market growth.
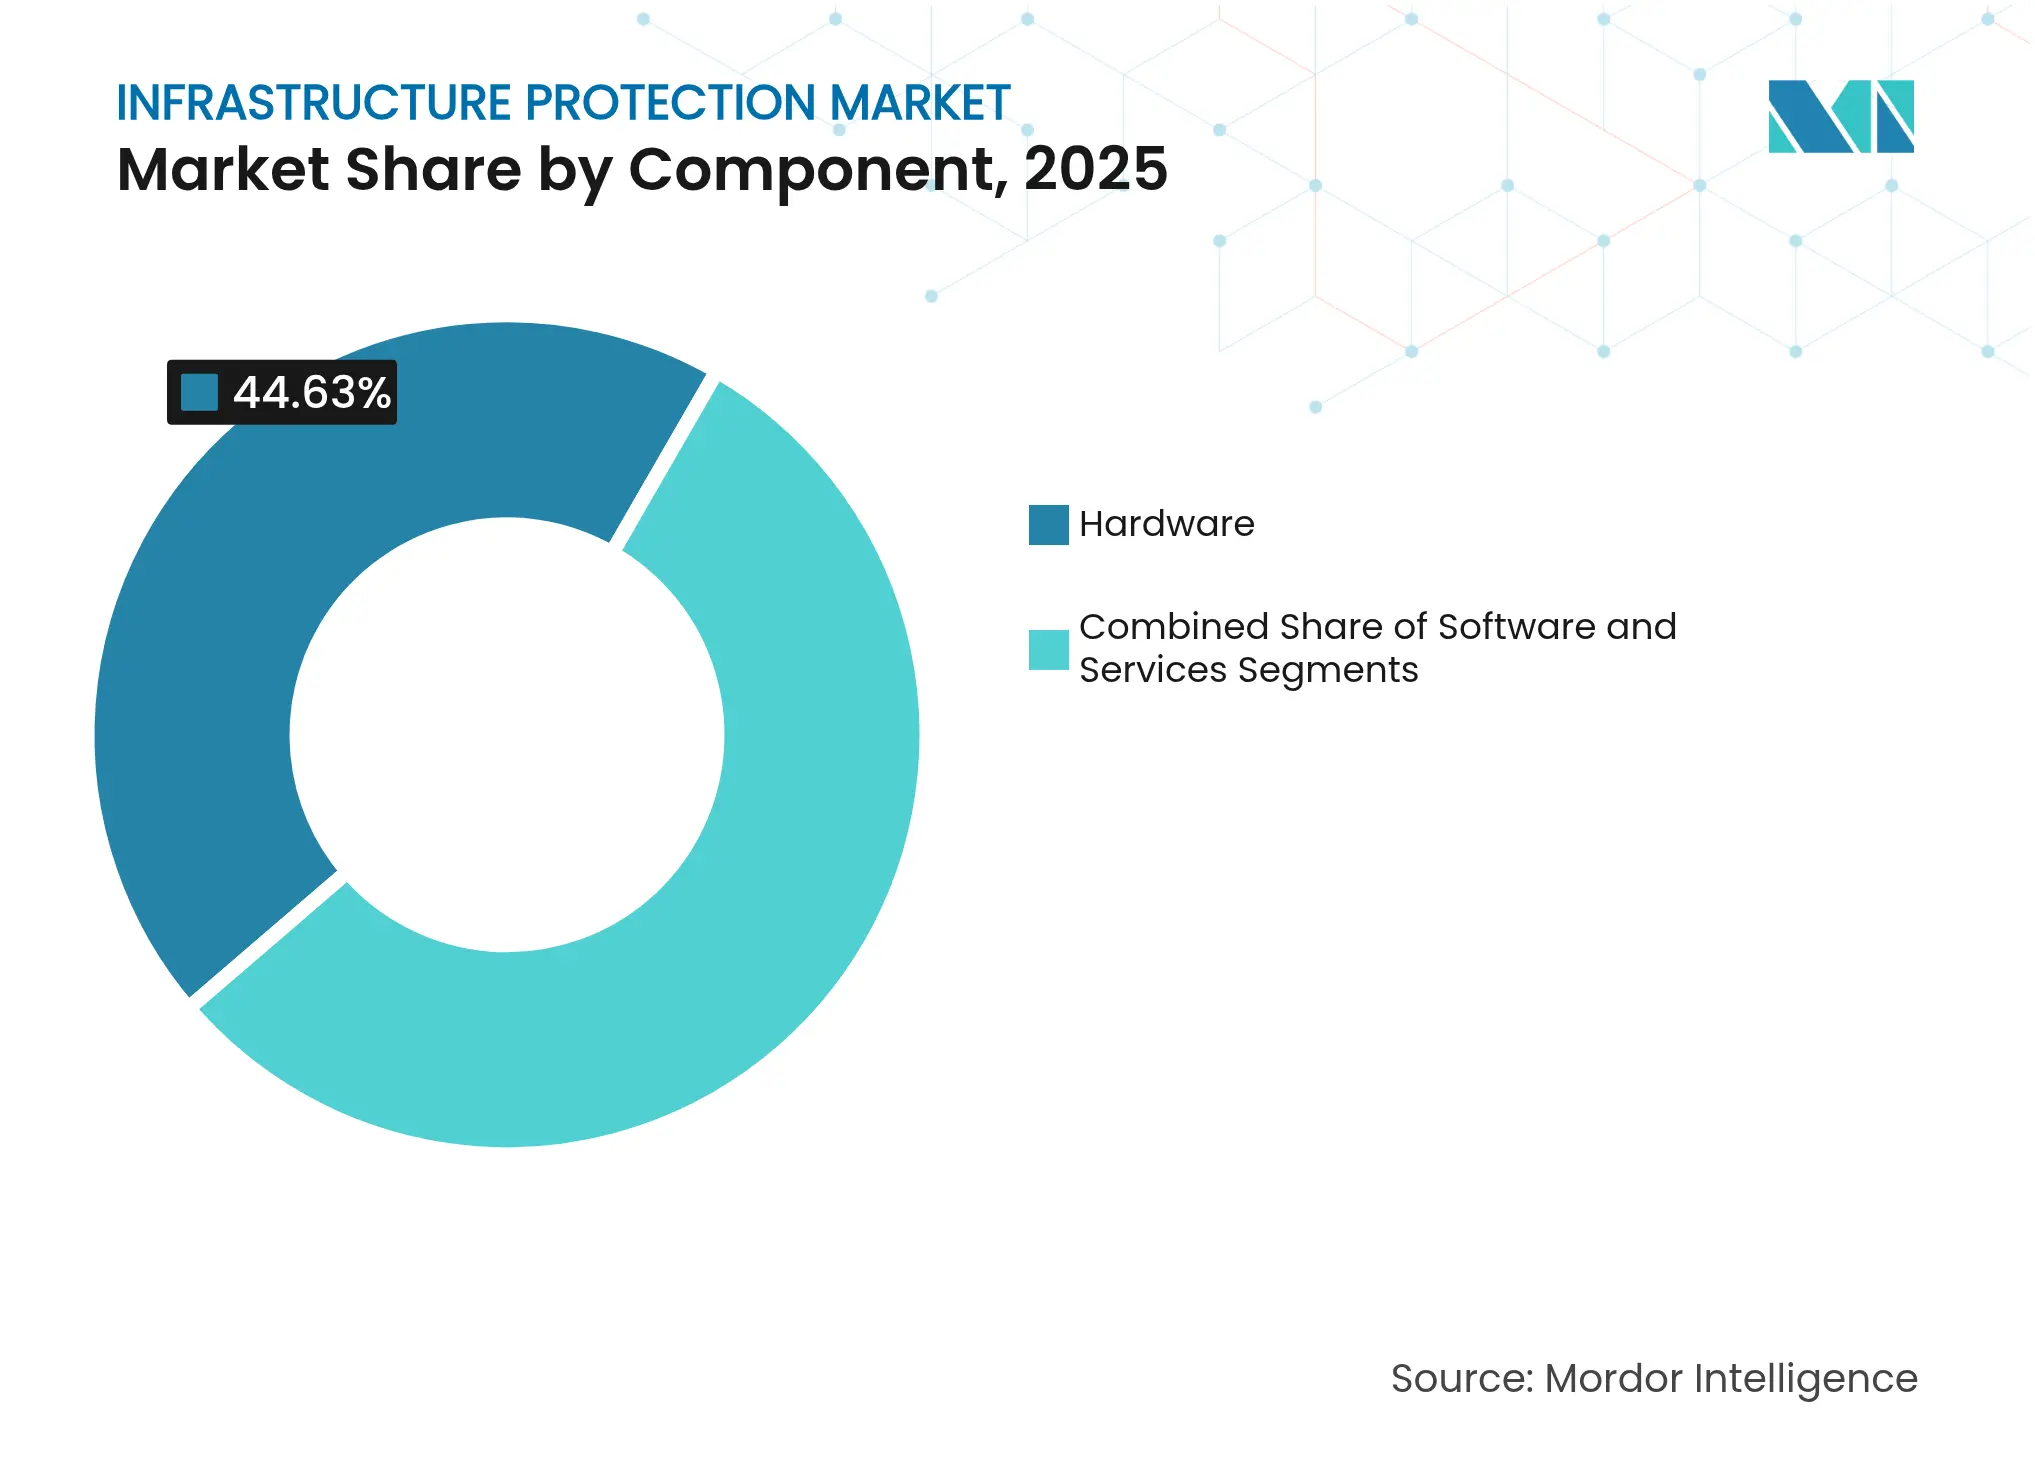
By Component: Hardware Dominates Amid Evolving Threats
The component landscape for the infrastructure protection market shows hardware capturing 44.63% revenue in 2025, underscoring continued reliance on cameras, perimeter intrusion detection systems, and access-control endpoints. Perimeter systems incorporating AI-driven behavioral analytics reduce manual screening hours and raise detection accuracy, especially for large energy terminals. Video platforms with plate recognition are gaining ground in toll roads and airport precincts.
Meanwhile, cloud/hybrid services post a 7.04% CAGR through 2031, signaling a decisive pivot toward subscription models that distribute detection logic across edge and cloud. Virtual gate-guard services and remote SOCs are lowering guard-force costs, expanding the infrastructure protection market size for managed services propositions. Software, propelled by 91% of developers prioritizing AI analytics, is the engine behind predictive maintenance, insider-threat detection, and autonomous policy tuning. Cloud-delivered risk-assessment platforms let asset owners benchmark OT configurations against threat intel feeds and regulatory baselines, a service in high demand as NERC-CIP and ISO 27019 scopes widen.
Note: Segment shares of all individual segments available upon report purchase
By Security Type: Convergence Reshapes Protection Paradigms
Physical security maintains a 52.05% revenue share in 2025, reflecting enduring demand for guards, fences, and surveillance to shield high-value assets. Yet the proposition is shifting toward AI-driven decision support, eco-efficient hardware, and drone-assisted perimeter sweeps, responding to sustainability mandates and labor scarcity.
Cybersecurity, expanding at 6.39% CAGR, mirrors rising OT network exposure and monetized ransomware campaigns. Utilities report that only 47% manage OT and IT security at parity, spotlighting a sizable opportunity for integrated SOC offerings. Zero-trust adoption among large banks will reach 60% by 2026, propelling endpoint micro-segmentation and continuous verification into critical-facility blueprints. Quantum-resistant encryption planning by 75% of financial institutions underscores long-range investment horizons. The convergence narrative broadens solution scope and raises vendor switching costs.
By Deployment Mode: On-premise Solutions Retain Dominance
On-premise architectures hold 66.45% of the 2025 infrastructure protection market size, justified by latency-sensitive controls, sovereignty mandates, and auditor preference for physical custody of logs. Bulk-power operators, chemical plants, and airports still favor on-site servers and isolated networks for deterministic response. However, maintaining patch currency, storage scaling, and 24/7 SOC staffing are pain points.
Consequently, cloud/hybrid deployments are scaling at 5.96% CAGR, giving operators elastic analytics stacks and instant rule updates. Vendors deliver edge appliances that filter raw video locally while shipping metadata to the cloud for cross-site correlation, mitigating bandwidth and privacy concerns. During 2025, enterprises upgrade legacy NVR farms with cloud-ready appliances to sweat sunk investments while opening paths to AI analytics. The resulting hybrid footprint demands unified policy orchestration and zero-touch provisioning, areas where differentiated software value emerges.

Recognized by Experts. Trusted by Leaders.
A trusted intelligence partner to global decision-makers across 90+ countries.


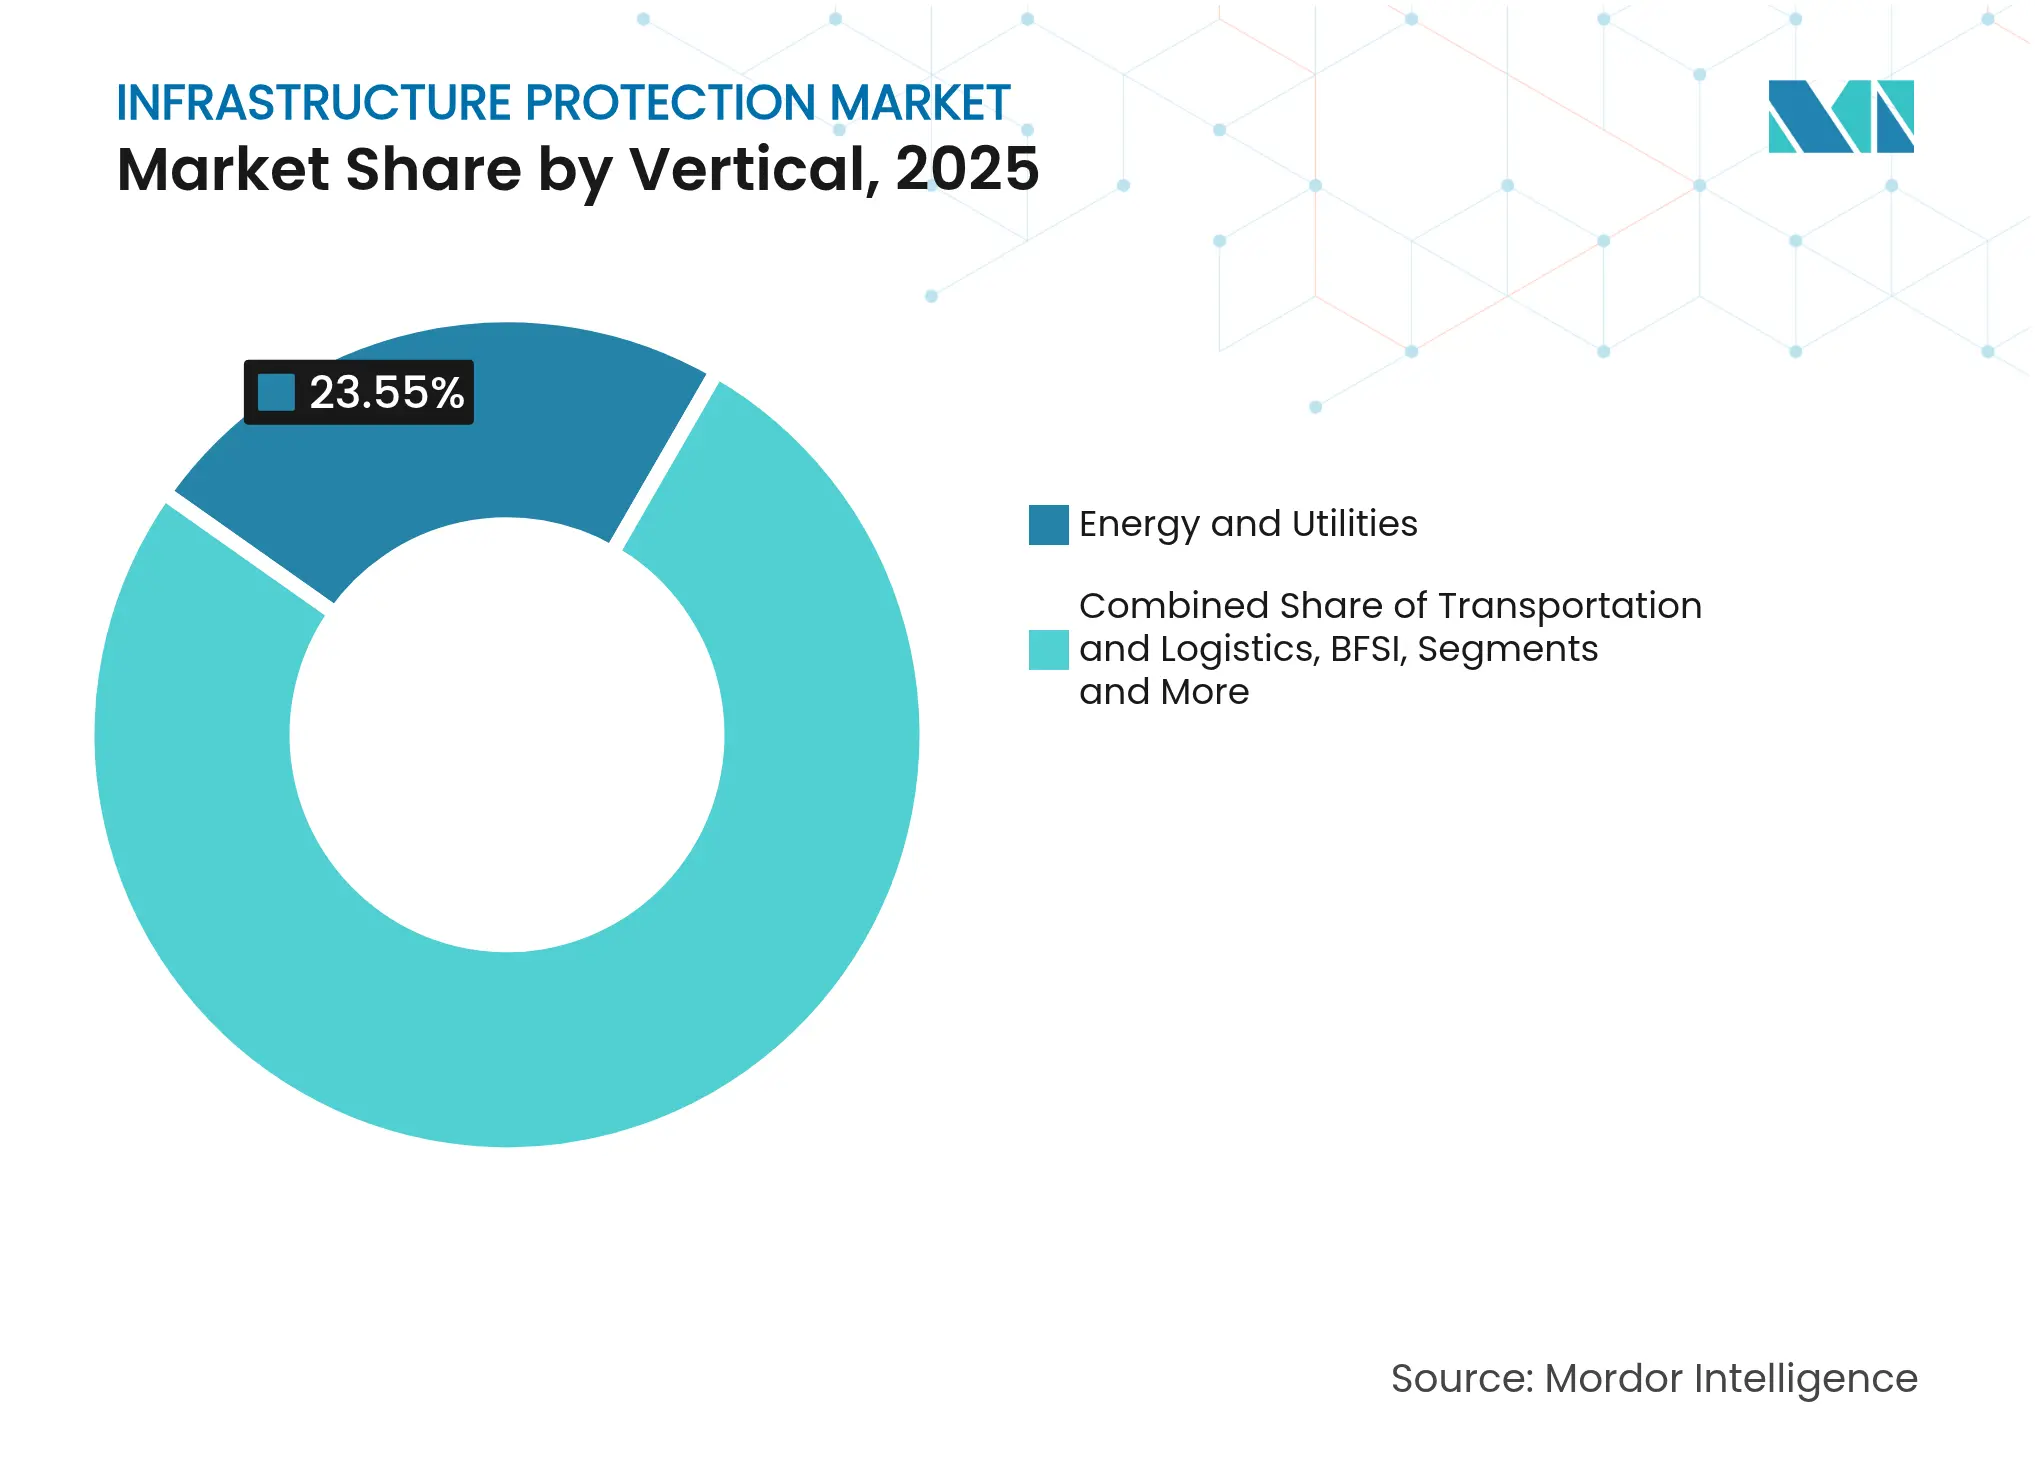
By Vertical: Energy & Utilities Face Mounting Threats
Energy & Utilities commands 23.55% of 2025 revenue, reflecting both asset criticality and regulatory pressure. The sector’s insecure legacy SCADA estates, rising distributed energy resources, and geopolitical targeting elevate risk profiles delinea.com. The U.S. Department of Energy’s 2025 Virtual Power Plant roadmap underscores the necessity of cyber-hardened aggregation platforms for distributed assets. Executives accelerate zero-trust blueprints, but workforce skills shortages slow implementation, leaving room for managed detection and response growth.
Transportation & Logistics is the fastest-growing vertical at 6.55% CAGR, driven by digitized port operations, rail ERTMS roll-outs, and air-traffic system modernization. Smart-hub operators procure unified physical-cyber stacks to minimize outage risks and regulatory penalties. BFSI investments reach USD 282 billion by 2032, illustrating the spill-over of OT threat awareness into data-center-heavy industries. Government & Defense budgets remain substantial, with DoD FY 2025 allocating multibillion-dollar cyber and physical hardening lines, sustaining baseline demand in the infrastructure protection market.
Note: Segment shares of all individual segments available upon report purchase
Asia Pacific leads the infrastructure protection market with 31.15% revenue share in 2025, anchored by widespread smart-city spending, manufacturing reshoring, and pervasive 5G roll-out. China’s security-by-design mandate in critical systems and India’s surge in API-security incidents, costing organizations an average of USD 580,000, amplify the urgency for integrated defenses. However, IMF forecasts a tapering to 3.9% GDP expansion in 2025 due to tariff dynamics, potentially squeezing discretionary capex. Local governments in Australia and New Zealand plan debt-funded megaprojects, elevating long-term security lifecycle costs but expanding addressable spend.
The Middle East represents the fastest-growing region at 6.05% CAGR, propelled by USD 3.2 trillion Vision 2030 programs and a cybersecurity market expected to reach USD 31 billion by 2030 gisec.ae. GCC priorities for 2025 center on AI infrastructure and urban evolution, with Saudi housing and Riyadh Metro projects demanding multilayered security frameworks. UAE leadership in ethical-AI standards fosters regulatory clarity, catalyzing the adoption of AI-assisted surveillance and threat-hunting. Data-breach impacts remain material: 15% of regional firms report incidents exceeding USD 100,000.
North America sustains strong volume on the back of robust federal programs. The DHS FY 2025 budget earmarks USD 1.7 billion for cybersecurity within CISA, incentivizing advanced analytics, zero-trust pilots, and secure-by-design procurement dhs.gov. The NIST Cybersecurity Framework 2.0 codifies governance as a core function, encouraging asset owners to formalize board-level oversight bitsight.com. CIRCIA rules requiring incident reporting within 72 hours will raise demand for monitoring and forensic tooling. The Defense Community Infrastructure Program’s USD 100 million in FY 2024 grants, leveraging USD 31.5 million in local co-investment, highlights ongoing modern-base initiatives.
Market Concentration
The infrastructure protection market is moderately concentrated, with diversified conglomerates, defense primes, and cybersecurity specialists vying for a share. Market leaders pursue vertical integration to deliver end-to-end physical-cyber stacks, using M&A and joint ventures to plug portfolio gaps. Honeywell exemplifies this vector: 2024 revenue reached USD 38.5 billion, and the planned three-way split by 2026 will sharpen focus on aerospace, automation, and energy-transition security. The carve-out strategy aims to accelerate capital allocation toward specialized high-growth adjacencies while simplifying go-to-market narratives.
White-space opportunities lie at the intersection of AI, blockchain immutable logs, and digital twins, enabling predictive intrusion detection and regulator-auditable data trails. The Leonardo–Siemens alliance fuses a global SOC with industrial automation expertise, positioning the partners to capture OT-security upgrades in energy and oil-gas pipelines. Disruptors focusing on OT-centric anomaly detection or sensor-agnostic data fabrics entice asset owners frustrated by siloed legacy stacks. As procurement cycles favor outcome-based KPIs, incumbents must embrace open-platform strategies or risk share erosion.
Competitive intensity is amplified by regional cyber-sovereignty initiatives that favor local partners for data residency compliance. Global vendors respond with in-country SOC build-outs and technology-transfer agreements. Pricing pressure persists in commoditized camera and sensor categories, yet bundled analytics and managed services preserve margin. Vendors with robust channel ecosystems and regulatory liaison teams maintain advantage in navigating complex tender requirements, supporting sustained infrastructure protection market expansion.customers to prioritize secure connection traffic for certain services.

*Disclaimer: Major Players sorted in no particular order
1. INTRODUCTION
2. RESEARCH METHODOLOGY
3. EXECUTIVE SUMMARY
4. MARKET LANDSCAPE
5. MARKET SIZE AND GROWTH FORECASTS (VALUE)
6. COMPETITIVE LANDSCAPE
7. MARKET OPPORTUNITIES AND FUTURE OUTLOOK
Infrastructure protection entails safeguarding the infrastructure of vital business applications and technology, systems, and corporate assets. Systems might include servers, endpoints, cloud solutions, wired or wireless networks for internet connections, hybrid integrated on-premises systems, and software for managing and accessing crucial data. An essential component of an information security program is infrastructure protection. It guarantees that the systems and services that make up your workload are secure against unauthorized access, possible vulnerabilities, and illegal access.
The Infrastructure Protection Market is Segmented by Services (Risk Management Services, Designing, Integration, and Consultation, Managed Service and Maintenance & Support), by Vertical (BFSI, Public Infrastructure &Transportation, Energy and Power, Commercial Sector, IT & Telecom, and Manufacturing), and by Geography (North America, Europe, Asia Pacific, Latin America, and the Middle East and Africa). The market sizes and forecasts are provided in terms of value (USD million) for all the above segments.
Pricing Strategy for Semiconductor Components
3 Min Read
Accelerating Additive Manufacturing Adoption in India
3 Min Read
When decisions matter, industry leaders turn to our analysts. Let’s talk.