
Specialty Nitriles Market Size and Share
Market Overview
| Study Period | 2020 - 2031 |
|---|---|
| Forecast Data Period | 2026 - 2031 |
| Historical Data Period | 2020 - 2024 |
| Growth Rate | 4.11 % |
| Fastest Growing Market | Asia Pacific |
| Largest Market | Asia Pacific |
| Market Concentration | High |
Major Players *Disclaimer: Major Players sorted in no particular order Image © Mordor Intelligence. Reuse requires attribution under CC BY 4.0. | |
Specialty Nitriles Market Analysis by Mordor Intelligence
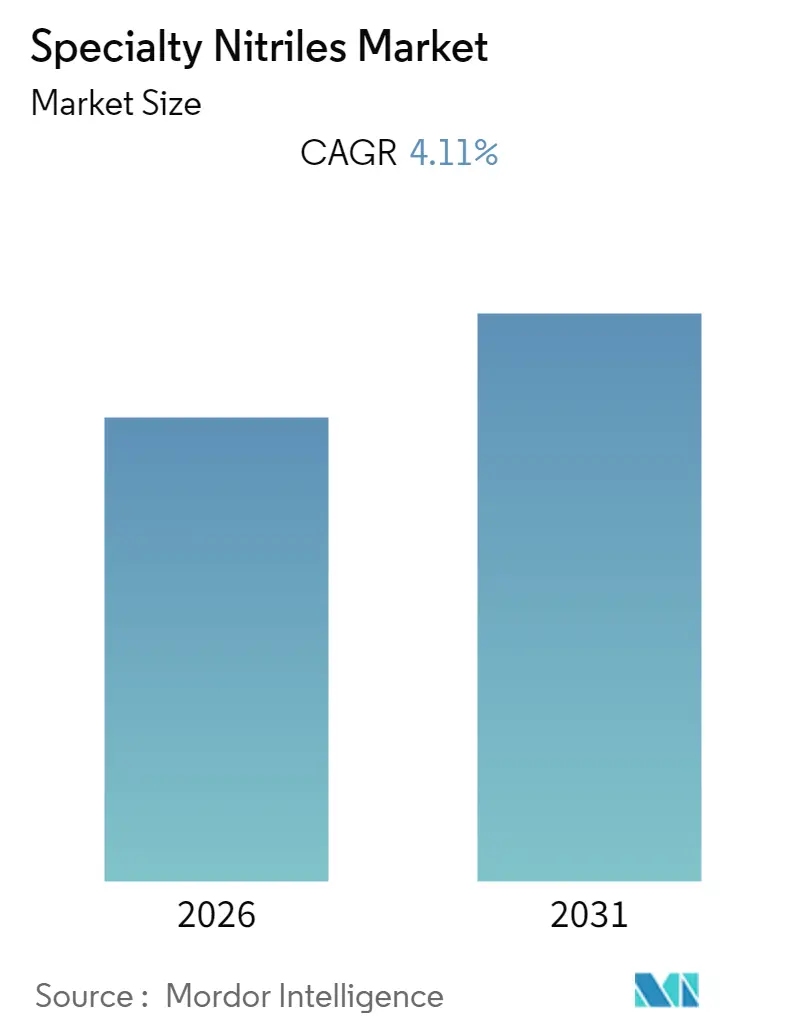
The Specialty Nitriles Market size is expected to register a CAGR of 4.11% during the forecast period.
However, the health hazards due to cyanide poisoning results from inhaling cyanides or ingesting cyanides are likely to hinder the growth of the studied market. Moreover, unfavorable conditions arising due to the COVID-19 outbreak is also expected to hamper the market growth.
Achieving a wide diversity of amides and organic acid from the enzymatic hydrolysis of nitriles are likely to provide opportunities for the specialty nitriles market over the next five years.
Asia-Pacific region dominates the specialty nitriles market, owing to the soaring consumption of specialty nitriles in adhesive, pharmaceutical and automotive segment from countries, such as China, India and Vietnam.
Note: Market size and forecast figures in this report are generated using Mordor Intelligence’s proprietary estimation framework, updated with the latest available data and insights as of 2026.
Market Trends and Insights
Automotive Components to Dominate the Market
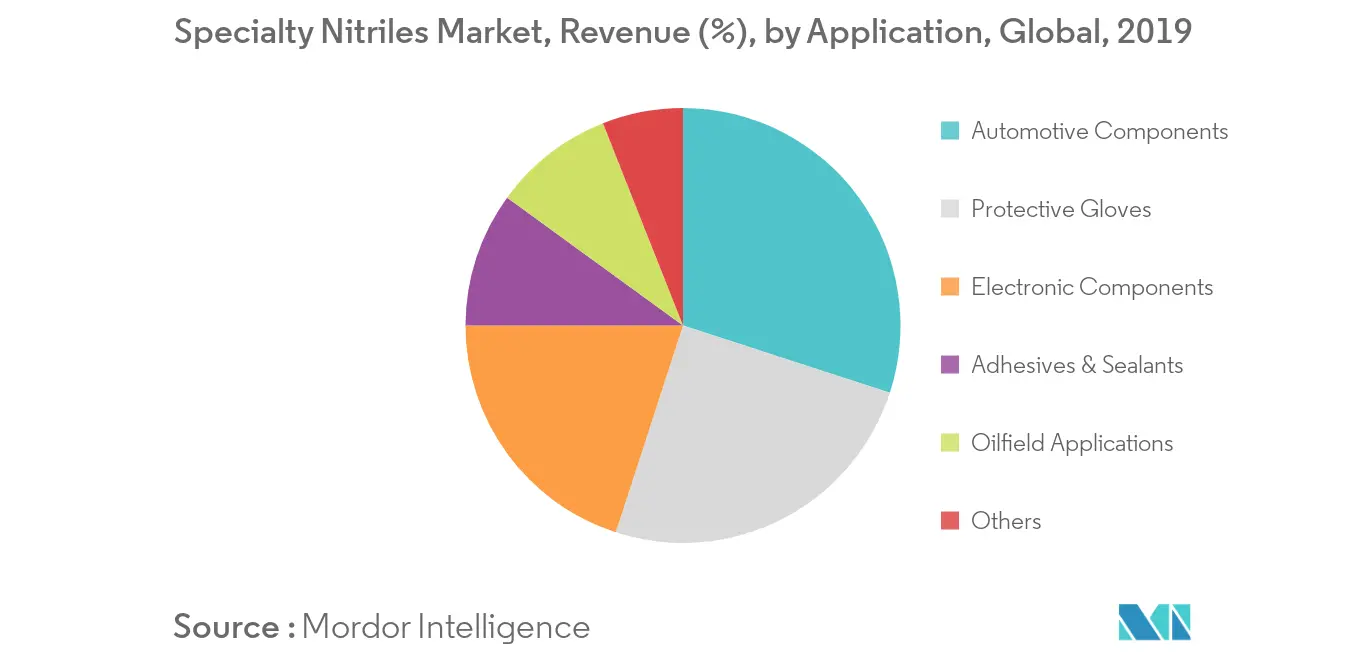
- Automotive components stands to be the dominating segment, where its requirement is widely driven by the growing need for lightweight, high fuel efficiency and low emission vehicles.
- Increasing application of nitrile rubber in the pipelines, hoses, tubes, conveyor belts, shoes, seals and glues, etc. and rising utilization in adhesive and automotive are expected to provide thrust to specialty nitriles market.
- Initiatives under Clean Energy Ministerial (CEM) like electric vehicle initiative and the growing popularity of electric vehicles is likely to increase the consumption of specialty nitrile in the automotive industry.
- Since 2018 automotive industry experience a decline in production in countries like United States of America, China, and Germany, etc. owing to which consumption of specialty nitrile is anticipated to drop. However, from 2021 the automotive industry is likely to regain production which is expected to increase the demand from automotive applications during the forecast period.
Asia-Pacific Region to Dominate the Market
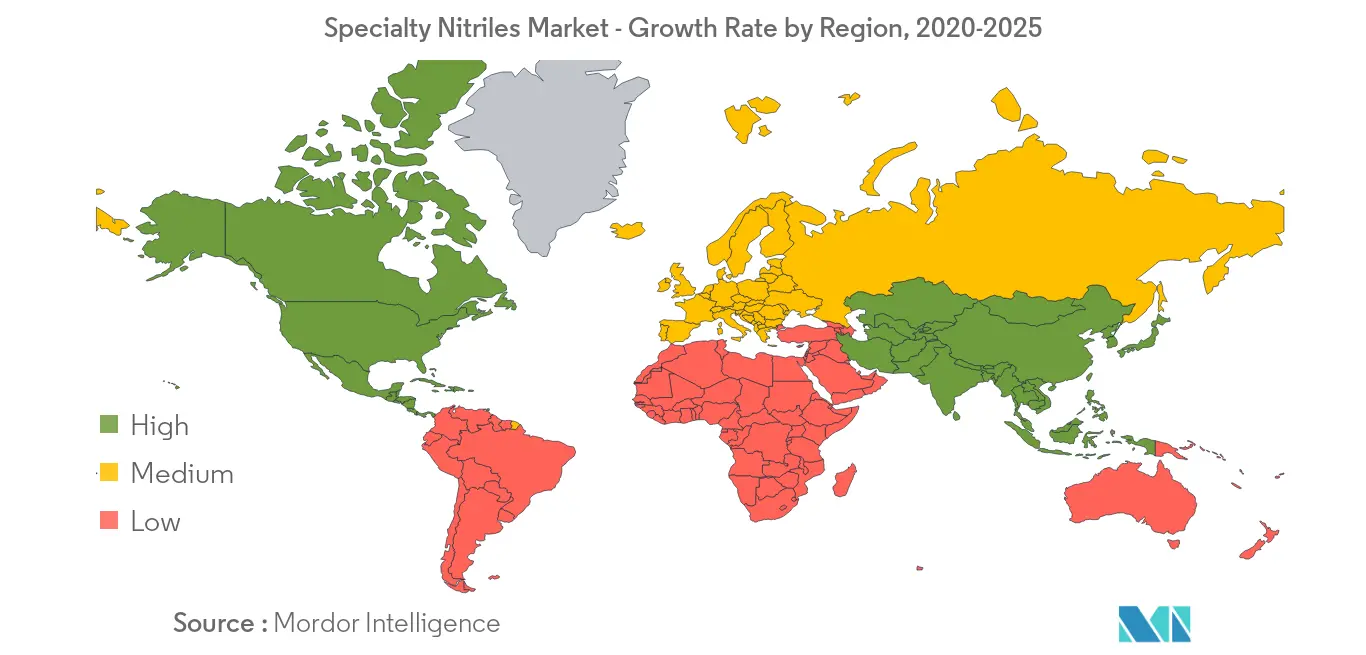
- Asia-Pacific region stands to be the largest and fastest-growing market for specialty nitriles. Factors, such as increasing utilization in pharmaceutical, adhesives and automotive segment is likely to drive the market growth.
- Nitrile containing compounds widely used in therapeutic drugs as specialty nitrile can alter the physicochemical and pharmacokinetic properties to improve bioavailability, enhance the selectivity and binding affinity to target proteins by hydrogen bond interactions. Hence with increasing consumption of therapeutic drugs; the demand for specialty nitrile has been increasing in the pharmaceutical industry.
- Beneficial attributes of specialty nitriles like good resistance to oil, heat, ozone, chemicals give it a secure position in the automobile, adhesives and electronics industry.
- Asia-Pacific region is considered to be the base for electrical & electronics manufacturing across the globe. Countries like China, India, Japan, South Korea, and Vietnam contribute most to the electronic components manufacturing in the region.
- Due to its property of sturdiness, it is extensively used in protective gloves used in chemistry laboratories to resist the effect of the chemicals and stringent regulations regarding industrial protective gears, has propel the demand for gloves consequently driving the market growth.
- Asia-Pacific is the fastest-growing region for protective gloves due to the high production and usage of protective gloves in the healthcare, manufacturing, food & beverage, construction, and transportation industries.
- Hence, all such market trends are expected to drive the demand for specialty nitriles market in the region during the forecast period.
Value Chain Analysis
The specialty nitriles value chain starts with upstream feedstocks and utilities, notably propylene and butadiene co-product streams, and ammonia, before moving into nitrile intermediate production and purification. For large-volume building blocks, acrylonitrile production is commonly linked to propylene ammoxidation (ammonia and air over catalyst at elevated temperature). Other nitrile intermediates can also sit within integrated petrochemical and nylon chains, including hydrocyanation-linked routes such as adiponitrile. Upstream nitrile and intermediate production is concentrated in hubs such as the US Gulf Coast, Germany, and the Yangtze River Delta in China, which affects lead times, logistics costs, and the availability of qualified grades.
Midstream and downstream, integrated producers and specialty chemical suppliers convert intermediates into application-specific products such as nitrile rubbers (NBR/HNBR) and other specialty nitriles used in automotive components, protective gloves, adhesives and sealants, electronics, and oilfield applications. Distribution is split between merchant sales and direct supply arrangements, and there has been a shift toward direct OEM agreements as end users seek tighter quality control, faster qualification, and stronger supply assurance. That trend can also raise single-source vulnerability when a limited set of integrated intermediate producers controls key upstream flows.
Competitive Landscape
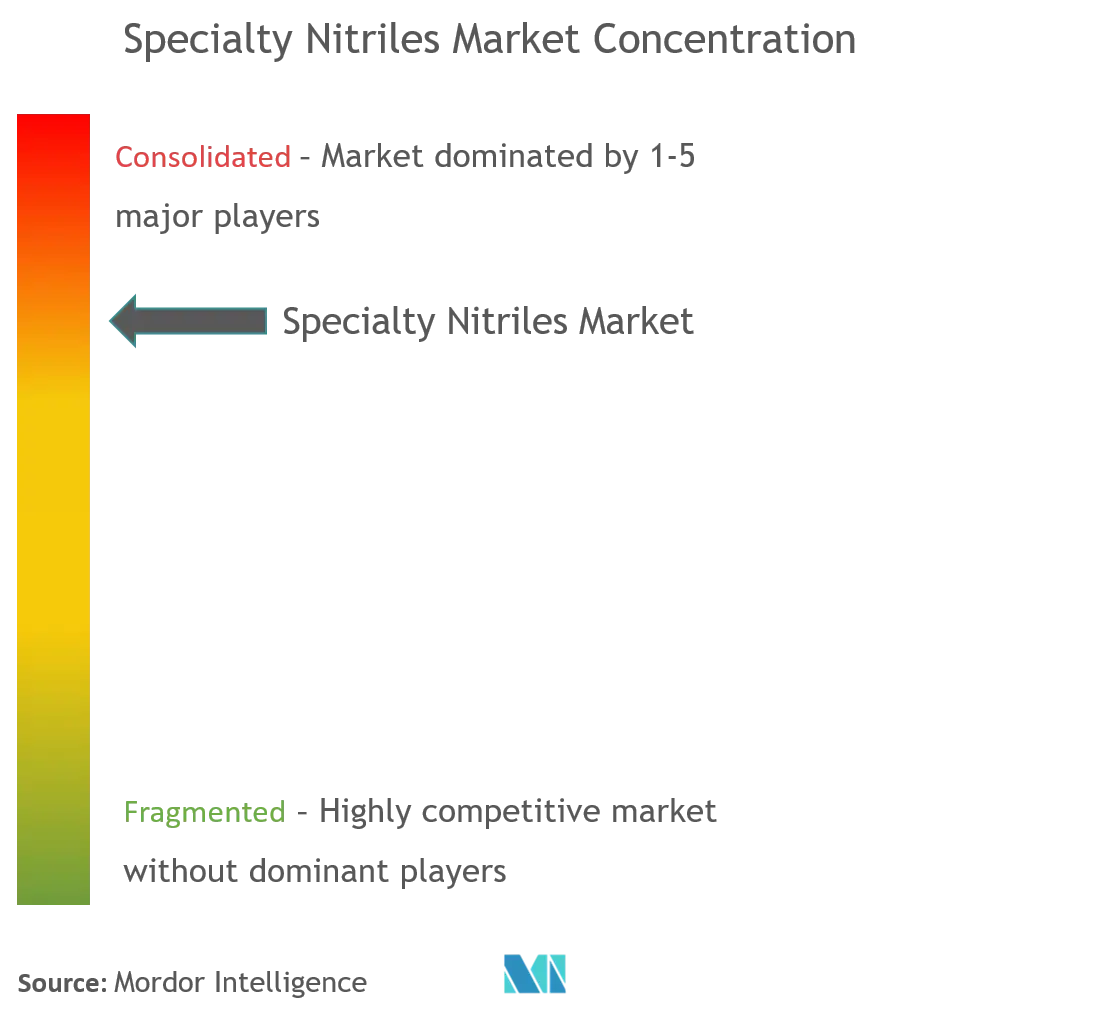
The global specialty nitriles market is consolidated in nature with a few major players dominating a significant share of the market demand. Some of the major companies are Ascend Performance Materials, INEOS Group, AlzChem Group AG, Parchem fine & specialty chemicals and Zeon Chemicals L.P. amongst others.
Specialty Nitriles Industry Leaders
-
Ascend Performance Materials
-
INEOS Group
-
AlzChem Group AG
-
Parchem fine & specialty chemicals
-
Zeon Chemicals L.P.
- *Disclaimer: Major Players sorted in no particular order
Specialty Nitriles Market Companies Covered in this Report
- AlzChem Group AG
- Ascend Performance Materials
- Denicso
- Duraco
- Emerald Performance Materials
- INEOS
- Marco Rubber & Plastics, LLC.
- Parchem fine & specialty chemicals
- Speciality Tapes
- TIDI Products, LLC.
- Zeon Chemicals L.P.
Market Opportunities and Future Outlook
Bio-based and lower-carbon nitrile pathways are emerging as a practical whitespace within acrylonitrile-linked value chains, supported by visible industrial actions. In May 2026, Trillium Renewable Chemicals commissioned an industrial-scale demonstration plant (Project Falcon) for 100% bio-based acrylonitrile at the INEOS Nitriles Green Lake facility, indicating that alternative feedstocks are moving from development into industrial operation. This supports differentiated specialty nitrile derivatives, particularly for customers seeking carbon footprint credentials.
Additional opportunity is tied to tighter integration around nitrile intermediates and purification, where supply assurance and grade consistency influence customer qualification. China Pingmei Shenma Group reported commissioning Phase I of a 200,000-ton adiponitrile project and starting construction of Phase III of a 100,000-ton aminohexanenitrile (hexanediol nitrile) project in the Pingdingshan Nylon New Materials Development Zone. These steps reinforce ongoing investment in captive nitrile intermediates that feed nylon and downstream chains. Alongside integration, demand pull for higher-purity nitrile intermediates used in pharmaceuticals, advanced polymers, and electronics supports opportunities for capacity additions and upgrades in purification, analytical control, and dedicated product platforms.
Recent Industry Developments in Specialty Nitriles Market
- February 2026: Ascend Performance Materials initiated operations at a new acetonitrile recovery and purification facility at its Chocolate Bayou site in Alvin, Texas. The unit is designed to refine acetonitrile to pharmaceutical-grade purity, strengthening domestic supply for solvent and life science value chains that require tight impurity control.
- May 2025: Ascend Performance Materials began producing high-purity acrylonitrile at its Chocolate Bayou site after installing new purification infrastructure supported by a US government contract. The move expands access to higher-spec acrylonitrile for downstream nitrile derivatives and helps reduce reliance on imported material for critical applications.
- May 2024: INEOS Nitriles launched INVIREO, a bio-based acrylonitrile offered via a mass balance certification approach for applications such as carbon fiber production and water purification. This commercial product positioning supports lower-carbon options within acrylonitrile-linked specialty nitrile value chains and provides a pathway for customers with sustainability procurement requirements.
Specialty Nitriles Market Report Scope and Research Methodology
Market Definition and Coverage
This market covers specialty nitriles sold as materials and intermediates used to make higher-performance nitrile elastomers and related products, and it is measured as supplier revenues from these specialty nitrile grades across end-use industries and regions.
Scope exclusions: finished end products (such as final gloves, molded rubber parts, or complete electronic devices) are not counted as market value, even though they use specialty nitrile materials.
Segments Covered in This Report
- Manufacturing Process
- Ammoxidation
- Hydrocyanation
- Types
- Nitrile Butadiene Rubber
- Hydrogenated Nitrile Butadiene Rubber
- Others
- Application
- Protective Gloves
- Automotive Components
- Electronic Components
- Adhesives & Sealants
- Oilfield Applications
- Others
- Geography
- Asia-Pacific
- China
- India
- Japan
- South Korea
- Rest of Asia-Pacific
- North America
- United States
- Canada
- Mexico
- Europe
- Germany
- United Kingdom
- France
- Italy
- Rest of Europe
- South America
- Brazil
- Argentina
- Rest of South America
- Middle-East and Africa
- Saudi Arabia
- South Africa
- Rest of Middle-East and Africa
- Asia-Pacific
Data Sources, Market Sizing, and Validation
Desk Research
We start with desk research to set the factual boundaries of the market and to build the first set of demand signals that can be checked later. Public sources such as UN Comtrade trade statistics, USITC DataWeb, Eurostat, and national statistics offices are used to map import and export flows, industrial output, and chemical manufacturing activity patterns by region.
To avoid relying only on trade data, we also review safety and regulatory references and industry publications, such as OSHA and EPA documentation for chemical handling, along with scientific literature that explains nitrile chemistry and performance trends. Company annual reports, investor presentations, and press releases help confirm capacity changes, product positioning, and pricing commentary. Patent databases and an import/export shipment-level database were used selectively to validate value-chain shifts and confirm where specialty grades are being produced and shipped. These desk research sources are illustrative and not exhaustive, since many other public references were also reviewed for collection, validation, and clarification.
Primary Interviews and Surveys
Primary interviews and surveys were used to pressure-test assumptions coming from public data, especially where specialty grades are not cleanly reported in standard statistics. We spoke with a mix of producers, distributors, compounders, and downstream users, and coverage was balanced across major consuming regions so we could check application shares, pricing ranges, and near-term demand visibility.
Distribution of primary research fieldwork respondents
| Company type | Respondent position | Region |
|---|---|---|
| Top tier: 32% | CXOs: 18% | APAC: 42% |
| Mid tier: 46% | Functional/Unit leaders: 40% | EMEA: 36% |
| Smaller Players: 22% | Managers: 42% | Americas: 22% |
Market-Sizing & Forecasting
Sizing was built using a top-down approach where production, trade, and industrial consumption signals are reconstructed into a realistic demand pool for specialty nitriles, and then converted into value using consistent pricing logic. Once the first total was formed, selective bottom-up checks were run using supplier roll-ups, channel discussions, and sampled price per ton multiplied by estimated volumes for the key end uses.
Inputs that matter for this market include nitrile elastomer demand indicators (such as glove usage trends and automotive seal demand), feedstock-linked cost movement, regional manufacturing output in chemicals and automotive, capacity additions or shutdowns, and the mix shift toward higher-performance grades like HNBR. Where direct volume signals were weak, gaps were handled using proxy indicators from trade codes, plant utilization commentary, and expert-validated application splits.
For forecasting, scenario analysis was used so we could reflect different paths for industrial recovery, glove demand normalization, and feedstock-driven price swings. The final forecast path was chosen after aligning the variable outlook with what industry respondents described as the most likely contracting and pricing environment.
Data Validation & Update Cycle
Model outputs are checked against independent signals, including trade flows, capacity announcements, and end-use activity indicators, so totals do not drift away from real market behavior. Any large variances trigger a review of assumptions, followed by targeted re-checks with contacts until the driver is understood and documented.
Before sign-off, the work is reviewed in multiple steps across analysts so calculation logic, unit conversions, and currency handling are consistent. Reports are refreshed annually, and interim updates are made when material events occur, such as major capacity changes or sharp feedstock swings. Right before delivery, a fresh review pass is completed so clients receive the latest updated view.
Mordor Intelligence's Specialty Nitriles Market Sizing Compared With Other Published Estimates
Published market sizes for specialty nitriles often do not match, even when they describe the same space. Differences usually come from what is counted as the market boundary, how pricing is averaged across grades, and whether the numbers are updated to reflect recent price and demand movement.
In this study, the spread is mostly explained by timing choices and pricing mechanics, since specialty nitriles can see sharp quarter-to-quarter price moves when feedstock costs shift and when glove or industrial demand changes direction. By updating exchange rates and average selling price bands on a consistent schedule, and then re-validating application shares with fresh interviews, the total stays closer to current transaction reality, which is a key reason the Mordor Intelligence estimate can sit away from older or less frequently refreshed figures.
Benchmark comparison
| Source | Market Size | Gaps in Research Methodology |
|---|---|---|
| Mordor Intelligence | USD 0.00 B (2026) | |
| Industry Publisher A | USD 2.90 B (2025) | This figure is anchored on a different base year and uses a broader chemistry and channel scope in places, which can pull in adjacent nitrile categories. The pricing basis also appears to be a single-year average without showing how grade mix and currency timing are refreshed. |
| Industry Publisher B | USD 3.84 B (2025) | The estimate appears to include a wider set of end-use applications and product types under a single umbrella, which can blend specialty nitriles with downstream nitrile materials. It also reads as a longer-horizon growth build that may not re-check near-term ASP bands and regional splits as frequently. |
The comparison shows that the biggest driver of differences is not one single data point, but a combination of scope boundary and how quickly pricing and currency assumptions are brought forward. When grade mix, regional demand signals, and exchange-rate timing are kept consistent, the resulting market value becomes easier to trace and repeat year to year.
Key Questions Answered in the Report
What is the current Specialty Nitriles Market size?
The Specialty Nitriles Market is projected to register a CAGR of 4.11% during the forecast period (2026-2031)
Who are the key players in Specialty Nitriles Market?
Ascend Performance Materials, INEOS Group, AlzChem Group AG, Parchem fine & specialty chemicals and Zeon Chemicals L.P. are the major companies operating in the Specialty Nitriles Market.
Which is the fastest growing region in Specialty Nitriles Market?
Asia Pacific is estimated to grow at the highest CAGR over the forecast period (2026-2031).
Which region has the biggest share in Specialty Nitriles Market?
In 2025, the Asia Pacific accounts for the largest market share in Specialty Nitriles Market.
What years does this Specialty Nitriles Market cover?
The report covers the Specialty Nitriles Market historical market size for years: 2019, 2020, 2021, 2022, 2023 and 2024. The report also forecasts the Specialty Nitriles Market size for years: 2026, 2027, 2028, 2029, 2030 and 2031.