Personal Care Chemicals Market Size and Share
Market Overview
| Study Period | 2021 - 2031 |
|---|---|
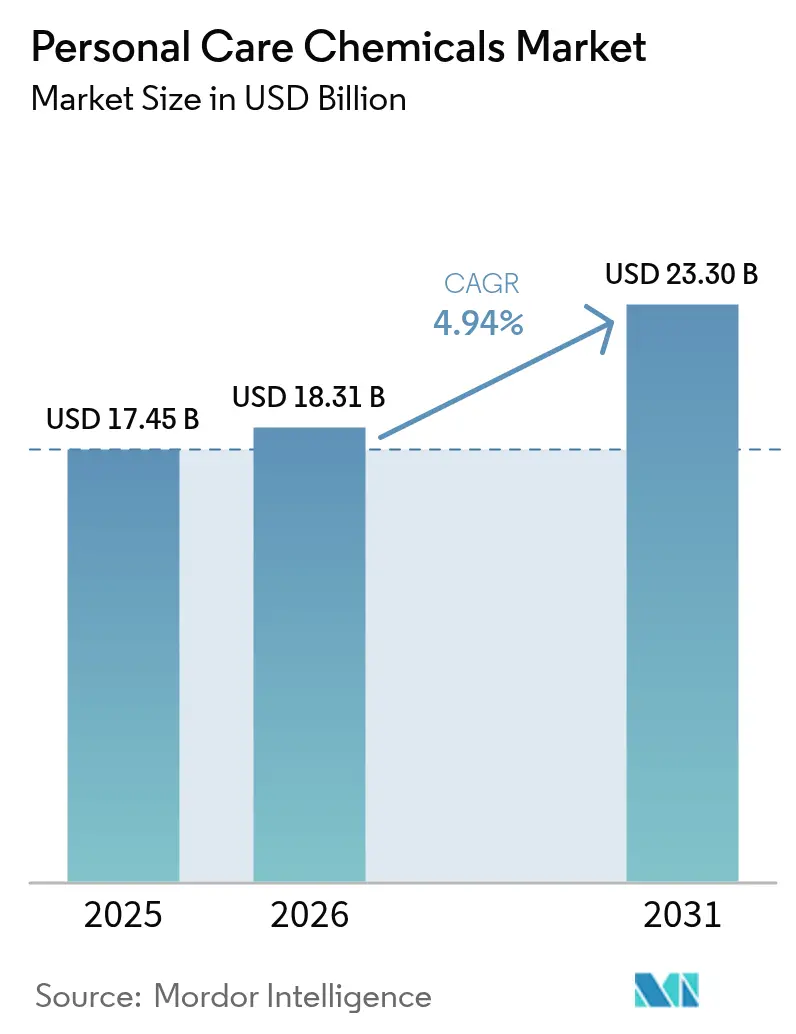
| Market Size (2026) | USD 18.31 Billion |
| Market Size (2031) | USD 23.30 Billion |
| Growth Rate (2026 - 2031) | 4.94% CAGR |
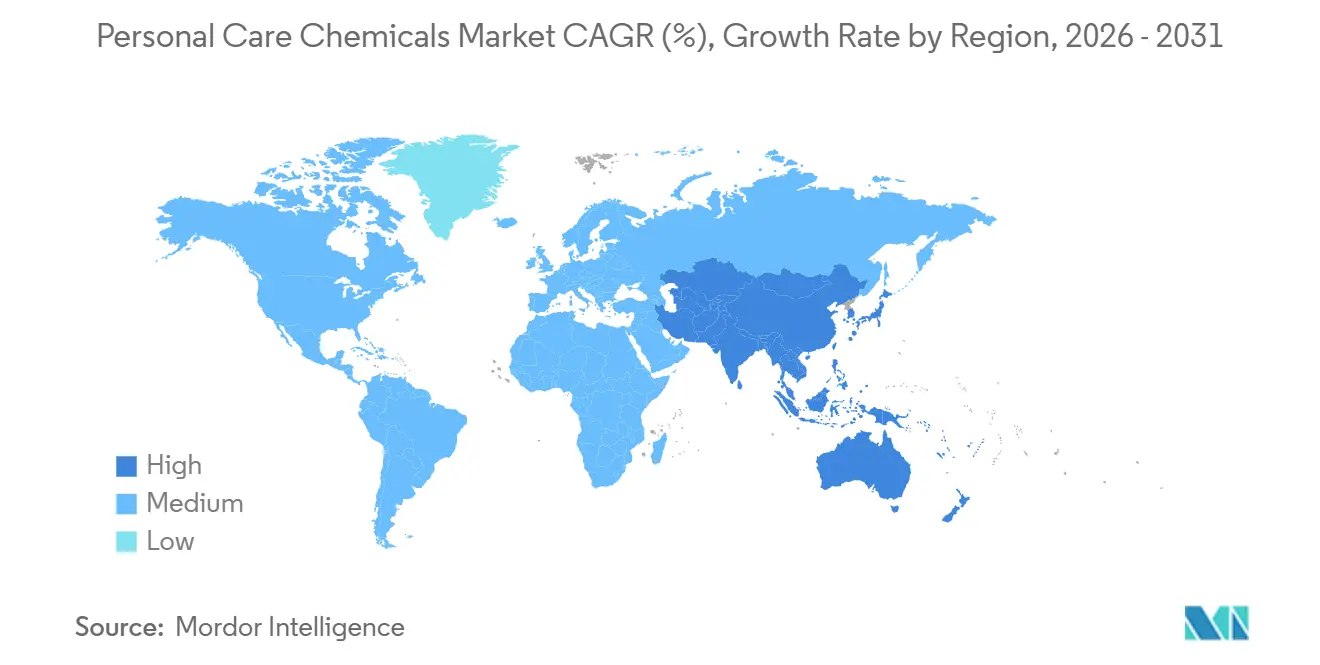
| Fastest Growing Market | Asia Pacific |
| Largest Market | Asia Pacific |
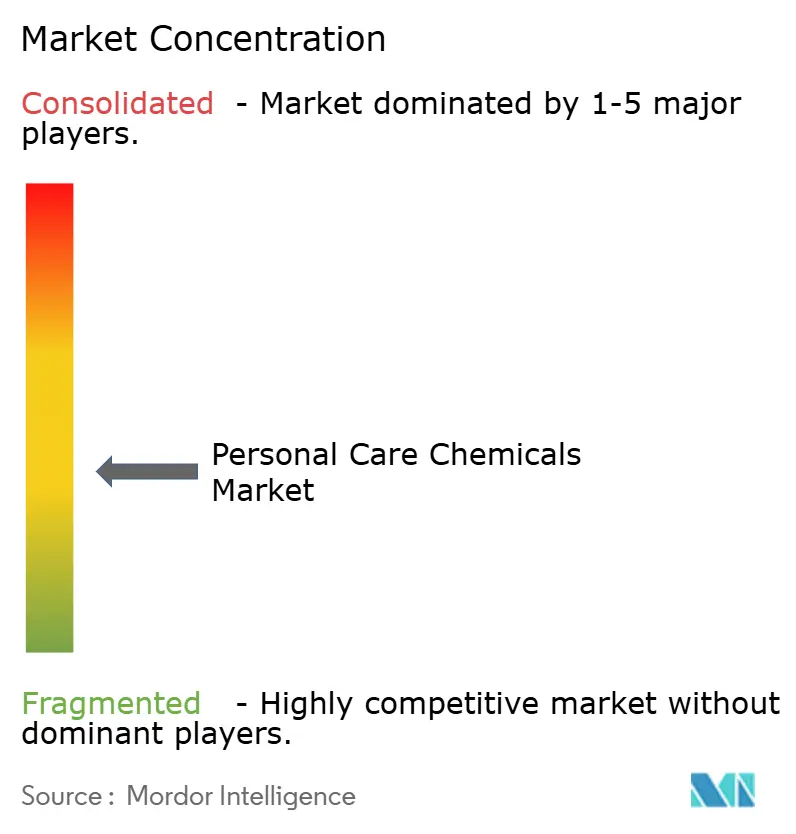
| Market Concentration | Medium |
Major Players *Disclaimer: Major Players sorted in no particular order Image © Mordor Intelligence. Reuse requires attribution under CC BY 4.0. | |
Personal Care Chemicals Market Analysis by Mordor Intelligence
The Personal Care Chemicals Market size is expected to increase from USD 17.45 billion in 2025 to USD 18.31 billion in 2026 and reach USD 23.30 billion by 2031, growing at a CAGR of 4.94% over 2026-2031. Brands are tilting their ingredient budgets toward clinically validated actives, which explains why active-ingredient demand is rising faster than inactives, even though surfactants, emulsifiers, and emollients still dominate formulation volumes. Asia-Pacific’s expanding middle class, streamlined Chinese registration rules, and K-beauty exports underpin regional leadership, while North American and European players absorb compliance costs tied to MoCRA and updated EU Cosmetics Regulation requirements. Feedstock price swings for palm derivatives and ethylene oxide continue to squeeze margins for commodity surfactant suppliers, accelerating the shift toward fermentation-based actives that offer lower carbon footprints and steadier input costs. At the same time, e-commerce beauty brands source specialty actives in smaller lots, rewarding flexible suppliers with digital ordering portals and just-in-time logistics.
Key Report Takeaways
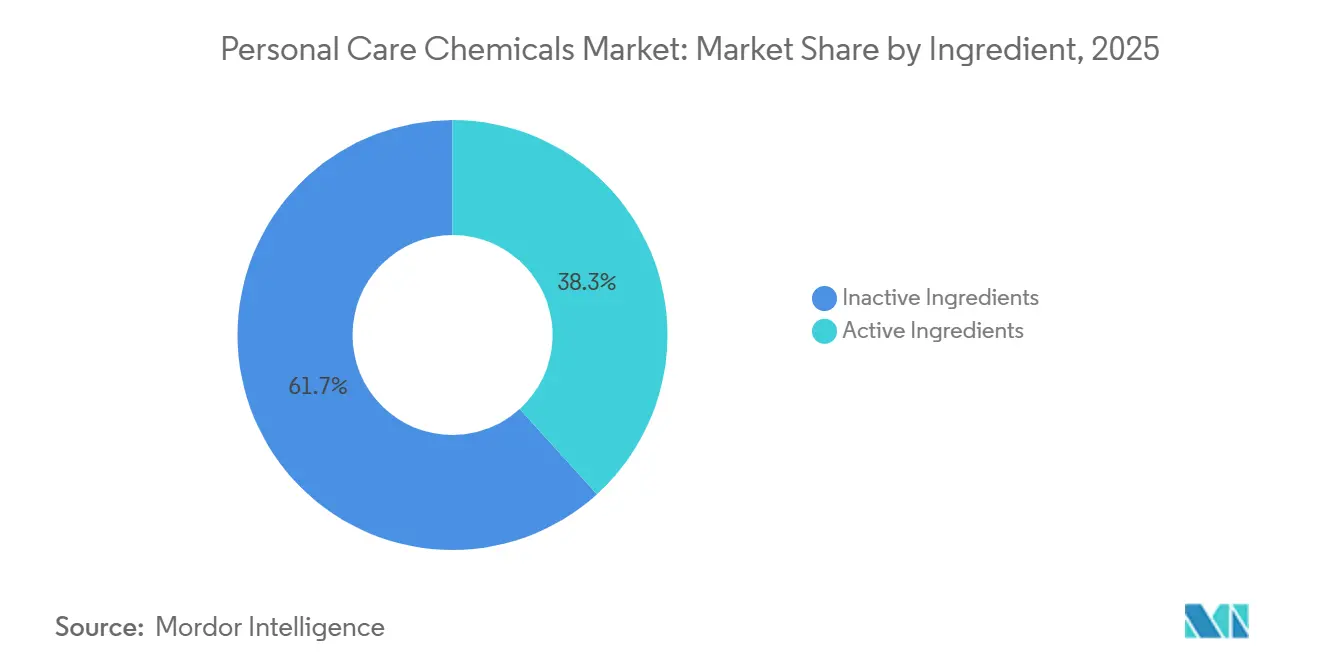
- By ingredient, inactive ingredients led with 61.72% of personal care chemicals market share in 2025; active ingredients are projected to expand at a 5.31% CAGR through 2031.
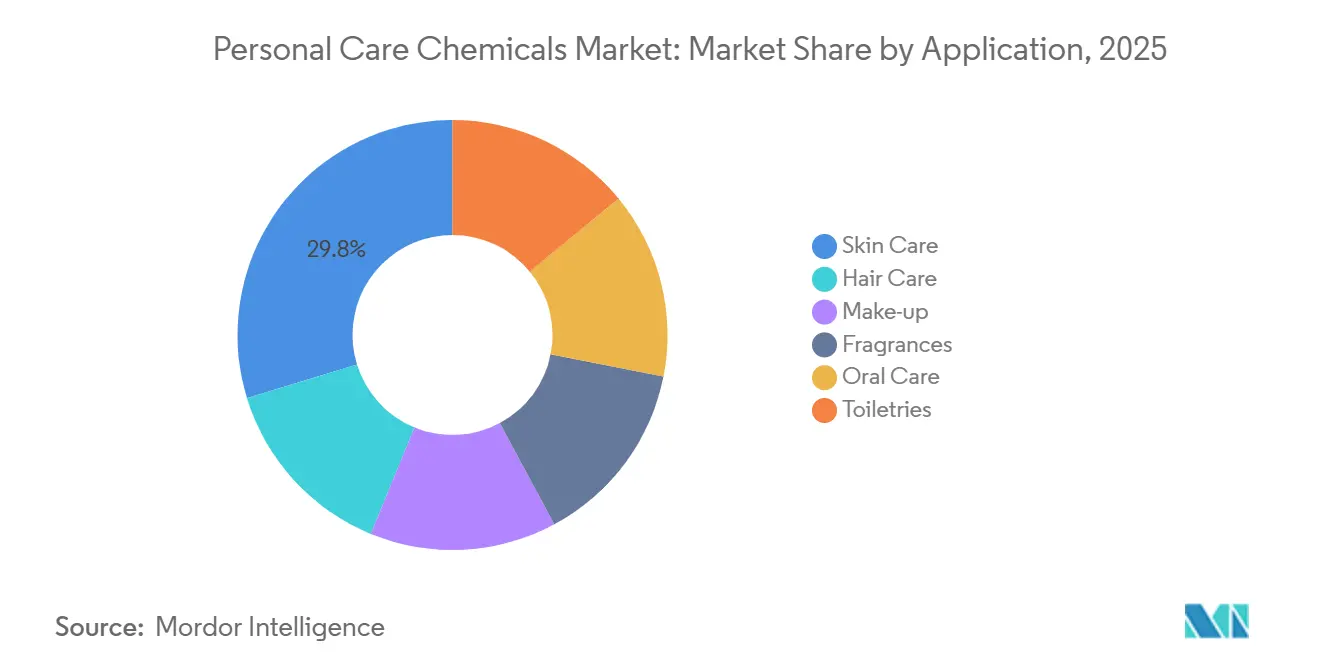
- By application, skin care held 29.75% of personal care chemicals market size in 2025, and oral care is advancing at a 5.46% CAGR through 2031.
- By geography, Asia-Pacific accounted for 30.21% of personal care chemicals market value in 2025, while the region is forecast to grow at a 6.12% CAGR to 2031.
Note: Market size and forecast figures in this report are generated using Mordor Intelligence’s proprietary estimation framework, updated with the latest available data and insights as of 2026.
Global Personal Care Chemicals Market Trends and Insights
Drivers Impact Analysis*
| Driver | (~) % Impact on CAGR Forecast | Geographic Relevance | Impact Timeline |
|---|---|---|---|
| Asia-Pacific middle-class spending boom | +1.2% | Asia-Pacific core, spill-over to MEA | Medium term (2-4 years) |
| Natural and sustainable ingredient shift (RSPO, COSMOS) | +0.9% | Global, with early gains in Europe and North America | Long term (≥ 4 years) |
| E-commerce acceleration of niche beauty brands | +0.7% | Global, concentrated in North America, Europe, China | Short term (≤ 2 years) |
| AI-driven formulation and predictive toxicology | +0.5% | North America and EU, expanding to Asia-Pacific | Medium term (2-4 years) |
| Fermentation-based carbon-upcycled actives | +0.6% | Global, led by North America and Europe | Long term (≥ 4 years) |
| Source: Mordor Intelligence | |||
Asia-Pacific Middle-Class Spending Boom
Urban household disposable income in India and China rose 7-9% annually during 2024-2025, lifting per-capita spending on premium skin-care and color-cosmetics products that rely on niacinamide, tranexamic acid, and encapsulated retinol. South Korea’s K-beauty exports increased 14% in 2025, driving peptide and centella asiatica orders across ASEAN markets. Japan’s functional-cosmetics category—which requires quasi-drug approval—grew 11% in 2024, steering suppliers toward clinical-grade actives that meet MHLW standards. The ISO 22716 GMP framework is gaining traction region-wide, smoothing multi-country product registrations. Collectively, these shifts underpin the personal care chemicals market’s fastest regional expansion.
Natural and Sustainable Ingredient Shift (RSPO, COSMOS)
RSPO-certified palm-derived inputs reached 1.2 million metric tons in 2024 after L’Oréal, Unilever, and Procter & Gamble pledged 100% certification by 2026. COSMOS approvals climbed 22% in 2025, prompting BASF to invest EUR 50 million in bio-based surfactant capacity at Ludwigshafen[1]BASF SE, “BASF Expands Bio-Based Surfactant Capacity,” basf.com . Croda’s 2024 acquisition of Alban Muller secured upcycled plant actives from grape pomace and olive-mill waste, broadening its sustainable portfolio. Brands now ask for carbon-footprint data at the ingredient level, a transparency leap that favors suppliers with integrated traceability platforms. EU Ecolabel and REACH updates reinforce this trajectory in Europe.
E-Commerce Acceleration of Niche Beauty Brands
Digitally native beauty brands captured 28% of U.S. prestige sales in 2025, and suppliers report typical 200-500 kg specialty-active orders versus multi-ton legacy CPG volumes. Seppic’s 2025 digital portal lets formulators filter by COSMOS status and carbon footprint, trimming sample cycles from weeks to days. Ingredient origin disclosure by brands such as The Ordinary pressures peers to match transparency, while MoCRA’s ingredient-listing rule cements this practice in the United States. The result is a faster product-development cadence that rewards agile chemical manufacturers within the personal care chemicals market.
AI-Driven Formulation and Predictive Toxicology
L’Oréal’s internal SimplifIA tool processed 40,000 formulation permutations in 2024, cutting launch timelines by six months. Shiseido’s January 2025 collaboration with IBM Research applies quantum-inspired algorithms to predict skin penetration of novel peptides, improving candidate selection. Unilever’s Digital Twin simulates ingredient interactions to reduce physical prototyping by 30-40%. Predictive toxicology models draw on OECD QSAR datasets and in-vitro assays, enabling earlier screening of sensitizers, while ISO 10993 and REACH provide reference frameworks. These advances shrink cost and risk across the personal care chemicals market.
Restraints Impact Analysis*
| Restraint | (~) % Impact on CAGR Forecast | Geographic Relevance | Impact Timeline |
|---|---|---|---|
| Petro-derivative cost volatility | -0.8% | Global, acute in Asia-Pacific manufacturing hubs | Short term (≤ 2 years) |
| Water-scarcity limits on rinse-off formats | -0.4% | Middle-East, North Africa, Western US, Australia | Medium term (2-4 years) |
| Traceability mandates (MoCRA-style) squeezing SME margins | -0.5% | North America, expanding to EU and Asia-Pacific | Short term (≤ 2 years) |
| Source: Mordor Intelligence | |||
Petro-Derivative Cost Volatility
Palm-oil prices ranged between USD 950 and USD 1,180 per metric ton during 2024-2025, driven by Indonesia’s biodiesel mandate and El Niño yield losses, raising costs for sodium lauryl sulfate and other palm-kernel-based surfactants. Ethylene oxide spot spikes added pressure to ethoxylated emulsifiers, and Stepan’s surfactant margin dropped 240 basis points in 2024. Larger suppliers hedge volatility, but smaller formulators often pass costs to consumers or exit, accelerating consolidation such as Nouryon’s 2024 purchase of two Southeast Asian toll manufacturers. Bio-based surfactants offer a partial buffer but remain premium-priced for mass-market products.
Water-Scarcity Limits on Rinse-Off Formats
Municipal water restrictions in California, South Africa, and Gulf states spur reformulation of shampoos, body washes, and cleansers into waterless bars, powders, and concentrates, cutting consumer water use 50-70%. Procter & Gamble’s Waterless line debuted in 2024 with solid shampoo bars, while Kao introduced 5× concentrate refills that reduce plastic by 60% per use. These formats boost demand for emollients and powder surfactants, shifting the ingredient mix inside the personal care chemicals market. ISO 14046 water-footprint disclosures and CDP Water Security reporting underscore the urgency.
*Our forecasts treat driver/restraint impacts as directional, not additive. The impact forecasts reflect baseline growth, mix effects, and variable interactions.
Segment Analysis
By Ingredient: Biotech Actives Narrow the Growth Gap with Commodity Surfactants
Inactive ingredients captured 61.72% of personal care chemicals market value in 2025, led by surfactants, emulsifiers, and emollients that supply critical cleansing, stabilization, and sensorial functions. Emulsifiers such as polysorbates and glyceryl stearates stabilize oil-in-water creams, while emollients—fatty alcohols, esters, and silicones—deliver glide and barrier repair. Rising consumer preference for clean-label cosmetics is pushing the shift from synthetic colorants toward natural beetroot and turmeric pigments, especially in Europe and North America. Rheology modifiers, including carbomers and xanthan gum, maintain viscosity across a wide pH range.
Active ingredients, forecast to grow at 5.31% CAGR, are closing the revenue gap as brands emphasize clinical efficacy. Conditioning agents such as quats and silicone derivatives remain staples for hair-care products, and bond-repair polymer adoption has expanded beyond salon channels. UV filters command premium pricing; regulatory scrutiny of avobenzone and octocrylene is hastening mineral alternative uptake. Powerful anti-aging actives—retinoids, peptides, niacinamide, antioxidants—win price premiums because they deliver measurable benefits, as shown by Croda’s Matrigenics.14G peptide improving skin elasticity by 23% in a 12-week trial. Exfoliants such as alpha- and beta-hydroxy acids are thriving in Asia-Pacific brightening regimens. ISO 22716 and COSMOS certifications increasingly shape procurement decisions, aligning suppliers with premium-brand expectations for safety and sustainability within the personal care chemicals market.


By Application: Oral Care Actives and Skin Care Peptides Lead Growth Trajectories
Skin care accounted for 29.75% of personal care chemicals market value in 2025 as premium serums, sunscreens, and moisturizers adopt encapsulated peptides, ceramides, and multiple-weight hyaluronic acids to enhance efficacy. Hair care demand is boosted by scalp-microbiome actives and bond-building polymers that restore chemically treated hair. Makeup uses pigments, film formers, and plant-based waxes, and clean-beauty claims are driving the replacement of synthetic colorants with iron oxides and mica blends. Fragrance remains niche by volume but demands high-purity essential oils; Symrise’s naturals business rose 12% in 2024.
Oral care is the fastest-growing application at a 5.46% CAGR, reflecting uptake of fluoride alternatives such as nano-hydroxyapatite and PAP whitening enzymes. Probiotic toothpastes featuring Lactobacillus strains gain traction in Japan and South Korea, while mouthwashes incorporate cetylpyridinium chloride for antibacterial action. Toiletries—deodorants, bath products, intimate hygiene—benefit from aluminum-free antiperspirants and pH-balanced actives. Regulatory monographs from the FDA and EU Cosmetics Annex III steer formulation boundaries, but rising consumer awareness of ingredient safety continues to influence the direction of the personal care chemicals market.

Geography Analysis
Asia-Pacific contributed 30.21% of personal care chemicals market value in 2025 and is set to grow at 6.12% CAGR, fueled by income growth, urbanization, and regulatory streamlining. China’s 2024 NMPA reforms waived animal testing for many imported products when ISO 22716 is in place, accelerating ingredient launches[2]National Medical Products Administration, “2024 Cosmetics Supervision Regulation Update,” nmpa.gov.cn . India’s cosmetics sales grew 11% in 2024, and local brands increasingly procure sustainable turmeric and neem actives, while global suppliers invest in bio-based surfactant plants to meet large rinse-off demand. South Korea’s K-beauty exports and Japan’s quasi-drug approvals propel demand for clinical-grade actives across ASEAN, where Solvay and Nouryon recently added capacity. Contract manufacturing hubs in Thailand and Vietnam cater to regional and Australian requirements, and ISO 22716 certification is becoming a passport for premium-brand entry.
North America remains an innovation center, though growth trails global averages. MoCRA mandates facility registration and adverse-event reporting, adding 8-12% compliance overhead for mid-tier formulators. California’s Proposition 65 and forthcoming New York disclosure rules increase state-level complexity, while Canadian harmonization supports cross-border trade. Europe’s REACH and Cosmetics Regulation continue to shape global standards; recent restrictions on octocrylene, homosalate, and parabens pivot R&D toward mineral UV filters and microbiome-friendly preservatives. Germany, France, and the United Kingdom spearhead RSPO adoption, and Nordic countries pioneer waterless formats and circular-economy sourcing.
South America and Middle-East and Africa contribute smaller share but show niche potential. Brazil’s ingredient imports are growing, supporting textured-hair surfactants and conditioning agents. Argentina’s volatile macro climate curbs demand, but local soy- and sunflower-based surfactants serve regional needs. Gulf Cooperation Council markets combine high disposable income with halal and water-conservation priorities, boosting anhydrous formats suited to arid climates. South Africa’s brands exploit indigenous botanicals such as marula and rooibos for local and export use, reinforcing biodiversity as a differentiator in the personal care chemicals market.

Competitive Landscape
The personal care chemicals market displays moderate concentration: the top 5 suppliers—BASF, Croda, Evonik, Dow, and Ashland—held roughly 42% revenue share in 2025. Incumbents are buying sustainable-ingredient specialists to secure COSMOS and RSPO portfolios, epitomized by Croda’s 2024 purchase of Alban Muller. Biotech startups like Amyris, Genomatica, and Geltor commercialize fermentation-derived squalene, collagen, and peptides at near-petrochemical cost, eroding legacy advantages. Technology platforms are decisive: L’Oréal’s SimplifIA and Unilever’s Digital Twin shorten formulation cycles, allowing proprietary blends that lock rivals out of fast-moving niches. Regulations favor vertically integrated players with full traceability, and smaller surfactant and emollient manufacturers face margin pressure that may accelerate further consolidation.
Patent filings in encapsulation and peptide synthesis jumped 18% during 2024-2025, signaling intensifying R&D competition. ISO TC 217 and ASTM develop test methods for microbiome safety and biodegradability, shaping next-generation ingredient standards. White-space opportunities persist in reef-safe UV filters, microbiome-friendly preservatives, and waterless-format actives where supply is tight and demand robust. Given that the combined top-five share remains below 50%, the competitive field is dynamic but not dominated by a single firm, sustaining healthy innovation within the personal care chemicals market.
Personal Care Chemicals Industry Leaders
BASF
Dow
Evonik Industries AG
Croda International Plc
Ashland
- *Disclaimer: Major Players sorted in no particular order

Recent Industry Developments
- April 2025: BASF launched natural-based, certified sustainable surfactant Dehyton PK45 (Cocamidopropyl Betaine), to address the increasing demand for eco-friendly, biodegradable, and renewable personal care ingredients. This surfactant, derived from Rainforest Alliance Certified coconut oil, provided excellent foaming properties for shampoos, shower gels, and skin cleansers, promoting responsible and sustainable beauty practices.
- April 2025: Clariant introduced a new rheology modifier designed to address challenges in sunscreen formulations by offering enhanced stability, SPF performance, and improved sensory properties. Intended for sun protection products and daily UV protection, Aristoflex SUN stabilizes UV filters while facilitating light and fresh textures.


Global Personal Care Chemicals Market Report Scope
Personal care chemicals are products that are used in various homecare and personal care products. These chemicals are widely used for skincare, hair care, cleanliness, and hygiene, among others. The personal care chemicals portfolio includes ingredients such as preservatives, emulsifiers, mild surfactants, actives, pearlized, and many more.
The personal care chemicals market is segmented by ingredient, application, and geography. By ingredient, the market is segmented into inactive ingredients and active ingredients. Inactive ingredients are further segmented into surfactants, emulsifiers, emollients, colorants and preservatives, rheology control agents, and other inactive ingredients. Active ingredients are further segmented into conditioning agents, UV ingredients, anti-ageing agents, exfoliants, and other active ingredients. By application, the market is segmented into skin care, hair care, make-up, fragrances, oral care, and toiletries. The report also covers the market size and forecasts for the personal care chemicals in 16 countries across major regions. For each segment, the market sizing and forecasts have been done on the basis of value (USD).
| Inactive Ingredients | Surfactants |
| Emulsifiers | |
| Emollients | |
| Colorants and Preservatives | |
| Rheology Control Agents | |
| Other Inactive Ingredients | |
| Active Ingredients | Conditioning Agents |
| UV Ingredients | |
| Anti-ageing Agents | |
| Exfoliants | |
| Other Active Ingredients |
| Skin Care |
| Hair Care |
| Make-up |
| Fragrances |
| Oral Care |
| Toiletries |
| Asia-Pacific | China |
| India | |
| Japan | |
| South Korea | |
| ASEAN Countries | |
| Rest of Asia-Pacific | |
| North America | United States |
| Canada | |
| Mexico | |
| Europe | Germany |
| United Kingdom | |
| France | |
| Spain | |
| Italy | |
| NORDIC Countries | |
| Rest of Europe | |
| South America | Brazil |
| Argentina | |
| Rest of South America | |
| Middle-East and Africa | Saudi Arabia |
| South Africa | |
| Rest of Middle-East and Africa |
| By Ingredient | Inactive Ingredients | Surfactants |
| Emulsifiers | ||
| Emollients | ||
| Colorants and Preservatives | ||
| Rheology Control Agents | ||
| Other Inactive Ingredients | ||
| Active Ingredients | Conditioning Agents | |
| UV Ingredients | ||
| Anti-ageing Agents | ||
| Exfoliants | ||
| Other Active Ingredients | ||
| By Application | Skin Care | |
| Hair Care | ||
| Make-up | ||
| Fragrances | ||
| Oral Care | ||
| Toiletries | ||
| By Geography | Asia-Pacific | China |
| India | ||
| Japan | ||
| South Korea | ||
| ASEAN Countries | ||
| Rest of Asia-Pacific | ||
| North America | United States | |
| Canada | ||
| Mexico | ||
| Europe | Germany | |
| United Kingdom | ||
| France | ||
| Spain | ||
| Italy | ||
| NORDIC Countries | ||
| Rest of Europe | ||
| South America | Brazil | |
| Argentina | ||
| Rest of South America | ||
| Middle-East and Africa | Saudi Arabia | |
| South Africa | ||
| Rest of Middle-East and Africa | ||


Key Questions Answered in the Report
What is the projected size of the personal care chemicals market by 2031?
The market is forecast to reach USD 23.30 billion by 2031, expanding at a 4.94% CAGR during 2026-2031.
Why is Asia-Pacific the fastest-growing region for personal care chemicals?
Rising disposable income, streamlined Chinese NMPA rules, and robust K-beauty exports are propelling a 6.12% regional CAGR through 2031.
What regulatory changes are most affecting North American suppliers?
The Modernization of Cosmetics Regulation Act (MoCRA) requires U.S. facility registration by the end of 2024 and mandates adverse-event reporting starting 2025, adding 8-12% compliance overhead for mid-tier formulators.
Which application segment is expected to record the highest CAGR through 2031?
Oral care leads with a 5.46% CAGR on the back of fluoride alternatives, probiotic actives, and new whitening technologies.
Page last updated on:


