Ammonium Nitrate Market Size and Share
Market Overview
| Study Period | 2021 - 2031 |
|---|---|
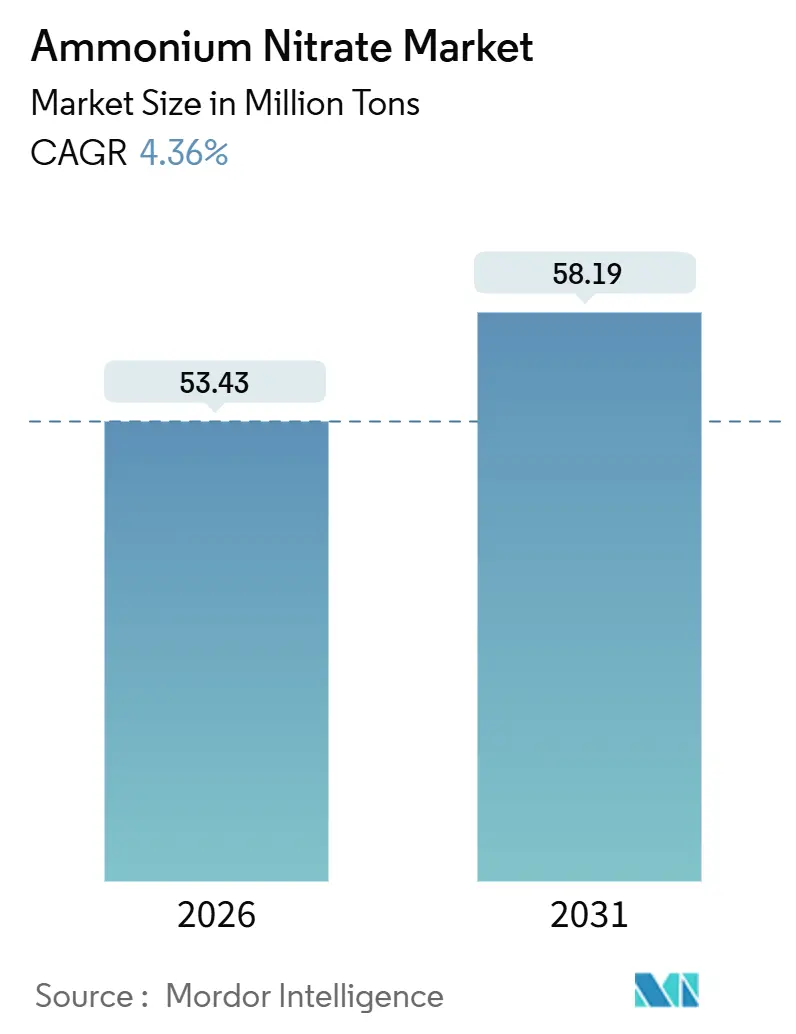
| Market Volume (2026) | 53.43 Million tons |
| Market Volume (2031) | 58.19 Million tons |
| Growth Rate (2026 - 2031) | 4.36% CAGR |
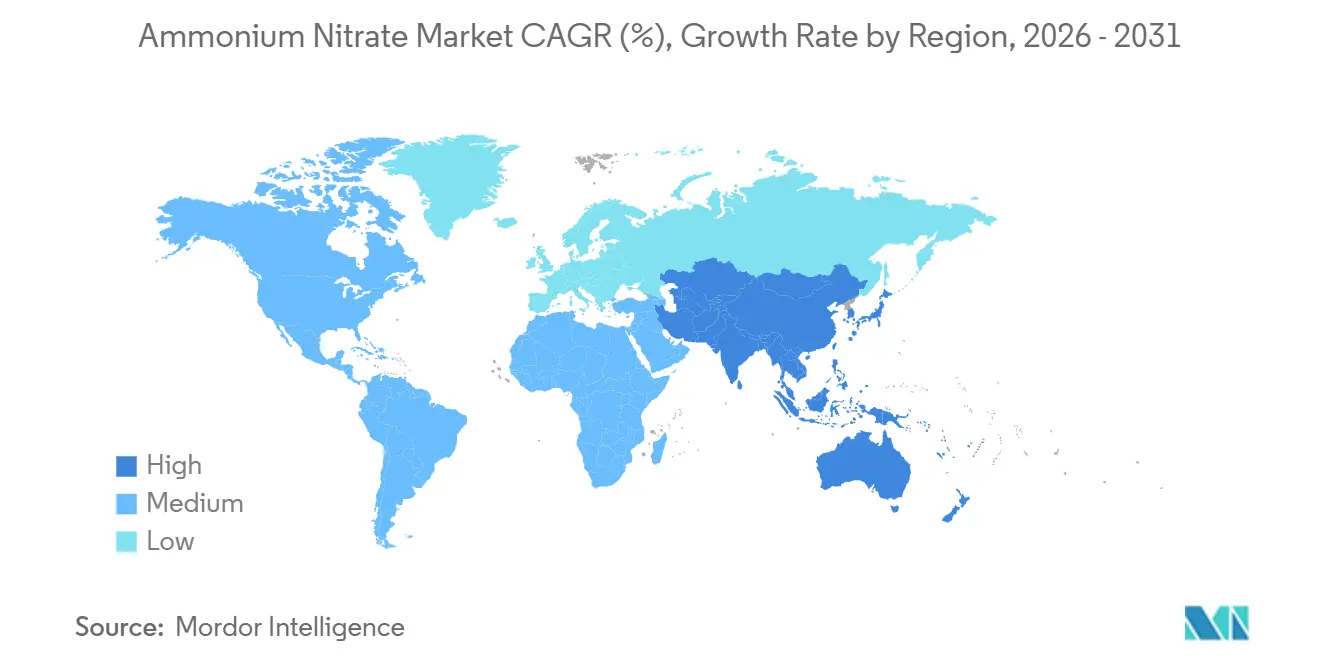
| Fastest Growing Market | Asia Pacific |
| Largest Market | Asia Pacific |
| Market Concentration | Medium |
Major Players *Disclaimer: Major Players sorted in no particular order Image © Mordor Intelligence. Reuse requires attribution under CC BY 4.0. | |
Ammonium Nitrate Market Analysis by Mordor Intelligence
The Ammonium Nitrate Market size is estimated at 53.43 Million tons in 2026, and is expected to reach 58.19 Million tons by 2031, at a CAGR of 4.36% during the forecast period (2026-2031). The ammonium nitrate market is responding to tighter carbon-border policies, localized explosive production near emerging copper and nickel hubs, and precision-agriculture adoption that favors coated granules with slower nutrient release. Mining operators are specifying higher-energy blends to unlock deeper ore bodies, while blue and green ammonia projects are reshaping the cost curve for downstream nitrates qualifying for embedded-carbon reporting. Incumbents such as Yara, CF Industries, and OCI are funneling capital into low-emission feedstock to defend their positions, as regional disruptors build smaller, flexible units that serve niche regenerative programs and defense channels. The ammonium nitrate market continues to balance growth in Asia-Pacific and South America against regulatory headwinds in North America and Europe.
Key Report Takeaways
- By application, fertilizers led the ammonium nitrate market share with 75.67% volume share in 2025; explosives are forecast to expand at a 4.91% CAGR through 2031.
- By form, porous prills accounted for a 60.25% share of the ammonium nitrate market size in 2025, while granular products are set to grow at a 5.66% CAGR.
- By grade, agricultural grade commanded 77.14% share of the ammonium nitrate market size in 2025; industrial grade is tracking the fastest CAGR at 4.89% to 2031.
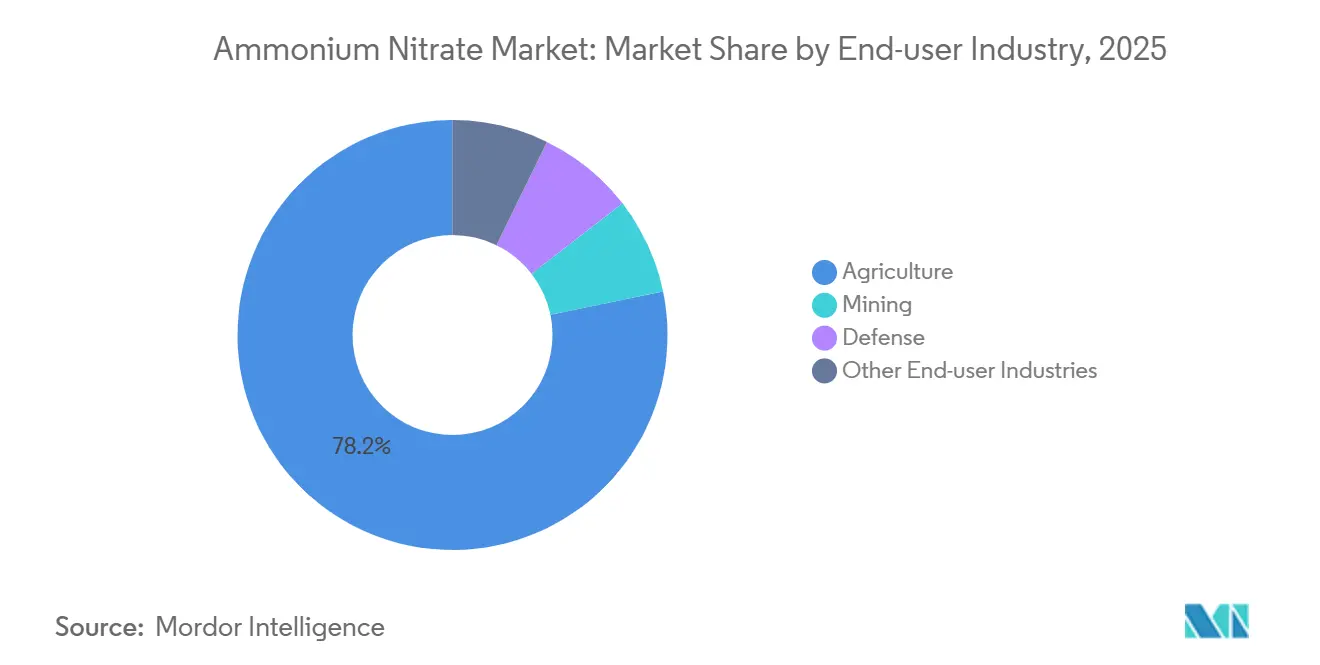
- By end-user industry, agriculture captured 78.24% of the ammonium nitrate market share in 2025, whereas mining is advancing at a 5.25% CAGR through 2031.
- By geography, Asia-Pacific held 45.46% of the ammonium nitrate market share in 2025 and is projected to post the highest regional CAGR of 5.01% between 2026-2031.
Note: Market size and forecast figures in this report are generated using Mordor Intelligence’s proprietary estimation framework, updated with the latest available data and insights as of January 2026.
Global Ammonium Nitrate Market Trends and Insights
Driver Impact Analysis*
| Driver | (~) % Impact on CAGR Forecast | Geographic Relevance | Impact Timeline |
|---|---|---|---|
| Expansion of ANFO and emulsion explosives in large-scale surface mining | +1.2% | Asia-Pacific, South America, Middle East & Africa | Medium term (2-4 years) |
| Increasing demand for fertilizers in global agriculture | +1.0% | Global, with concentration in Asia-Pacific | Long term (≥ 4 years) |
| Decarbonised-ammonia projects spurring low-carbon nitrate adoption | +0.8% | Europe, North America, Middle East | Long term (≥ 4 years) |
| Surge in calcium-ammonium-nitrate demand from regenerative farming programs | +0.6% | Europe, North America | Medium term (2-4 years) |
| Rising controlled-blasting activity for shale-oil pipeline retrofits | +0.4% | North America | Short term (≤ 2 years) |
| Source: Mordor Intelligence | |||
Expansion of ANFO and Emulsion Explosives in Large-Scale Surface Mining
Surface coal, copper, and lithium operations are turning to higher-energy ANFO and emulsion blends that reduce drilling density and speed up overburden removal, increasing demand for mining explosives and technical-grade ammonium nitrate cons. Orica’s 4D bulk-explosives platform combines emulsion with porous prills, offering variable energy output that tailors fragmentation and minimizes unit cost per ton of rock moved. Indonesia’s nickel laterite projects and Chile’s high-altitude copper pits require 20–30% more ammonium nitrate per ton of ore than older ANFO mixes because water ingress undermines conventional fuel-oil blends. Saudi Arabia’s SCCL plans a 300,000 ton-per-year technical-grade plant at Ras Al Khair, demonstrating how Gulf producers intend to localize explosive inputs and serve African mining ventures. As mines chase higher recovery rates, the ammonium nitrate market benefits from a demand profile that is less price-sensitive than agriculture.
Increasing Demand for Fertilizers in Global Agriculture
Baseline nitrogen demand rises as populations grow, yet regional divergence persists: India’s subsidy regime still favors urea, while Brazil’s Cerrado growers move to calcium-ammonium-nitrate to counter soil acidification. The European Union’s Farm to Fork strategy promotes precision technologies, pushing distributors toward polymer-coated granular ammonium nitrate that cuts leaching losses[1]European Commission, “Farm to Fork Strategy Progress Report 2025,” ec.europa.eu. Argentina’s wheat producers lifted ammonium nitrate purchases 8% in 2025 on currency tailwinds, proving that price swings can override crop-nutrient traditions. The ammonium nitrate market, therefore, hinges on subsidy structures, carbon labeling, and agronomic differentiation rather than bulk nitrogen cost alone. Suppliers that bundle advisory services with coated or CAN products gain pricing power in this uneven policy landscape.
Decarbonised-Ammonia Projects Spurring Low-Carbon Nitrate Adoption
Blue and green ammonia ventures move the ammonium nitrate market toward a two-tier pricing structure as carbon-border adjustments penalize gray feedstock. CF Industries is installing capture units at Donaldsonville and Yazoo City that will abate 2 million tons of CO₂ each year, allowing the firm to brand “blue” ammonium nitrate for CBAM-regulated buyers. Hanwha and INEOS approved a United States blue-ammonia plant exceeding 1 million tons per annum, targeting 2030 start-up and supplying North American nitrate producers affected by emerging disclosure rules. Yara and Lantmännen’s agreement for 50,000 tons per annum of renewable-hydrogen-derived ammonia by 2027 exemplifies the green premium that Northern European distributors accept for climate-neutral labels. As more projects reach financial closure, the ammonium nitrate market gains a low-emission supply path that secures premiums of USD 50–100 per ton in regulated jurisdictions.
Surge in Calcium-Ammonium-Nitrate Demand from Regenerative Farming Programs
Regenerative frameworks prize soil-carbon gains and microbial health, spurring adoption of calcium-ammonium-nitrate that buffers pH and supplies nitrate nitrogen with lower leaching[2]United States Department of Agriculture, “Climate-Smart Commodities Grants 2026,” usda.gov . European distributors logged double-digit volume growth for CAN blends in 2025 as carbon-credit schemes rewarded farmers for reduced nitrous-oxide emissions. In the United States, USD 3 billion in Climate-Smart Commodity grants encourage coated or CAN products that align with emissions metrics. Regional blenders now combine commodity prills with limestone, capturing margin on value-added formulations while easing entry barriers for non-integrated players. The ammonium nitrate market analysis capitalizes on a trend where agronomic functionality overtakes pure cost-per-nitrogen considerations.
Restraint Impact Analysis*
| Restraint | (~) % Impact on CAGR Forecast | Geographic Relevance | Impact Timeline |
|---|---|---|---|
| Stringent regulations on storage and transport of ammonium nitrate | -0.9% | North America, Europe, Asia-Pacific | Short term (≤ 2 years) |
| Availability of substitute nitrogen fertilizers (urea, UAN, urea + NBPT) | -0.7% | Global, with concentration in Asia-Pacific | Medium term (2-4 years) |
| Carbon-border-adjustment costs on high-emission ammonium nitrate | -0.5% | Europe, North America | Medium term (2-4 years) |
| Source: Mordor Intelligence | |||
Stringent Regulations on Storage and Transport of Ammonium Nitrate
Following safety reviews, the US Bureau of Alcohol, Tobacco, Firearms, and Explosives shortened storage thresholds, compelling many rural distributors to drop ammonium nitrate inventories and pivot to UAN. Canada’s Explosives Regulations impose locked magazines and setback distances that hinder on-farm storage, driving growers toward liquid solutions delivered in bulk. Australia’s state zoning rules ban new depots within 500 meters of residences, shrinking distribution in peri-urban belts. While Asia maintains lighter oversight, the added compliance cost in OECD regions diverts 5–10% of nitrogen demand to substitutes. The ammonium nitrate market must therefore navigate uneven regulatory terrain that erodes its broad-acre fertilizer appeal.
Availability of Substitute Nitrogen Fertilizers (Urea, UAN, Urea + NBPT)
Urea capacity expanded by 8 million tons in 2024–2025, largely in the Middle East and North Africa, depressing prices relative to ammonium nitrate. UAN now supplies 40% of US corn nitrogen, up from 35% in 2020, integrating seamlessly with precision equipment and sidestepping ATF compliance. NBPT-treated urea narrows volatilization losses on high-pH soils in Brazil and Argentina, dulling ammonium nitrate’s agronomic edge. Where safety regulations are strict, the total cost of ownership tips toward urea or UAN despite lower nitrogen-use efficiency. Unless carbon-intensity labeling reallocates value to low-emission nitrate, the ammonium nitrate market faces persistent share leakage to these substitutes.
*Our forecasts treat driver/restraint impacts as directional, not additive. The impact forecasts reflect baseline growth, mix effects, and variable interactions.
Segment Analysis
By Application: Explosives Outpace Fertilizers in Growth Velocity
Explosives expand at a 4.91% CAGR, nearly a full point above the overall ammonium nitrate market, while fertilizers grow more slowly due to urea substitution. Copper and nickel mines in Chile, Peru, and Indonesia use emulsion blends that require 25–35% more technical-grade nitrate per blast than conventional ANFO, driving premium demand for porous prills with consistent density.
Fertilizer demand remains dominant in tonnage but is bifurcating: Europe invests in polymer-coated granular nitrate that satisfies nutrient-efficiency mandates, whereas Asia leans on subsidized urea, relegating ammonium nitrate to specialty crops. Explosives, by contrast, remain less price-sensitive because blasting misfires quickly inflate mining costs, allowing suppliers to command USD 20–30 per ton premiums over agricultural-grade product.


By Form: Granular Gains on Precision Agriculture
Granular product is the fastest-growing form at 5.66% CAGR, although porous prills still held 60.25% of volume in 2025 as the feedstock of choice for ANFO. Precision spreaders require uniform particle size, and polymer-coated granules extend nutrient release across 60–90 days, aligning with Europe’s Farm to Fork goals.
Porous prills maintain dominance in explosives thanks to their ability to absorb fuel oil rapidly, ensuring stable detonation velocity in bulk systems. Integrated producers such as Grupa Azoty hedge bets by manufacturing both forms in the same complex, balancing mining exports with coated fertilizer sales in Central Europe.
By Grade: Industrial Specifications Command Premium
Agricultural-grade ammonium nitrate, 77.14% of the 2025 base in the ammonium nitrate market, grows more slowly due to storage-compliance burdens and government support for urea. Saudi Arabia’s planned 300,000 ton-per-year technical-grade plant will serve Gulf mining and East African copper markets, reflecting the geographic shift in premium demand.
Industrial-grade material expands at 4.89% CAGR, capturing clients in mining, defense, and specialty chemicals that demand <0.3% moisture and tight particle tolerances. Mining firms pay USD 30–50 per ton above agricultural grade to guarantee consistent fragmentation performance, while defense contractors require even cleaner feed for solid-rocket propellants.
By End-User Industry: Mining Surges as Agriculture Plateaus
Agriculture still accounts for 78.24% of volume, but grows more slowly because subsidy frameworks in India and storage rules in North America favor urea and UAN. Defense and automotive segments, although under 2%, secure specialized grades and add margin resilience to the ammonium nitrate market.
Mining expands at a 5.25% CAGR through 2031, benefiting from copper, lithium, and coal projects across South America, Asia-Pacific, and Africa. Chile alone consumed nearly 400,000 tons of technical-grade nitrate in 2025, up 50,000 tons from 2023, as operators aligned with electric-vehicle supply chains.
Geography Analysis
Asia-Pacific led the global volume with 45.46% in 2025 and is advancing at a 5.01% CAGR, propelled by China’s technical-grade exports to African and Latin American mines and India’s gradual shift from urea dependence toward differentiated nitrates. China’s coal-based ammonia remains cost-competitive, yet exporters increasingly upgrade to porous prills to capture mining premiums, reinforcing the ammonium nitrate market’s supply pivot toward explosives.
North America held a substantial market volume, but ATF rules curtail on-farm storage, pushing distributors toward bulk UAN even as blue-ammonia projects come online to satisfy CBAM-linked buyers in Europe. Canada’s potash and oil-sands industries sustain regional technical-grade demand that bypasses agricultural headwinds.
Europe grapples with CBAM reporting that penalizes high-emission imports, steering buyers toward domestic low-carbon supply such as Grupa Azoty’s Tarnów plant and Yara’s green-ammonia programs. Southern producers rely on North African imports, while Northern regions invest in carbon-capture retrofits to defend market share.
South America's market volume is driven by Brazil’s soybean expansion and Chile’s copper mining, yet the region lacks integrated capacity and imports porous prills from the Middle East and China, exposing it to freight volatility.
In the Middle East and Africa, Gulf blue-ammonia projects such as QAFCO 7 add 1.2 million tons of low-emission feedstock in 2026, positioning the region as a compliance hedge for European buyers. Saudi Arabia’s forthcoming technical-grade unit and South Africa’s mining uptake round out a diversified demand base.
Mordor Intelligence provides coverage of the ammonium nitrate market across other key regional markets, including Europe and Asia, each with their regulatory frameworks and demand patterns.

Competitive Landscape
The Ammonium Nitrate market is moderately consolidated. Dyno Nobel’s decision to leave fertilizer by September 2026 underscores margin pressure in commodity grades and a strategic tilt toward higher-return explosives. Moreover, blue and green ammonia investments by Qatar, Hanwha, and CF Industries reshape the cost curve, with premiums of USD 50–100 per ton available to certified low-carbon nitrates in CBAM markets. Regional blenders exploiting regenerative-farming niches and localized explosives distributors serving remote mining basins add competitive dynamism beneath the top tier.
Ammonium Nitrate Industry Leaders
URALCHEM JSC
CF Industries Holdings, Inc.
Yara
Acron
EuroChem Group
- *Disclaimer: Major Players sorted in no particular order

Recent Industry Developments
- January 2026: Bharat Coal Gasification and Chemicals (BCGCL) awarded an order to Bharat Heavy Electricals (BHEL). The order, as detailed in the letter of acceptance (LoA), concerns the coal gasification and raw syngas cleaning plant (LSTK 1 Package) for BCGCL's Coal to 2000 TPD Ammonium Nitrate Project in Odisha, India.
- November 2025: Gujarat Narmada Valley Fertilizers and Chemicals (GNFC) of India unveiled a project to establish a 163,000 tonne/year ammonium nitrate (AN) melt facility at its Bharuch complex in western Gujarat. With an investment of INR 4.5 billion (USD 50 million), this new plant will nearly double GNFC's AN melt capacity to 338,000 tonnes/year, with operations slated to begin by July 2027.


Research Methodology Framework and Report Scope
Market Definitions and Key Coverage
Our study regards the ammonium nitrate market as the global trade and consumption of the solid salt NH4NO3 in all densities and forms, including porous prill, granular, and liquid solution, sold for fertilizer, mining and quarrying explosives, civil construction blasting agents, cooling packs, gas generators, and other minor industrial uses.
Scope exclusion: calcium-ammonium-nitrate blends and urea-ammonium-nitrate solutions are analyzed separately and not counted inside the core market.
Segmentation Overview
- By Application
- Fertilizers
- Explosives
- Other Application (Gas Generators, Cold Packs, Pyrotechnics, Rocket Propulsion, and Industrial Processes)
- By Form
- Porous Prills
- Granular
- Liquid Solution / Suspension
- By Grade
- Agricultural Grade
- Industrial Grade
- By End-user Industry
- Agriculture
- Mining
- Defense
- Other End-user Industries (Automotive, Food Industry, Oil and Gas, Medical, and Construction)
- By Geography
- Asia-Pacific
- China
- India
- Japan
- South Korea
- ASEAN Countries
- Rest of Asia-Pacific
- North America
- United States
- Canada
- Mexico
- Europe
- Germany
- United Kingdom
- France
- Italy
- Spain
- Nordic Countries
- Rest of Europe
- South America
- Brazil
- Argentina
- Rest of South America
- Middle East and Africa
- Saudi Arabia
- South Africa
- Rest of Middle East and Africa
- Asia-Pacific
Detailed Research Methodology and Data Validation
Primary Research
We interviewed agronomists across India, China, France, and Brazil, procurement heads from bulk explosive contractors in Australia and South Africa, and trade inspectors monitoring hazardous chemicals transport in the United States.
Their insights validated country-level penetration rates, seasonality of fertilizer off-take, and real-world average selling prices, thereby correcting desk-derived assumptions.
Desk Research
Mordor analysts began with official data from sources such as the United Nations Comtrade shipment records, FAO fertilizer consumption tables, US Geological Survey mining explosives releases, and Eurostat production indices, which anchor historical tonnage flows.
Industry associations, including the International Fertilizer Association and the Institute of Makers of Explosives, supplied guideline application rates, ANFO demand factors, and regulatory thresholds that influence apparent consumption.
Company 10-K filings, investor decks, and safety data sheets clarified product densities, average selling prices, and regional capacity shifts.
Subscription databases like D&B Hoovers and Dow Jones Factiva enriched the desk review with plant-specific output figures and transaction news that signposted capacity additions.
This list is illustrative, not exhaustive; many other public and paid references informed gap filling and cross-checks.
Market-Sizing & Forecasting
A top-down reconstruction starts with regional ammonia output, adjusts for nitric acid conversion ratios, import-export balances, and typical nitrate losses, which are then benchmarked against fertilizer application hectares and ANFO usage per ton of ore.
Supplier roll-ups and sampled ASP x volume checks provide a bottom-up lens that tempers the totals.
Key drivers inside the model include farm nitrogen application rates (kg/ha), mining overburden volumes, natural gas-linked ammonia cost curves, and regulatory quantity-distance limits that cap on-site storage.
A multivariate regression, supported by scenario analysis for gas price volatility, produces the 2025-2030 forecast.
Missing datapoints, especially in smaller African economies, are gap-filled using three-year moving averages anchored to correlated crop land and mineral output series.
Data Validation & Update Cycle
Outputs pass variance tests against independent metrics such as ammonia trade totals and explosive detonator shipments.
Senior analysts review anomalies before sign-off.
The model refreshes annually, with mid-cycle updates triggered by plant closures, major price shocks, or regulatory changes; every client delivery undergoes a last-minute data sweep.
Why Mordor's Ammonium Nitrate Baseline Earns Trust
Published figures often diverge because some publishers quote only revenue, others merge related nitrates, and refresh cadences vary; we flag these factors upfront so buyers see where gaps arise.
Benchmark comparison
| Market Size | Anonymized source | Primary gap driver |
|---|---|---|
| 51.23 million tons (2025) | Mordor Intelligence | - |
| USD 20.09 billion (2025) | Regional Consultancy A | Uses uniform global ASP and ignores density variation across grades |
| USD 16.8 billion (2025) | Global Consultancy B | Bundles calcium and urea nitrates with ammonium nitrate |
| USD 6.18 billion (2025) | Trade Journal C | Excludes quarrying explosive demand, covering fertilizer sales only |
The comparison shows that scope discipline, dual-unit reporting, and an annual refresh let Mordor offer a balanced, transparent baseline that decision-makers can trace back to verifiable variables and repeatable steps.


Key Questions Answered in the Report
What is the projected volume for global ammonium nitrate demand by 2031?
It is forecast to reach 58.19 million tons, growing at a 4.36% CAGR from 2026 to 2031.
Which application is expanding faster, fertilizers or explosives?
Explosives lead with a 4.91% CAGR through 2031, outpacing fertilizer growth.
How does Asia-Pacific influence global ammonium nitrate market trade?
The region accounts for 45.46% of 2025 volume and exports technical-grade prills to mining hubs in Africa and Latin America.
Why are blue and green ammonia projects important for nitrate producers?
They provide low-carbon feedstock that secures price premiums in CBAM-regulated markets and shields suppliers from emission penalties.
What regulatory factor most constrains ammonium nitrate use in North America?
Tightened ATF storage thresholds raise compliance costs and push distributors toward UAN and urea.
Page last updated on:


