
Soy Flour Market Size and Share
Market Overview
| Study Period | 2021 - 2031 |
|---|---|
| Market Size (2026) | USD 2.84 Billion |
| Market Size (2031) | USD 3.81 Billion |
| Growth Rate (2026 - 2031) | 6.04 % |
| Fastest Growing Market | North America |
| Largest Market | Asia Pacific |
| Market Concentration | Medium |
Major Players *Disclaimer: Major Players sorted in no particular order Image © Mordor Intelligence. Reuse requires attribution under CC BY 4.0. | |
Soy Flour Market Analysis by Mordor Intelligence
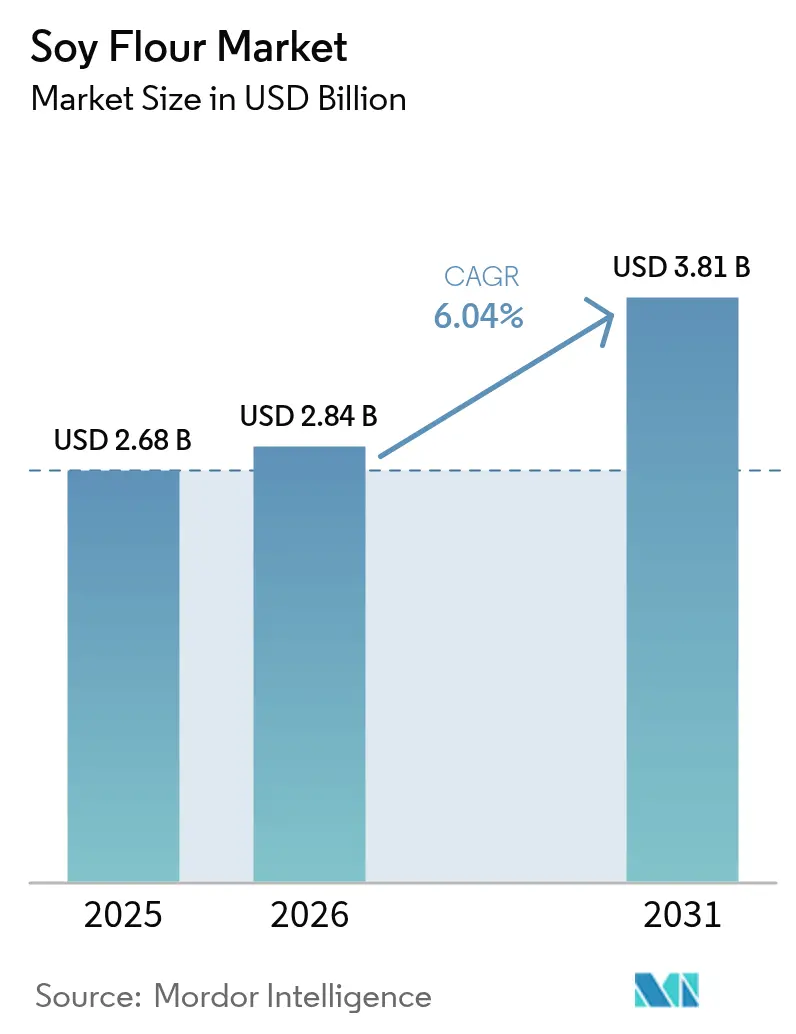
The soy flour market size in 2026 is estimated at USD 2.84 billion, growing from 2025 value of USD 2.68 billion with 2031 projections showing USD 3.81 billion, growing at 6.04% CAGR over 2026-2031. Growing formulation flexibility, traceability programs, and sustainable-sourcing premiums are reinforcing the appeal of soy flour over dairy and animal proteins, even as alternative legume flours vie for share. Defatted grades dominate high-protein foods because of their 50-54% protein content, while full-fat variants satisfy bakers seeking clean-label emulsification and moisture retention. Feed producers are also raising inclusion rates to hedge against fishmeal supply risks, and this dual-channel uptake shields processors from single-segment volatility. Competitive intensity remains moderate; global crushers leverage scale and origination depth, whereas regional mills differentiate through enzyme treatment, fermentation, and non-GMO certification.
Key Report Takeaways
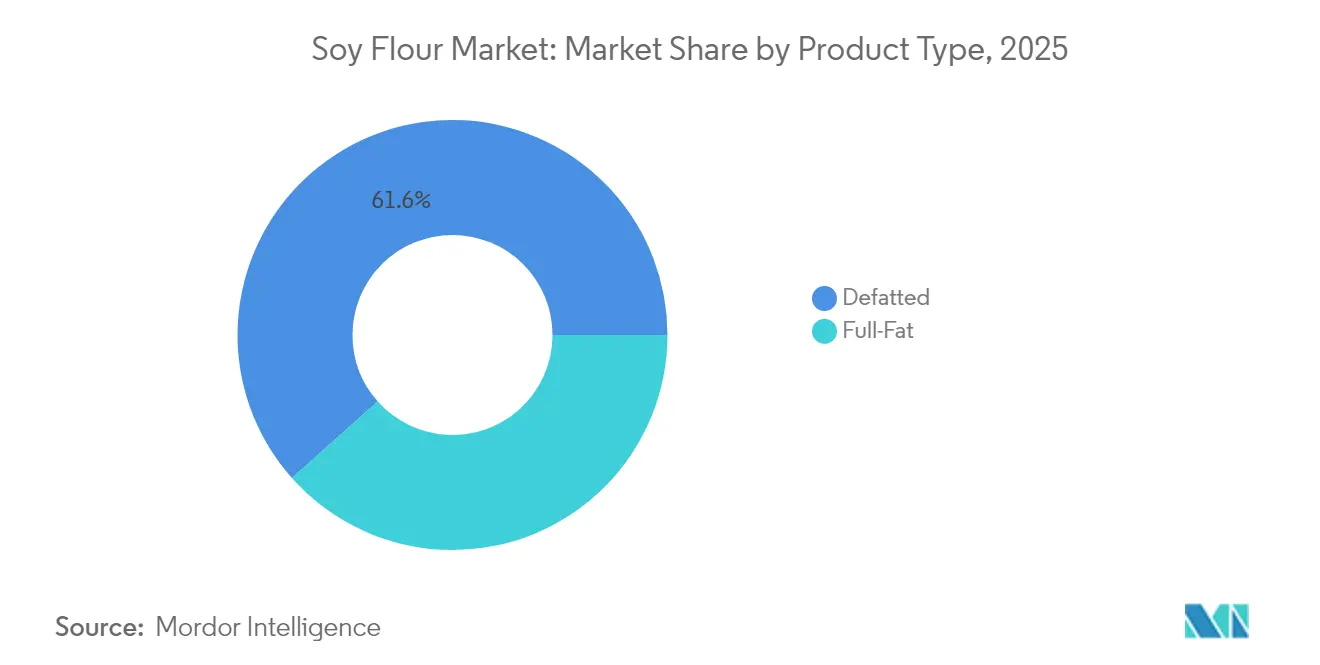
- By product type, defatted grades led with 61.58% of soy flour market share in 2025, while full-fat grades are advancing at an 8.59% CAGR through 2031.
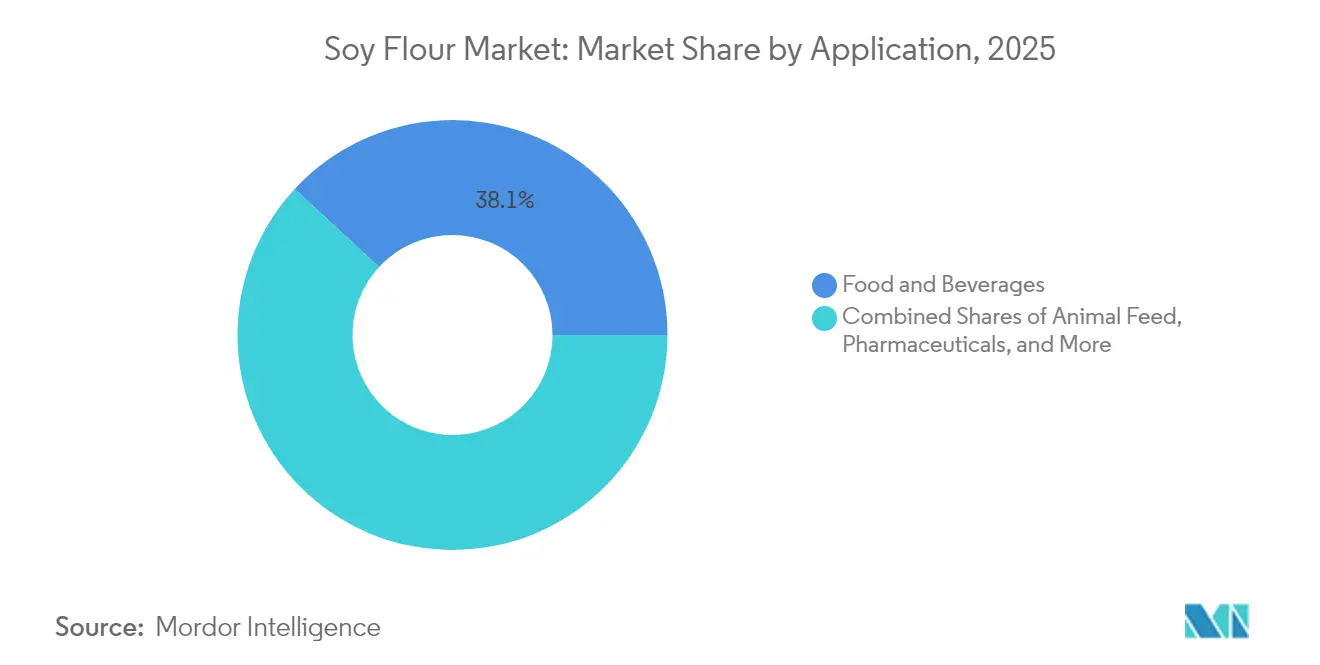
- By application, food and beverages accounted for 38.12% of the soy flour market size in 2025, and animal feed is expanding at a 10.05% CAGR during the forecast period.
- By geography, Asia-Pacific captured 34.26% of 2025 revenue, whereas North America is forecast to grow at a 7.18% CAGR to 2031
Note: Market size and forecast figures in this report are generated using Mordor Intelligence’s proprietary estimation framework, updated with the latest available data and insights as of 2026.
Market Trends and Insights
Drivers Impact Analysis of Soy Flour Market*
| Drivers | (~)% Impact on CAGR Forecasts | Geographic Relevance | Impact Timeline |
|---|---|---|---|
| Rising demand from food manufacturers for high-protein, plant-based ingredients | +1.2% | Global, with concentration in North America and Europe | Medium term (2-4 years) |
| Growth in bakery industry procurement for gluten-free and vegan products | +0.9% | North America, Europe, urban Asia-Pacific | Short term (≤ 2 years) |
| Increasing use in animal feed by livestock producers | +1.5% | Asia-Pacific (China, India), South America | Long term (≥ 4 years) |
| Advancements in processing technologies | +0.7% | Global, early adoption in North America and Europe | Medium term (2-4 years) |
| Research and development investments by suppliers for customized formulations | +0.5% | North America, Europe, select Asia-Pacific markets | Long term (≥ 4 years) |
| Rising applications in nutraceuticals and dietary supplements | +0.6% | North America, Europe, Japan, South Korea | Medium term (2-4 years) |
| Source: Mordor Intelligence | |||
Rising Demand from Food Manufacturers for High-Protein, Plant-Based Ingredients
Food manufacturers are adjusting their protein portfolios to meet consumer demand for plant-based nutrition that provides complete amino acid profiles without the traditional beany off-notes of soy. In 2024, McKinsey reported that 60% of North American food companies have reformulated at least one product line to include plant proteins. Soy flour has become the preferred option due to its affordability, costing between USD 1.20 to USD 1.80 per kilogram compared to USD 4.50 to USD 6.00 for pea protein isolate. Innovations such as enzyme deamidation and high-shear extrusion now allow soy flour to replicate the texture of ground meat in hybrid products. This enables brands to reduce meat content by 30-40% while maintaining sensory appeal. However, this transition is driven more by strategic considerations than altruism. Plant proteins help mitigate risks associated with livestock disease outbreaks and fluctuating feed costs, offering a dual-sourcing strategy that protects manufacturers from single-commodity dependency. Reflecting this trend, The Good Food Institute reported a 23% increase in 2024, with 127 new soy-based meat analog launches compared to 2023, highlighting soy's renewed prominence as formulators achieve taste parity.
Growth in Bakery Industry Procurement for Gluten-Free and Vegan Products
Bakery procurement teams are increasingly using soy flour blends to replace wheat flour, aiming to meet gluten-free and vegan labeling requirements while maintaining dough elasticity and crumb structure. Deloitte's 2024 consumer survey revealed that 34% of European bakery shoppers prioritize gluten-free certification, but 68% avoid products with compromised texture. As a result, bakers are incorporating soy flour at inclusion rates of 10-15%, which helps bind water and emulsify fats. Full-fat soy flour, containing 18-20% lipids, acts as an egg substitute in vegan formulations, reducing ingredient costs by USD 0.08 to USD 0.12 per loaf. Additionally, it creates a softer crumb and extends shelf life by 2-3 days. This shift offers significant cost savings for industrial bakeries: a facility producing 50,000 loaves daily can save USD 146,000 annually by replacing egg-based emulsifiers with full-fat soy flour, assuming a 15% substitution rate. The trend is gaining traction in urban Asia-Pacific markets, where vegan options are marketed as health improvements, broadening their appeal beyond traditional vegetarian consumers.
Increasing Use in Animal Feed by Livestock Producers
Livestock producers are turning to soy flour as a substitute for fishmeal in feed rations, benefiting from its superior amino acid digestibility. In 2024, China utilized 102.7 million metric tons of soybean meal for animal feed, with poultry and swine accounting for 74% of the total. This increase was driven by the recovery from African swine fever and rising protein demand, as reported by the USDA Foreign Agricultural Service[1]Source: USDA Foreign Agricultural Service, “Oilseeds: World Markets and Trade,” fas.usda.gov. Fermented soybean meal, developed using Bacillus subtilis or Aspergillus oryzae, reduces anti-nutritional factors like trypsin inhibitors by 60-80%. This enables feed mills to raise inclusion rates in broiler starter diets from 18% to 25% without affecting growth performance. India's soybean meal production reached 7.85 million metric tons in 2024, with domestic feed consumption at 6.9 million metric tons. Dairy cooperatives are increasingly adopting soy flour, enhancing milk protein yields by 8-12% in high-producing Holstein herds. This shift is driven more by supply security than cost considerations. While aquaculture's dependence on Peruvian anchovy fishmeal exposes feed formulators to El Niño-related catch fluctuations, soy flour provides stable pricing tied to Midwest crop yields.
Advancements in Processing Technologies
Processing innovations are unlocking functional properties in soy flour that previously required chemical modification. High-moisture extrusion, operating at 60-70% moisture and 140-160°C, transforms soy proteins into fibrous structures resembling chicken breast or pulled pork. This advancement enables food manufacturers to achieve a 90% sensory match with animal meat, as demonstrated by blind taste tests conducted by the University of Massachusetts in 2024. Enzyme-assisted hydrolysis, using alcalase or neutrase, breaks peptide bonds to create soy flour with 95% protein solubility at neutral pH, eliminating the chalky mouthfeel found in earlier formulations. In 2024, Cargill launched an innovation center in Singapore focused on applying supercritical CO2 extraction to remove residual hexane from defatted soy flour, meeting clean-label standards without compromising protein yield. Although these advancements are capital-intensive—a single high-moisture extruder costs USD 1.2 to USD 1.8 million—they allow processors to charge a 25-35% price premium for texturized soy flour over commodity-grade meal, making the investment viable for mid-tier mills targeting foodservice channels.
Restraints Impact Analysis of Soy Flour Market*
| Restraints | (~)% Impact on CAGR Forecasts | Geographic Relevance | Impact Timeline |
|---|---|---|---|
| Fluctuating soybean raw material prices | -0.8% | Global, acute in import-dependent regions | Short term (≤ 2 years) |
| Competition from other alternative flours | -0.6% | North America, Europe, urban Asia-Pacific | Medium term (2-4 years) |
| Supply chain inefficiencies from export-import restrictions | -0.4% | Europe, Asia-Pacific (import-dependent nations) | Short term (≤ 2 years) |
| Stringent food safety and GMO regulations | -0.3% | Europe, Japan, South Korea | Long term (≥ 4 years) |
| Source: Mordor Intelligence | |||
Competition from Other Alternative Flours
Pea, chickpea, oat, and almond flours are gaining popularity in applications where soy's allergenic properties or flavor create formulation issues. In sports nutrition, pea protein isolate, though more expensive, is preferred for its neutral taste and hypoallergenic qualities. Oat flour, known for its beta-glucan content and clean-label attributes, dominates the gluten-free baking segment. Louis Dreyfus Company, a key player in the soy industry, is expanding its portfolio with a 2024 investment in a pea protein plant in Saskatchewan, which will have an annual capacity of 75,000 metric tons. Chickpea flour is establishing a strong presence in South Asian and Middle Eastern markets, where its cultural relevance and culinary uses give it an advantage over soy in savory dishes like falafel, pakoras, and flatbreads. The competition is most intense in the premium segment: while organic, non-GMO soy flour commands a 40-50% price premium over conventional options, it still falls behind pea and chickpea flour in consumer perception. Many consumers associate soy with industrial processing and genetic modification. Addressing this perception gap requires more than marketing efforts; it necessitates long-term investment in regenerative agriculture narratives and obtaining third-party certifications to validate environmental and social claims.
Supply Chain Inefficiencies from Export-Import Restrictions
Trade policies and phytosanitary regulations disrupt soy flour supply chains, increasing landed costs and limiting market access for processors without diversified sourcing. Beginning December 2024, the European Union's Deforestation Regulation will require importers to provide geolocation coordinates for soybean farms. Enforced by the European Commission, this regulation adds compliance costs of USD 0.08 to USD 0.12 per kilogram due to the implementation of traceability systems, third-party audits, and satellite imagery verification[2]Source: European Commission, “Regulation on Deforestation-Free Products,” ec.europa.eu. China's import licensing system for soybeans, which prioritizes state-owned crushers, causes significant bottlenecks. Private mills competing for quota allocations experience shipment delays of 4-6 weeks during peak demand periods. Argentina's export taxes on soybean products—30% on beans and 28% on meal and oil—encourage domestic crushing but distort global trade flows. Consequently, processors in importing countries face higher costs for Argentine soy flour, making Brazilian or U.S. alternatives more competitive. These inefficiencies are structural, reflecting ongoing tensions between food security, environmental mandates, and trade liberalization. This indicates that supply chain complexities will continue to pressure margins throughout the forecast period.
*Our forecasts treat driver/restraint impacts as directional, not additive. The impact forecasts reflect baseline growth, mix effects, and variable interactions.
Soy Flour Market Segment Analysis
By Product Type:
Defatted Dominates, while Full-Fat Soy Expected to GrowIn 2025, defatted soy flour accounted for 61.58% of the market, highlighting its critical role in high-protein applications. These applications focus on reducing lipid content to prevent rancidity and extend shelf life. Food manufacturers increasingly prefer defatted grades for products such as meat analogs, protein bars, and fortified cereals. With a protein content of 50-54% on a dry-weight basis, defatted soy flour provides functional benefits—such as water binding, emulsification, and gel formation—without the 18-20% fat content present in full-fat variants. On the other hand, full-fat soy flour, projected to grow at an annual rate of 8.59% through 2031, is gaining traction in the bakery and confectionery sectors. Formulators are utilizing its lecithin content to replace synthetic emulsifiers like mono- and diglycerides, aligning with consumer preferences for simpler ingredient lists.
Full-fat soy flour is experiencing its strongest growth in bakery applications. Its lipid content enhances dough machinability and crumb softness, particularly in high-speed production lines. A 2024 study published in the Journal of Cereal Science demonstrated that substituting 12% full-fat soy flour in white bread formulations increased loaf volume by 8% and reduced the staling rate by 15% over 72 hours, due to lecithin's interaction with gluten networks. For industrial bakeries operating on 12-15% gross margins, this represents a significant reduction in expenses. Regulatory oversight in this segment is minimal, as both defatted and full-fat soy flours are Generally Recognized as Safe (GRAS) under FDA regulations. However, organic and non-GMO certifications increase raw material costs by 30-40%, restricting their use to premium product lines.



By Application:
Food and Beverage Leads, while Animal Feed AcceleratesIn 2025, food and beverage applications represented 38.12% of demand, driven by meat substitutes, bakery products, and soups. However, the animal feed segment recorded the fastest growth, with a 10.05% CAGR, as livestock producers increasingly replaced fishmeal and synthetic amino acids with soy flour. Within the food and beverage sector, meat substitutes stood out as the most dynamic sub-segment. Soy flour's amino acid profile, particularly its lysine and threonine content, complements pea and wheat proteins in hybrid blends. This combination enables formulators to achieve a protein digestibility-corrected amino acid score (PDCAAS) of 0.95-1.0 without relying on soy isolates, which are 2.5-3.0 times more expensive per kilogram. In bakery and confectionery applications, soy flour's water absorption capacity helps reduce dough stickiness and improves machinability in high-speed production lines.
As grain prices rise, poultry and swine producers are increasingly focusing on animal feed applications to optimize feed conversion ratios. A 2024 trial published in Animal Feed Science and Technology demonstrated the advantages of fermented soybean meal, a premium soy flour variant treated with probiotics. This variant reduces gut inflammation in weaned piglets, cutting mortality rates by 3-5% during the critical 21-35 day post-weaning period. Pharmaceuticals and supplements, though capturing a smaller share, are steadily growing as soy peptides find applications in medical nutrition products for managing sarcopenia and cachexia. Other applications, including textiles, cosmetics, and personal care, remain niche. However, soy protein's film-forming properties are gaining traction in biodegradable packaging, where it serves as a substitute for petroleum-based polymers in coatings for paperboard and molded fiber products.
Geography Analysis
APAC, North America and Europe Soy Flour Market
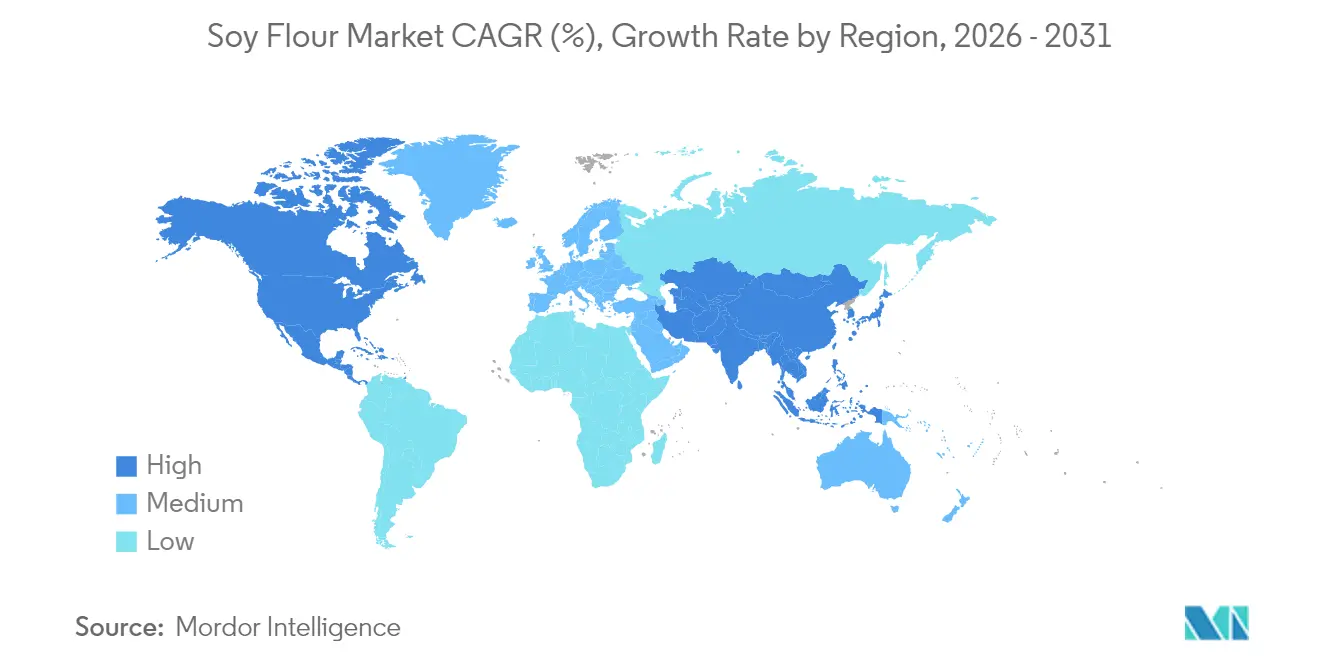
In 2025, the Asia-Pacific region commanded a 34.26% share of the market, buoyed by China's leading role in soybean crushing—processing between 99 to 105 million metric tons annually. Concurrently, India's burgeoning poultry and aquaculture industries consumed 6.9 million metric tons of soybean meal for feed. China's demand for soy flour is twofold: while commodity-grade meal is predominantly used in feed rations, food-grade flour caters to a budding plant-based meat sector, albeit one that's still dwarfed by its North American and European counterparts. In India, cultural inclinations towards dairy proteins, coupled with an underdeveloped cold-chain infrastructure, limit the distribution of soy-fortified products primarily to urban locales. Meanwhile, Japan and South Korea carve out premium niches, with consumers willing to pay extra for organic, non-GMO soy flour—integral to tofu, miso, and other functional foods. However, the overall volumes remain modest, as evidenced by Japan's soy flour imports, which stood at 42,000 metric tons in 2024.
The Americas and EMEA Soy Flour Market
North America is set to outpace all regions with a projected CAGR of 7.18% through 2031. This growth is largely attributed to clean-label regulations and non-GMO certification mandates, steering food manufacturers towards traceable, identity-preserved soy flour. Adding momentum, the U.S. Food and Drug Administration reaffirmed its qualified health claim in 2024, linking soy protein to cardiovascular health, bolstering soy flour's appeal in functional foods and dietary supplements. Meanwhile, Canada's plant-based protein sector, buoyed by a federal injection of CAD 150 million (USD 110 million) in 2024, is scaling up its crushing capacity and developing value-added ingredients. Notably, soy flour is emerging as a pivotal ingredient, seamlessly integrating with the country's existing agricultural framework, as highlighted by Agriculture and Agri-Food Canada. Europe's soy flour landscape is undergoing a transformation, largely influenced by the Deforestation Regulation. Enforced in December 2024, this regulation mandates geolocation proof for soy imports, elevating compliance costs and giving an edge to processors with vertically integrated supply chains. Germany and the Netherlands lead the charge, driven by their production of plant-based meat and dairy alternatives. In South America, Brazil and Argentina dominate, but their focus remains export-oriented. While Brazil produced a staggering 169 million metric tons of soybeans in 2024 and crushed 51 million metric tons domestically, the majority of its soy flour finds its way to Asia and Europe, rather than local consumption. In contrast, the Middle East and Africa are still in the early stages of soy flour adoption, hindered by limited processing facilities and a prevailing preference for animal proteins.

Regulatory Landscape
Soy flour is traded and cleared widely under HS code 1208.10.00, and importing requirements are shaped by both food safety and trade measures. In the United States, soy flour used in food manufacturing is subject to FDA food safety oversight, including preventive controls and allergen management. Commodity definitions such as California Code of Regulations Title 3, Section 2803 also specify compositional parameters for soy flour, including a maximum 4.0% crude fiber for defined soy flour. Internationally, Codex Alimentarius standards and GSFA provisions for soybean products provide a reference point for permitted additives under Good Manufacturing Practice, which in turn affects formulation and export documentation for multinational suppliers.
Trade and sustainability policies are tightening documentation and licensing across multiple corridors. The EU Deforestation Regulation, enforced from December 2024, requires geolocation-based due diligence for soybean-derived imports, increasing traceability and audit demands for suppliers serving Europe. In Southeast Asia, Indonesia Ministry of Trade Regulation No. 11 of 2026 added import licensing and Ministry of Agriculture recommendations for soybean meal, effective May 8, 2026, which increases administrative lead times for soy-derived inputs used across feed and ingredient chains. The United States also applied trade remedies in organics-linked flows, with July 2025 Federal Register actions detailing anti-dumping methodology and cash deposit requirements for certain organic soybean meal imports, which can influence cost and sourcing decisions for identity-preserved and certified supply streams.
Value Chain Analysis
The soy flour value chain begins with soybean cultivation and origination through farmers, elevators, and traders, followed by industrial crushing and processing. Core processing steps include cleaning and dehulling, heat treatment to manage anti-nutritional factors, oil removal for defatted grades (commonly via solvent extraction and desolventizing), and milling into flour with controlled particle size. Full-fat variants typically use minimal fat removal, but they still rely on thermal processing to deliver functional performance. Output splits between food-grade and feed-grade streams, with food applications emphasizing functional performance (emulsification, water binding, solubility) and strict allergen controls, while feed applications focus on consistent protein quality and digestibility.
Scale advantages tend to favor integrated agribusiness processors that combine origination, crushing, and downstream ingredient capabilities, allowing tighter control over quality, traceability, and logistics. Logistics and handling remain key cost and reliability levers: bulk freight from inland production regions to ports, storage, and container or bulk shipments can amplify landed-cost volatility for import-dependent markets. Downstream sales typically move through ingredient distributors and direct supply agreements with industrial bakeries, meat-alternative manufacturers, and feed mills, where specifications such as non-GMO/organic status, heat treatment profile, and functionality (including cold-water dispersibility) shape pricing and supplier qualification.
Competitive Landscape
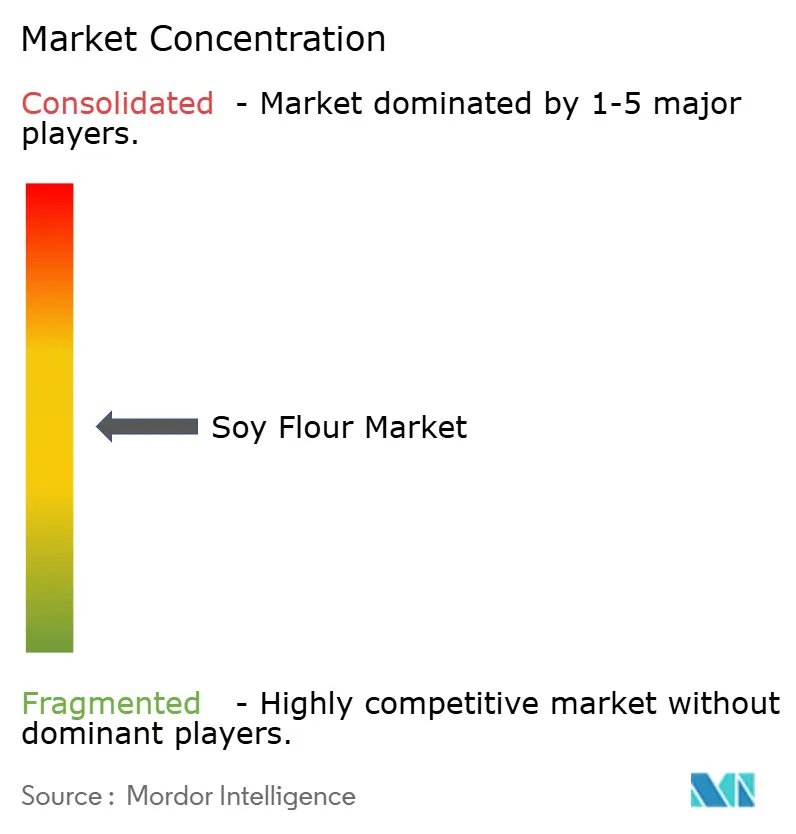
The soy flour market demonstrates moderate fragmentation. While global crushers dominate primary processing, they face competition from regional specialists offering unique products. Archer Daniels Midland, Cargill, and Bunge collectively account for an estimated 35-40% of the global soy crushing capacity. These companies leverage vertically integrated supply chains that include origination, logistics, and ingredient sales.
Smaller players like Vippy Industries in India and Sakthi Soyas differentiate themselves through organic certification, non-GMO sourcing, and customized particle size distributions tailored for bakery and nutraceutical applications. Technology adoption is becoming a critical competitive factor, with processors investing in enzyme-assisted hydrolysis, high-moisture extrusion, and supercritical CO2 extraction. These technologies enhance functional properties, enabling premium pricing. Cargill's 2024 launch of a Singapore innovation center, focused on clean-label soy ingredients, highlights this approach. By co-developing formulations with food manufacturers, Cargill secures multi-year supply agreements, protecting itself from spot-market volatility.
Opportunities remain untapped in fermented soy flour for animal feed, where probiotics reduce anti-nutritional factors and improve gut health, and in soy protein films for biodegradable packaging. With stricter environmental regulations in Europe and North America, demand for petroleum-free alternatives is growing. Emerging disruptors include cellular agriculture startups that use precision fermentation to process soy proteins, bypassing traditional crushing and extraction methods. However, commercial scalability remains 3-5 years away. For processors targeting multinational food manufacturers, ISO 22000 certification for food safety management is increasingly becoming a baseline requirement. Brands are prioritizing suppliers with audited, third-party-verified processes to mitigate supply chain risks.
Soy Flour Industry Leaders
Archer Daniels Midland Company
Cargill, Incorporated
CHS Inc.
International Flavors and Fragrances Inc.
The Scoular Company
- *Disclaimer: Major Players sorted in no particular order
Soy Flour Market Companies Covered in this Report
- Archer Daniels Midland Company (ADM)
- Cargill Incorporated
- CHS Inc.
- International Flavors and Fragrances Inc.
- The Scoular Company
- Foodchem International Corporation
- SunOpta Inc.
- Vippy Industries Ltd.
- Devansoy Inc.
- Harvest Innovations
- Bunge Limited
- Wilmar International Ltd.
- Sakthi Soyas Limited
- Sonic Biochem
- Sinoglory Enterprise Group
- Bob’s Red Mill Natural Foods
- Gushen Biological Technology
- Goldensea Foodstuff Industry
- Sojaprotein
- Tianwei Group
- ZFS Creston

Market Opportunities and Future Outlook
Product and application whitespace is concentrated in higher-functionality soy flour formats that help manufacturers reduce formulation complexity while meeting traceability and clean-label constraints. Processing advances reflected in the market context, including high-moisture extrusion and enzyme-enabled functionality, support premium modified flours for meat-alternative and hybrid-meat systems, alongside full-fat soy flour use in bakery as an egg and emulsifier replacer. Commercial activity around specialized soy ingredient portfolios is providing a visible pull for these upgraded formats, including ADM expanding soy-based ingredient solutions in May 2026 for texture- and solubility-driven applications.
Supply-side opportunities are tied to integrated capacity and sustainability-compliant origination, particularly for customers exposed to Europe’s deforestation due diligence requirements. Named investments and asset moves point to where suppliers are building scale and optionality across crushing and downstream ingredients: Bunge announced a USD 550 million soy protein and concentrate facility in Morristown, Indiana in May 2025, and Cargill moved to full ownership of its Barreiras, Bahia soybean crushing, refining, and bottling plant in June 2025, strengthening control over soy-derived supply in Brazil. At the same time, import licensing changes such as Indonesia’s 2026 rules for soybean meal raise the value of diversified sourcing and documentation-ready supply chains for both food and feed customers.
Recent Industry Developments in Soy Flour Market
- June 2026: CHS Inc. amended its development agreement with the City of Evansville related to its planned soybean crushing plant, shifting the project schedule. The change underscores how sensitive new crushing investments are to economics and timing, with downstream effects on regional availability of soy-derived inputs used for meal and flour applications.
- May 2026: Archer Daniels Midland (ADM) launched eight new soy and pea protein ingredients across North America and Europe, expanding its portfolio for plant-based and hybrid applications. The broadened line-up strengthens supplier positioning in customized protein systems where solubility and texture specifications shape ingredient selection and long-term supply agreements.
- June 2025: Cargill acquired full ownership of its soybean oil crushing, refining, and bottling plant in Barreiras, Bahia, Brazil. Consolidating control of the asset supports tighter coordination of origination, processing, and quality management, which is increasingly important for traceability-led customer requirements in food and feed value chains.


Soy Flour Market Report Scope and Research Methodology
Market Definition and Coverage
For this study, the soy flour market covers commercially sold soy flour used as an ingredient across food, nutrition products, and feed, valued at the point of sale by manufacturers and ingredient suppliers, in USD terms.
Scope exclusions: We exclude whole soybeans, soy meal traded mainly as a commodity, and finished consumer foods where soy flour is only a minor input cost.
Segments Covered in This Report
- By Product Type
- Defatted
- Full-Fat
- By Application
- Food and Beverages
- Bakery and Confectionery
- Meat Substitutes
- Soups and Sausages
- Others
- Pharmaceuticals and Supplements
- Animal Feed
- Others (textile, Cosmetics and Personal Care)
- Food and Beverages
- By Geography
- North America
- United States
- Canada
- Mexico
- Rest of North America
- Europe
- Germany
- United Kingdom
- Italy
- France
- Spain
- Netherlands
- Rest of Europe
- Asia-Pacific
- China
- India
- Japan
- Australia
- Rest of Asia-Pacific
- South America
- Brazil
- Argentina
- Rest of South America
- Middle East and Africa
- South Africa
- United Arab Emirates
- Rest of Middle East and Africa
- North America
Data Sources, Market Sizing, and Validation
Desk Research
Desk work was used to anchor the model to real world supply and demand signals that can be checked year by year. We relied on public agriculture and trade series, such as USDA oilseeds data, FAOSTAT production tables, UN Comtrade customs flows, and national statistical offices for food manufacturing and price indexes. For ingredient use and labeling context, sources such as the Codex Alimentarius guidance and selected peer reviewed food science journals were also reviewed.
Company annual reports, investor presentations, and credible press were used to understand capacity additions, pricing language, and application mix shifts over time. In parallel, we used paid subscriptions for company financials and news, and shipment-level import and export checks in key trading corridors to sanity test the secondary picture. The desk sources listed here are illustrative, and many other public and paid references were also used for data collection, validation, and clarification.
Primary Interviews and Surveys
Primary work focused on validating consumption pathways for soy flour and the pricing logic used in ingredient contracts, where public data can be thin. We spoke with a mix of ingredient suppliers, distributors, and downstream users in bakery, meat alternatives, nutrition products, and feed, then cross-checked the feedback across APAC, EMEA, and the Americas so regional assumptions did not drift.
Interview input also helped confirm where soy flour demand overlaps with adjacent soy ingredients in end-use reporting, and how respondents interpret contract-based pricing versus published indices.
Distribution of primary research fieldwork respondents
| Company type | Respondent position | Region |
|---|---|---|
| Top tier: 30% | CXOs: 19% | APAC: 46% |
| Mid tier: 51% | Functional/Unit leaders: 40% | EMEA: 36% |
| Smaller Players: 19% | Managers: 41% | Americas: 18% |
Market-Sizing & Forecasting
Sizing starts from a top-down build where soybean crushing, soy ingredient output, and trade data are used to reconstruct the addressable soy flour pool by region, before it is filtered through application shares that were validated in interviews. To keep the result grounded, we corroborate it with selective bottom-up approximations, such as sampled supplier revenues, channel checks in key importing countries, and observed price bands applied to estimated volumes.
The model leans on a small set of repeatable inputs that actually move the soy flour market. These include soybean availability and crush trends, relative price spreads versus wheat flour and other plant proteins, bakery and plant-based food production indicators, feed demand cues, and import dependence in regions that do not produce enough soy. When a bottom-up data point is missing for a smaller geography, we use proxy ratios tied to trade intensity and food manufacturing output, then review the resulting volumes with local participants.
For forecasting, scenario analysis is used around the two biggest swing factors, soybean price cycles and downstream demand shifts in bakery and meat alternatives, and the scenario weights are refined using what respondents expect for contracts and capacity utilization. Outputs are then converted to USD using consistent exchange-rate timing so year-to-year movements are not overstated.
Data Validation & Update Cycle
Validation is done in several passes so no single data series dominates the outcome. We compare outputs against independent signals such as trade totals, soybean and soy ingredient price indexes, and regional food manufacturing growth, then review any large variances before the numbers are signed off.
If an assumption starts to drift, such as a sudden pricing change or an unexpected shift in application mix, experts are re-contacted and the model is re-run with documented adjustments. The report is refreshed annually, and interim updates are made when material events occur, followed by a final pre-delivery check so the view is current at release.
Mordor Intelligence's Soy Flour Market Estimate Compared With Other Published Estimates
Published market sizes for soy flour often do not match because the boundaries of what gets counted are not the same, and because pricing and currency handling can be done differently. The spread usually becomes larger when one study mixes soy flour with adjacent soy ingredients, or when it reports an industrial-only slice without clearly stating it.
Trade flows, soybean crush indicators, and observed ingredient price bands are the evidence used to keep Mordor Intelligence's estimate tied to the soy flour demand pool that is actually traded and formulated into food, nutrition products, and feed. Differences versus other figures are mainly explained by whether industrial grades are separated from broader food ingredient demand, how volumes are converted to value through average selling price progression, and how often assumptions are refreshed after price shocks.
Benchmark comparison
| Source | Market Size | Gaps in Research Methodology |
|---|---|---|
| Mordor Intelligence | USD 2.84 B (2026) | |
| Industry Data Publisher A | USD 3.32 B (2024) | Uses an earlier base year and a broader framing that can capture adjacent soy ingredient demand, and it may apply a smoother price path that dampens recent commodity-driven variability. |
| Industrial Research Publisher B | USD 2.96 B (2024) | Covers industrial soy flour specifically, which can exclude parts of food ingredient use, and it reports a different time window that changes the price and volume mix captured in the current value. |
Taken together, the comparison shows that year selection and scope boundaries drive most of the gap, and then pricing and currency timing do the rest. By keeping inputs traceable to production, trade, and end-use signals, the study produces a market value that can be repeated and stress-tested with the same few steps.


Key Questions Answered in the Report
What is the projected value of the soy flour market in 2031?
The soy flour market is expected to reach USD 3.81 billion by 2031, reflecting a 6.04% CAGR.
Which product type currently leads in sales?
Defatted soy flour leads, holding 61.58% of 2025 revenue.
Which application segment is growing fastest?
Animal feed is advancing at a 10.05% CAGR as producers replace fishmeal with soy flour.
Why is North America the fastest-growing region?
Clean-label rules and non-GMO certification drive demand, pushing the region toward a 7.18% CAGR through 2031.
Page last updated on:


 Your data is secure and never sold or shared.


