
High-fructose Corn Syrup (HFCS) Market Size and Share
Market Overview
| Study Period | 2021 - 2031 |
|---|---|
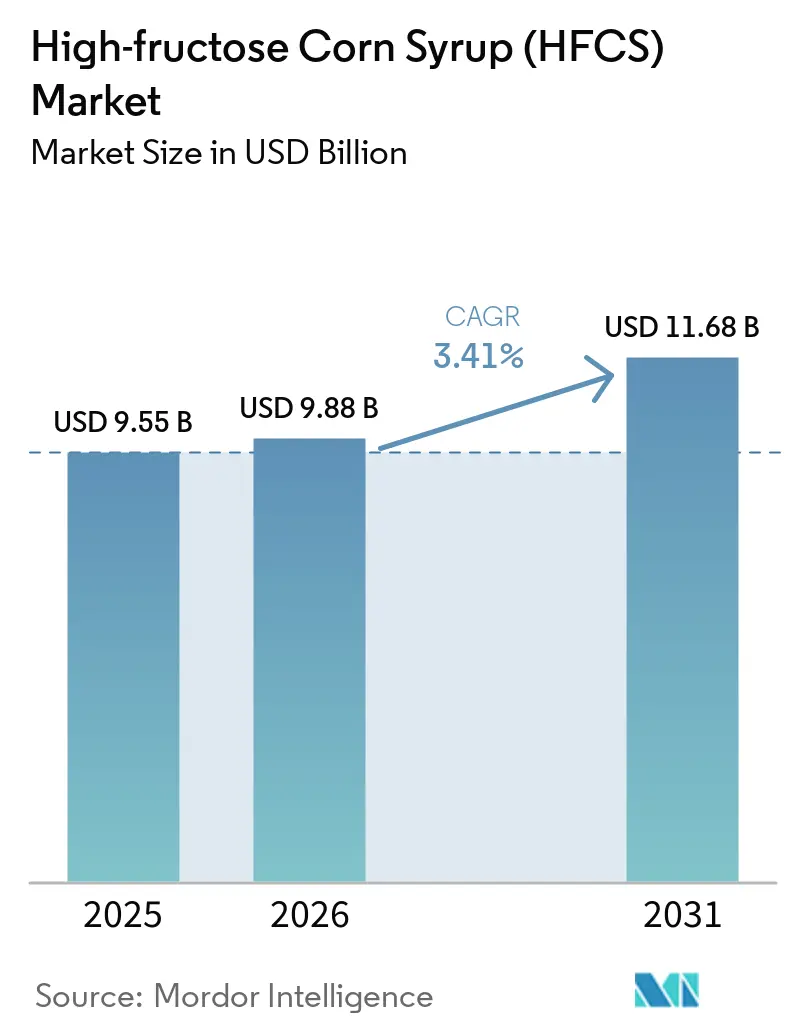
| Market Size (2026) | USD 9.88 Billion |
| Market Size (2031) | USD 11.68 Billion |
| Growth Rate (2026 - 2031) | 3.41 % |
| Fastest Growing Market | Asia Pacific |
| Largest Market | North America |
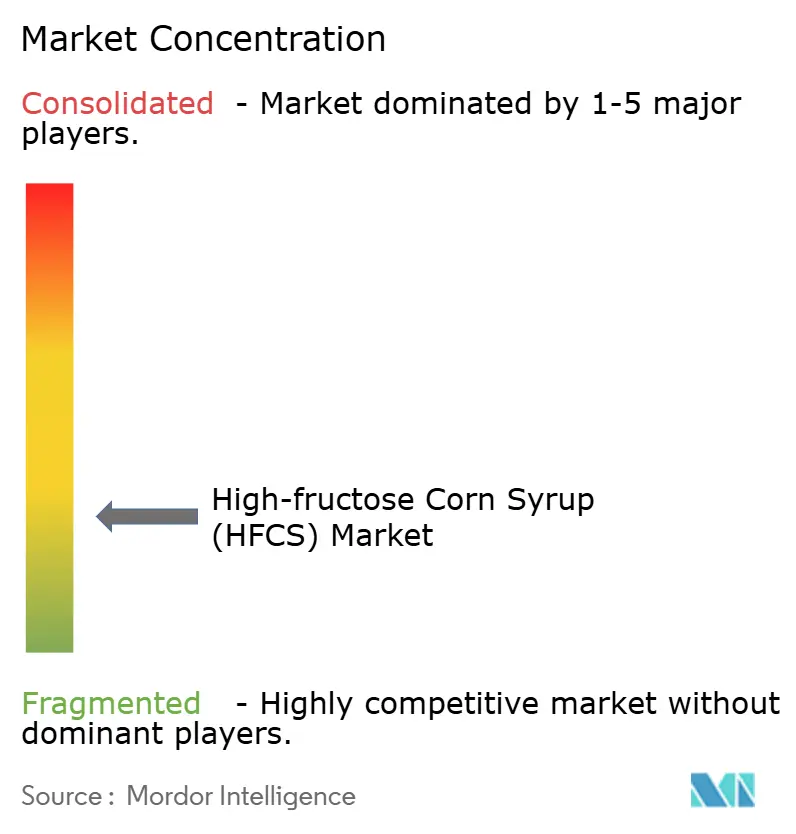
| Market Concentration | Low |
Major Players
*Disclaimer: Major Players sorted in no particular order Image © Mordor Intelligence. Reuse requires attribution under CC BY 4.0. |
|
High-fructose Corn Syrup (HFCS) Market Analysis by Mordor Intelligence
high fructose corn syrup market size in 2026 is estimated at USD 9.88 billion, growing from 2025 value of USD 9.55 billion with 2031 projections showing USD 11.68 billion, growing at 3.41% CAGR over 2026-2031. Robust demand from processed food manufacturers, steady beverage reformulations, and resilient pharmaceutical off-take keep the high fructose corn syrup market on a moderate growth path despite escalating clean-label pressures. Favorable corn pricing in the United States and Argentina cushions input costs, while sugar price volatility in Brazil and Mexico widens the sweetener’s cost advantage. The Asia Pacific’s expanding middle class continues to adopt packaged foods at a rapid pace, raising liquid sweetener usage, even as North American brands adjust their recipes to balance health concerns with manufacturing efficiency. Pharmaceutical formulators now account for the fastest incremental demand as HFCS gains acceptance as a stable, palatable excipient in oral dosage forms.
Key Report Takeaways
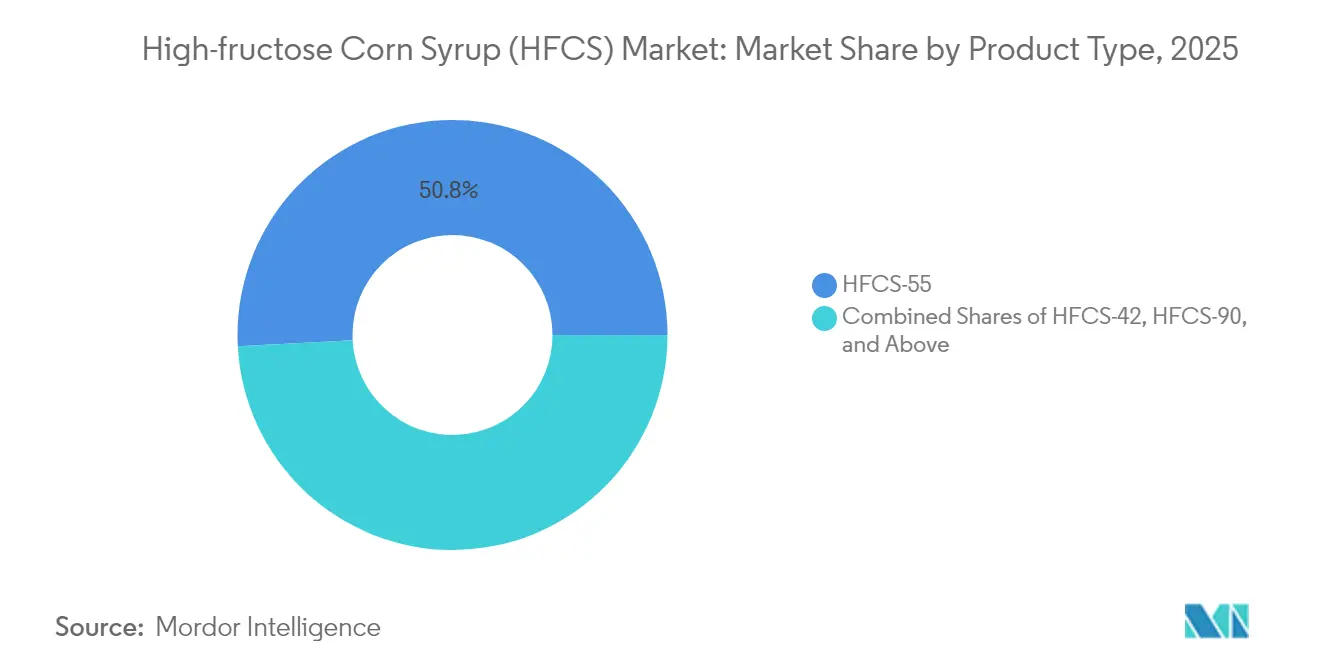
- By product type, HFCS-55 led with 50.83% of the high fructose corn syrup market share in 2025, while HFCS-42 is projected to expand at a 3.86% CAGR through 2031.
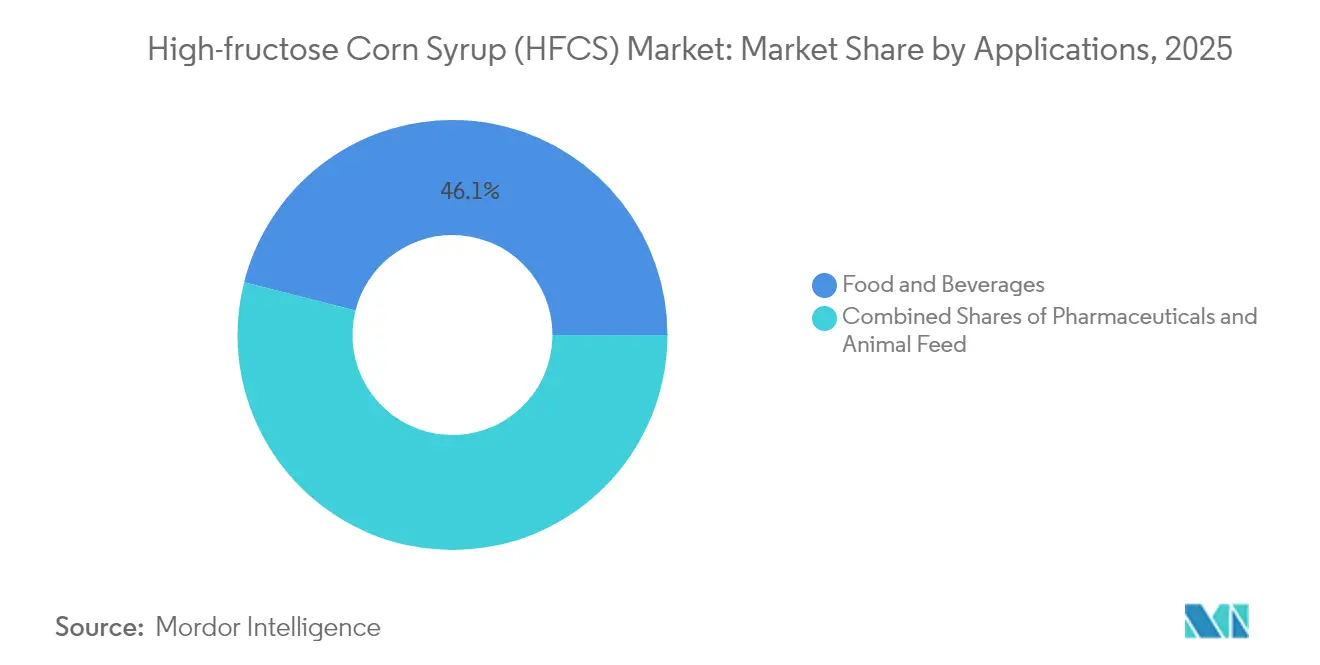
- By application, beverages accounted for a 46.05% share of the high fructose corn syrup market size in 2025, and pharmaceuticals are advancing at a 4.27% CAGR through 2031.
- By geography, North America held 37.37% of the high fructose corn syrup market share in 2025, whereas the Asia Pacific is forecast to grow at a 5.03% CAGR between 2026 and 2031.
Note: Market size and forecast figures in this report are generated using Mordor Intelligence’s proprietary estimation framework, updated with the latest available data and insights as of 2026.
Market Trends and Insights
Drivers Impact Analysis of High-fructose Corn Syrup (HFCS) Market*
| Drivers | (~)% Impact on CAGR Forecast | Geographic Relevance | Impact Timeline |
|---|---|---|---|
| Rising Demand for Processed Foods | +0.8% | Global, with strongest impact in Asia-Pacific and Latin America | Medium term (2-4 years) |
| Competitive Cost Advantage over conventional sugar | +0.6% | North America, Mexico, and sugar-importing regions | Short term (≤ 2 years) |
| Beverage formulators' preference for liquid-stable HFCS-55 | +0.5% | Global beverage manufacturing hubs | Long term (≥ 4 years) |
| Production and Processing Efficiency | +0.4% | Major production centers in US, Europe, China | Medium term (2-4 years) |
| Technological Advancements in production and processing | +0.3% | Developed markets with advanced manufacturing | Long term (≥ 4 years) |
| Stable Supply of Raw Material | +0.2% | Corn-producing regions: US, Brazil, Argentina | Short term (≤ 2 years) |
| Source: Mordor Intelligence | |||


Rising Demand for Processed Foods
Urbanization and shifting lifestyles are propelling a surge in global processed food consumption, especially in emerging economies where a burgeoning middle class is increasingly turning to packaged foods. High Fructose Corn Syrup (HFCS) is becoming a staple in processed foods, prized for its moisture retention, longer shelf life, and cost advantages over traditional sugars. Meanwhile, the pharmaceutical industry is tapping into HFCS, using it as an excipient in drug formulations. Its roles in tablet coatings and oral delivery systems are now gaining traction with regulators. In China, challenges in domestic sugar production are paving the way for a heightened demand for HFCS, especially as the market for processed foods expands. Furthermore, food processors adopting HFCS are not only ensuring consistent product quality but are also better equipped to navigate fluctuations in input costs.
Competitive Cost Advantage over Conventional Sugar
HFCS holds a consistent cost advantage over traditional sugar, particularly during periods of supply shortages and price volatility. Mexico's recent situation highlights this trend: drought conditions drove sugar prices higher, leading to record HFCS consumption. The USDA predicts corn prices will reach USD 4.35 for the 2025/26 period, slightly below the 16-year average of USD 4.59, strengthening the economic viability of HFCS production. Sugar market disruptions, such as Brazil's projected 8.5% production decline to 645 million metric tons in 2024/25 due to unfavorable weather, increase pricing pressures, further boosting HFCS competitiveness, according to the United States Department of Agriculture[1]United States Department of Agriculture, "Sugar Annual", www.fas.usda.gov. Trade policies also play a significant role; sugar import quotas and tariffs in key markets create artificial price floors, favoring corn-based alternatives. Industrial users are increasingly adopting multi-year HFCS contracts to secure cost savings. For example, Ingredion has successfully renegotiated contracts, enabling margin recovery despite rising input costs. Furthermore, currency fluctuations in major sugar-producing regions add pricing volatility, often benefiting domestically produced HFCS in stable economies.
Beverage formulators' preference for liquid-stable HFCS-55
HFCS-55's liquid form overcomes the dissolution issues associated with crystalline sugar. This enables beverage manufacturers to ensure consistent sweetness profiles, improve production efficiency, lower processing costs, and enhance quality control. With a 55% fructose composition, HFCS-55 delivers superior sweetening and flavor enhancement, making it a preferred choice for carbonated soft drinks and fruit beverages. This dominance is reflected in its 46.57% market share in the beverage segment for 2024. Despite ongoing public discussions about cane sugar alternatives, Coca-Cola's continued use of HFCS highlights its technical advantages in large-scale beverage production. HFCS-55's stability across varying temperatures simplifies cold storage and transportation logistics, reducing supply chain complexities for distributors operating in diverse climates. Innovations in membrane technology for HFCS purification improve product quality by achieving greater separation accuracy and reducing impurities, meeting the demands of premium beverage applications. The FDA's recognition of HFCS as a "natural" ingredient provides beverage brands with the flexibility to adopt clean-label strategies without compromising functional performance.
Technological Advancements in production and processing
Recent innovations in enzymatic processes, especially in glucose isomerase engineering, have boosted the efficiency of HFCS production. These advancements not only lessen the dependency on Co2+ but also enhance conversion rates. Notably, recent studies showcased a remarkable 96.38% retention of activity after six reaction cycles, thanks to metal-organic framework immobilization techniques. Meanwhile, cutting-edge membrane filtration technologies are transforming HFCS purification. They achieve heightened separation accuracy, curtail wastewater generation, and prolong the lifespan of ion exchange resins, all of which translate to substantial economic gains for manufacturers. In the realm of sweetener production, ceramic membranes are making waves. Their cross-flow filtration outperforms traditional methods by more effectively eliminating insoluble impurities, leading to superior product quality and diminished downstream processing needs. Furthermore, bioprocess optimization, through both directed evolution and the strategic engineering of xylose isomerase, is amplifying the efficiency of converting glucose to fructose. This not only slashes production costs but also lessens environmental repercussions. Lastly, the integration of automation and process control systems is revolutionizing enzymatic reactions. With real-time monitoring and adjustments, manufacturers can optimize yields and consistency, all while trimming labor needs and minimizing operational fluctuations.
Restraints Impact Analysis of High-fructose Corn Syrup (HFCS) Market*
| Restraints | ~)% Impact on CAGR Forecast | Geographic relevance | Impact Timeline |
|---|---|---|---|
| Increasing Demand for Low/Zero-Calorie Sweeteners | -0.7% | North America, Europe, developed Asia-Pacific markets | Medium term (2-4 years) |
| Strict Government Regulations | -0.5% | EU, North America, with spillover to other regions | Long term (≥ 4 years) |
| Clean-label shift toward sucrose & "no-HFCS" claims | -0.4% | Premium consumer segments globally | Short term (≤ 2 years) |
| Introduction of New Natural Sweeteners | -0.3% | High-income markets with health-conscious consumers | Long term (≥ 4 years) |
| Source: Mordor Intelligence | |||
Increasing Demand for Low/Zero-Calorie Sweeteners
As health consciousness rises, consumers are increasingly adopting low and zero-calorie sweeteners. Allulose, in particular, has gained significant traction following its 2019 GRAS approval by the FDA and subsequent regulatory acceptance in China. This trend is intensifying competition for traditional caloric sweeteners like HFCS. Additionally, the European Food Safety Authority's ongoing evaluation of allulose, with positive preliminary findings, poses a threat to HFCS, especially in premium food and beverage sectors where health-focused products command higher prices. In developed markets, the adoption of stevia and monk fruit extracts is accelerating, driven by improved taste profiles and regulatory approvals that enable their use in food categories previously dominated by HFCS. Companies such as Ingredion and Tate & Lyle are heavily investing in alternative sweetener production. Tate & Lyle, in particular, has announced new partnerships aimed at developing bio-converted stevia. Beverage manufacturers are increasingly introducing zero-calorie versions of traditional products, leading to a decline in per capita HFCS consumption in mature markets, despite overall beverage volume growth. Regulatory support for sugar reduction initiatives, including potential taxes on high-calorie sweeteners, is further driving the shift toward alternative sweetening solutions.
Strict Government Regulations
Health authorities are intensifying their scrutiny of HFCS safety and labeling, with the FDA proposing changes to its GRAS standards. These reforms could eliminate self-affirmation processes and require mandatory safety data submissions for food ingredients. HHS Secretary Robert F. Kennedy Jr. has called for stronger FDA oversight of ingredients like HFCS, signaling potential policy changes that may increase compliance costs. In contrast, European Union [2]European Union, "Europe’s Regulatory Landscape for Food-Grade Chemicals", www.eur-lex-europea.euregulations under Regulation (EC) No 1333/2008 enforce stringent pre-market approval requirements, creating challenges for HFCS applications in the EU food products market. The Codex Alimentarius Committee's ongoing review of food additives, including HFCS, could influence global regulatory alignment and safety standards. As health awareness increasingly drives purchasing decisions, labeling transparency requirements mandating clear identification of HFCS content could impact consumer acceptance. Additionally, regulatory divergence between markets introduces compliance complexities for multinational food manufacturers using HFCS across different jurisdictions.
*Our forecasts treat driver/restraint impacts as directional, not additive. The impact forecasts reflect baseline growth, mix effects, and variable interactions.
High-fructose Corn Syrup (HFCS) Market Segment Analysis
By Product Type:
HFCS-55 Dominates Beverage ApplicationsIn 2025, HFCS-55 dominates the market with a 50.83% share, primarily used in carbonated soft drinks and fruit beverages. Its 55% fructose content offers superior sweetness intensity and flavor enhancement compared to crystalline sugar. The liquid form eliminates dissolution challenges, ensuring smooth blending in large-scale beverage production. This advantage makes it the preferred choice for major bottlers, even amid rising health concerns. Meanwhile, HFCS-42 is witnessing notable growth, with a projected 3.86% CAGR through 2031. Its growth is driven by its application in baked goods, dairy products, and processed foods, where its lower fructose content provides balanced sweetness without overpowering flavors.
HFCS-90 and higher variants cater to specialized applications requiring concentrated fructose content. These are primarily utilized by pharmaceutical and nutraceutical manufacturers for drug delivery systems and specialized food applications due to their high-purity composition. Advances in enzymatic processing are enhancing conversion efficiency across all product types. For example, immobilized glucose isomerase systems are reducing Co2+ dependency while maintaining 96.38% activity after multiple reaction cycles. Production economics favor HFCS-55 due to its efficient conversion rates and established infrastructure. In contrast, the rising demand for HFCS-42 reflects food manufacturers' focus on cost optimization and formulation flexibility. The FDA, under 21 CFR 184.1866, specifies HFCS standards and usage guidelines, ensuring consistency across variants and supporting market growth through regulatory clarity.


By Application:
Pharmaceuticals Accelerate Fastest GrowthThe beverage segment maintains dominance at 46.05% market share in 2025, driven by HFCS-55's technical superiority in carbonated soft drinks and the cost advantages that enable competitive pricing in price-sensitive markets. Pharmaceutical applications demonstrate the fastest growth at 4.27% CAGR through 2031, as drug manufacturers increasingly adopt HFCS as an excipient for tablet coating, oral drug delivery, and liquid formulations where its stability and biocompatibility provide functional advantages over traditional excipients. Food applications, including bakery, confectionery, and dairy products, benefit from HFCS's moisture retention properties and extended shelf life characteristics that enhance product quality and reduce waste.
Regulatory compliance factors significantly influence application growth, with pharmaceutical-grade HFCS requiring adherence to USP standards and FDA guidance on drug ingredient composition. Animal feed applications represent a smaller but stable segment, utilizing HFCS's palatability enhancement properties to improve feed acceptance and nutritional value. The beverage industry's evolution toward premium and functional drinks creates opportunities for specialized HFCS formulations, while pharmaceutical growth reflects the ingredient's expanding role in drug delivery innovation and formulation optimization. Clean-label pressures affect food applications more than pharmaceutical uses, where functional performance outweighs consumer perception concerns in product development decisions.
Geography Analysis
North America and APAC High-fructose Corn Syrup (HFCS) Market
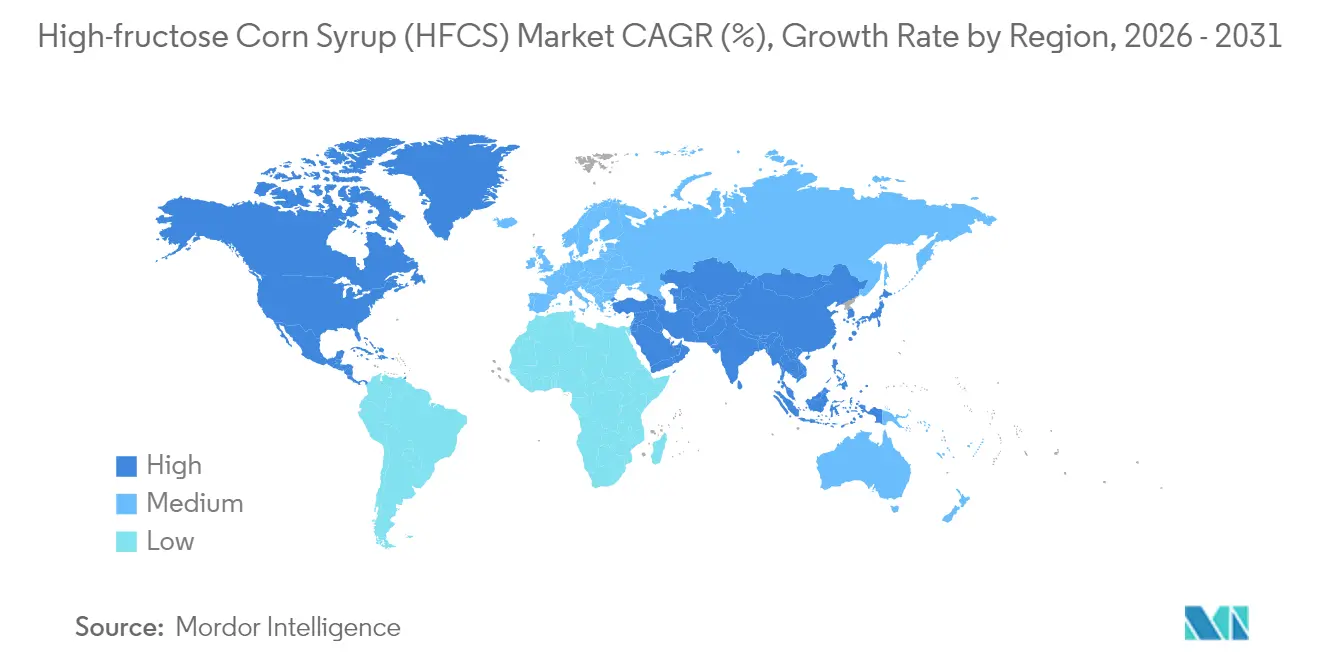
North America holds the largest market share at 37.37% in 2025, supported by established corn processing infrastructure and beverage industry concentration, though growth moderates as health consciousness and regulatory scrutiny intensify across mature markets. Asia Pacific emerges as the fastest-growing region at 5.03% CAGR through 2031, led by China's increasing HFCS consumption as domestic sugar production challenges and processed food market expansion create substitution opportunities. Mexico's HFCS consumption reached 1.599 million metric tons in 2025, the highest since 2011/12, demonstrating how supply disruptions in traditional sweetener markets accelerate HFCS adoption.
Europe and South America High-fructose Corn Syrup (HFCS) Market
European markets face regulatory headwinds under EFSA oversight and consumer preference for natural alternatives, limiting HFCS penetration to specialized industrial applications where functional benefits justify regulatory complexity. South American markets, particularly Brazil, present growth opportunities as corn availability increases and food processing sector expansion creates demand for cost-effective sweetening solutions, with the Brazilian food processing sector generating USD 209 billion in 2022.
MEA High-fructose Corn Syrup (HFCS) Market
Middle East and Africa regions benefit from joint ventures like the Cargill-Arasco partnership in Saudi Arabia, which aims to triple production capacity to meet growing GCC demand Cargill. Regional growth patterns reflect the interplay between corn availability, sugar market dynamics, regulatory environments, and industrial food processing development, with emerging markets offering the strongest expansion potential despite infrastructure challenges.

Regulatory Landscape
In the United States, high-fructose corn syrup is treated as a direct human food ingredient under FDA rules, with 21 CFR 184.1866 defining HFCS (commonly 42% or 55% fructose) and allowing use under current good manufacturing practice. In parallel with ingredient-specific status, FDA-related developments are also moving through the broader US food-ingredient governance pathway, which can raise documentation and labeling expectations for manufacturers and downstream food and beverage users.
In the European Union, HFCS is typically marketed as isoglucose or glucose-fructose syrup. It is permitted under the EU food additive and food information framework rather than being handled as an ingredient-specific ban category. For HFCS-containing finished products, compliance considerations often connect to total sugar labeling and sugar-focused public health measures, including sugar-sweetened beverage tax structures in several member states. Chemicals compliance is generally less burdensome when glucose-fructose syrups are the primary constituents under the European Chemicals Agency approach to REACH obligations.
Value Chain Analysis
The HFCS value chain begins with corn cultivation, then proceeds through wet milling to separate starch and co-products, followed by enzymatic conversion (hydrolysis and isomerization) and purification to produce commercial grades such as HFCS-42 and HFCS-55. Integrated wet millers typically optimize across outputs, including HFCS, glucose/dextrose, starches, and feed co-products, so utilization rates and product mix decisions depend on demand across food and beverage, pharmaceuticals, and animal feed rather than HFCS alone.
Midstream logistics and quality management matter because HFCS is commonly shipped as a bulk liquid, which requires tank storage, temperature management, and reliable road or rail distribution to large food plants and bottlers. Downstream, beverage and processed-food manufacturers provide steady offtake, while pharmaceutical customers add specification controls and documentation requirements. In the United States, public-health and policy attention, including the June 2024 introduction of H.R. 8688 (Stop Spoonfuls of Fake Sugar Act of 2024) and the May 2025 Make America Healthy Again Commission report that flagged HFCS in dietary concerns, adds reputational and compliance pressure that can alter procurement strategies and increase the need for dual-sourcing across sweetener options.
Competitive Landscape
The high fructose corn syrup market remains fragmented, with a concentration score of 3 out of 10, indicating significant opportunities for market share growth despite major players controlling a large portion of production capacity. Key participants, including Cargill, ADM, and Ingredion, are implementing distinct strategies. ADM is shifting its focus from HFCS production to sustainable alternatives, while Ingredion continues to perform strongly, with sweeteners contributing 34% of its net sales in 2024.
Technology adoption is emerging as a critical competitive advantage, as companies invest in advanced enzymatic processes, membrane filtration systems, and process automation to enhance cost efficiency and product quality. Strategic partnerships and joint ventures are driving market expansion. For instance, the collaboration between Cargill and Arasco in Saudi Arabia aims to triple capacity and capitalize on growth opportunities in the GCC market. White-space opportunities exist in pharmaceutical applications, where specialized HFCS grades command premium prices, and in emerging markets, where developing corn processing infrastructure offers first-mover advantages.
The competitive dynamics vary significantly across regions, with North American and European markets being more consolidated compared to the relatively fragmented Asian market. Local players in emerging markets are increasingly forming strategic alliances with global leaders to enhance their technological capabilities and market reach. The industry has witnessed several strategic investments in corn processing facilities and distribution infrastructure, particularly in developing economies where demand growth is robust. Companies are also focusing on backward integration to secure raw material supplies and maintain cost competitiveness.
High-fructose Corn Syrup (HFCS) Industry Leaders
-
Cargill, Incorporated
-
Ingredion Incorporated
-
Tate & Lyle PLC
-
Global Sweeteners Holdings Limited
-
Archer Daniels Midland Company
- *Disclaimer: Major Players sorted in no particular order
High-fructose Corn Syrup (HFCS) Market Companies Covered in this Report
- Cargill Inc.
- Archer Daniels Midland Co.
- Ingredion Inc.
- Tate & Lyle PLC
- Global Sweeteners Holdings
- AGRANA AG
- COFCO Rongshi Bio-Tech
- Roquette Frères
- Showa Sangyo Co. Ltd
- Kerry Group plc
- Hungrana Kft.
- Baolingbao Biology Co. Ltd
- Japan Corn Starch Co. Ltd
- Daesang Corp.
- Luzhou Bio-Chem Tech
- Tereos S.A.
- Sweetener Supply Corp.
- National Company for Maize Products (NCMP)
- Wilmar International Ltd
- Egypt Starch & Glucose Company

Market Opportunities and Future Outlook
Capacity additions and asset transfers in India support an opportunity corridor tied to localized wet-milling scale-up that can feed both HFCS-adjacent sweeteners and the broader liquid sweetener and starch ecosystem serving packaged foods and pharma excipients. In May 2026, Regaal Resources commissioned an expanded maize wet milling facility in Kishanganj, Bihar, raising crushing capacity from 825 TPD to 1,650 TPD, and added liquid glucose and maltodextrin powder output. Sanstar Limited commissioned expanded native starch capacity at Dhule, with installed capacity rising from 1,100 TPD to 2,350 TPD. In the same month, Riddhi Siddhi Gluco Biols completed the acquisition of Cargill’s corn wet milling facility in Davangere, Karnataka, adding 300,000 MT of annual processing capacity and reinforcing the role of India-based milling footprints as supply nodes for sweetener and excipient value chains.
In the United States, a key whitespace is operational readiness for tighter ingredient governance, including potential shifts to how GRAS is overseen and reassessed, which increases the value of documentation, traceability, and formulation optionality for HFCS users across beverages and processed foods. Legislative activity such as the April 2026 introduction of the FRESH Act (FDA Review and Evaluation for Safe, Healthy and Affordable Foods Act of 2026) and state-level initiatives like New York Assembly passage of AB 1556/SB 1239 (Food Safety and Chemical Disclosure Act) point to a more complex compliance environment. At the same time, regional supply de-bottlenecking plans, including Star of the West Milling Co.’s June 2026 plan to build a new corn mill in Quincy, Michigan (over 21,000 bushels per day), create openings for HFCS and other corn-based ingredient suppliers to improve service levels to food manufacturers while navigating reformulation pressures and customer demand for alternative sweetener options.
Recent Industry Developments in High-fructose Corn Syrup (HFCS) Market
- June 2026: Ingredion reached a definitive agreement for the recommended all-cash acquisition of Tate & Lyle PLC for about GBP 3.7 billion (including debt). The transaction expands Ingredion's ingredient platform across sweeteners and broader formulation solutions, strengthening its scale with global food and beverage customers that buy HFCS and adjacent carbohydrate systems.
- June 2025: Cargill reported first railcar shipments of corn syrup from its Fort Dodge, Iowa, facility. The milestone marked the transition from buildout to regular distribution, improving regional supply availability for bulk liquid sweeteners serving industrial food and beverage users.
- October 2024: Cargill held a ribbon-cutting for completion of its multimillion-dollar corn syrup production facility in Fort Dodge, Iowa. The facility adds processing and logistics capability that supports larger-volume, food-grade corn syrup supply chains alongside other corn-derived ingredient streams.


High-fructose Corn Syrup (HFCS) Market Report Scope and Research Methodology
Market Definition and Coverage
This market covers the global value of high fructose corn syrup sold into end-use industries, counted at the point of commercial sale in USD and aligned to typical industrial grades used in foods, beverages, and other applications.
Scope exclusions: We exclude non-corn sweeteners such as sucrose, honey, and high-intensity sweeteners, even when they substitute for HFCS in formulations.
Segments Covered in This Report
-
By Product Type
- HFCS-42
- HFCS-55
- HFCS-90 & above
-
By Application
-
Food & Beverages
- Bakery
- Confectionery
- Dairy & Desserts
- Beverages
- Other F&B Applications
- Pharmaceuticals
- Animal Feed
-
Food & Beverages
-
By Geography
-
North America
- United States
- Canada
- Mexico
- Rest of North America
-
Europe
- Germany
- United Kingdom
- Italy
- France
- Spain
- Netherlands
- Rest of Europe
-
Asia-Pacific
- China
- India
- Japan
- Australia
- Indonesia
- South Korea
- Rest of Asia-Pacific
-
South America
- Brazil
- Argentina
- Rest of South America
-
Middle East and Africa
- South Africa
- Saudi Arabia
- United Arab Emirates
- Rest of Middle East and Africa
-
North America
Data Sources, Market Sizing, and Validation
Desk Research
Desk research was used to set the market context and to anchor key input variables that drive HFCS demand and pricing. We leaned on public and official references such as USDA corn balance sheets and sweetener use data, the US International Trade Commission trade statistics, UN Comtrade, FAOSTAT, and Food and Agriculture Organization publications, along with peer-reviewed food science and nutrition journals where processing and use patterns are discussed.
To keep the model practical, we also reviewed company annual reports and investor presentations for capacity moves and business mix cues, plus association websites and reputable press for policy or reformulation shifts. In a few spots, paid subscriptions that aggregate company financials, import-export shipments, and patent activity were used to cross-check directionally, especially where shipment timing and contract cadence are hard to observe publicly. The sources named here are illustrative only, and many other public materials were used for data collection, validation, and clarification.
Primary Interviews and Surveys
Primary interviews and short surveys were run with participants across the HFCS value chain, including corn wet millers, distributors and traders, and buyers from beverage, bakery, and processed food manufacturing. We used these conversations to validate conversion yields, typical contract structures, regional demand shifts, and how HFCS-42 and HFCS-55 usage changes when sugar prices or labeling pressures move.
Distribution of primary research fieldwork respondents
| Company type | Respondent position | Region |
|---|---|---|
| Top tier: 29% | CXOs: 16% | APAC: 44% |
| Mid tier: 51% | Functional/Unit leaders: 31% | EMEA: 34% |
| Smaller Players: 20% | Managers: 53% | Americas: 22% |
Market-Sizing & Forecasting
Sizing starts from a top-down build where corn processing outputs and sweetener demand indicators are reconstructed by region, and then translated into HFCS value using region-specific pricing logic. The totals are then checked with selective bottom-up approximations, such as sampled supplier revenue cues, channel checks with traders, and volume times ASP sanity tests for key applications, before final adjustments are made.
In the model, a few fingerprints matter more than generic GDP trends, so we track variables like carbonated soft drink and juice consumption direction, packaged food output growth, the split between HFCS-42 versus HFCS-55 in beverage formulas, corn input costs that influence HFCS price bands, and import-export flows where local capacity is limited. When bottom-up cues are missing in smaller countries, the gap is handled using comparable-market benchmarks and penetration rates tied to beverage and processed food production.
For forecasting, scenario analysis is used so the forward view stays realistic under different sugar price spreads, reformulation pressure, and beverage demand outcomes. The chosen path is then aligned to what interviewees describe as the most likely operating case. We also apply a light smoothing step on price and volume series so one-off shocks do not overstate the long-term trend.
Data Validation & Update Cycle
Triangulation is done by comparing the model output against independent signals such as trade balances, corn grind direction, and application-level demand cues, which helps keep the size tied to observable market activity. Outliers are flagged when a region shows unusual price realization or implausible volume jumps, and those cases are rechecked through follow-up calls or a fresh scan of public disclosures.
Before sign-off, the work goes through multi-step analyst review where assumptions, conversions, and currency treatment are checked for consistency across years. Reports are refreshed annually, and if a material event occurs, we do an interim update and then re-validate the key variables so the delivered view stays current.
Mordor Intelligence's High Fructose Corn Syrup Market Size Compared With Other Published Estimates
Different published numbers for HFCS can vary even when the market name looks the same, since groups may use different base years, include adjacent sweeteners, or apply different price assumptions by grade and region. In our review, the biggest swings typically came from what gets counted as HFCS revenue, how application demand is mapped, and how pricing is converted and updated over time.
The main gap comes from scope and timing, where Mordor Intelligence counts only HFCS-42, HFCS-55, and HFCS-90 and above in a global basket for 2026, while other sources often anchor to 2024 and may apply broader end-use coverage or different pricing progressions that lift or compress the value.
Benchmark comparison
| Source | Market Size | Gaps in Research Methodology |
|---|---|---|
| Mordor Intelligence | USD 9.88 B (2026) | |
| Global Consultancy A | USD 8.95 B (2024) | Uses a different base year and forecast window, and the sizing leans more on stated segment splits by end user, which can shift the value depending on assumed beverage dominance and price realization. |
| Industry Publisher B | USD 9.73 B (2024) | Anchors the market to 2024 and applies its own channel and application mapping, which can move totals when offline-heavy distribution assumptions and regional pricing conversions differ. |
The table shows that year selection and what is treated as in-scope demand are the practical reasons for the spread. By keeping the counted product set clear and by tying pricing and application splits to checkable signals, the final number remains traceable to a repeatable set of steps.


Key Questions Answered in the Report
What is the current value of the high fructose corn syrup market?
The high fructose corn syrup market size is USD 9.88 billion in 2026.
How fast is the high fructose corn syrup market expected to grow?
The market is projected to expand at a 3.41% CAGR and reach USD 11.68 billion by 2031.
Which product variant holds the largest share?
HFCS-55 commands 50.83% of 2025 volume, driven by beverage demand.
Which application will grow quickest through 2031?
Pharmaceutical usage is forecast to rise at a 4.27% CAGR due to excipient adoption.
Page last updated on:


 Your data is secure and never sold or shared.


