South America Wind Turbine Market Size and Share
Market Overview
| Study Period | 2021 - 2031 |
|---|---|
| Forecast Data Period | 2026 - 2031 |
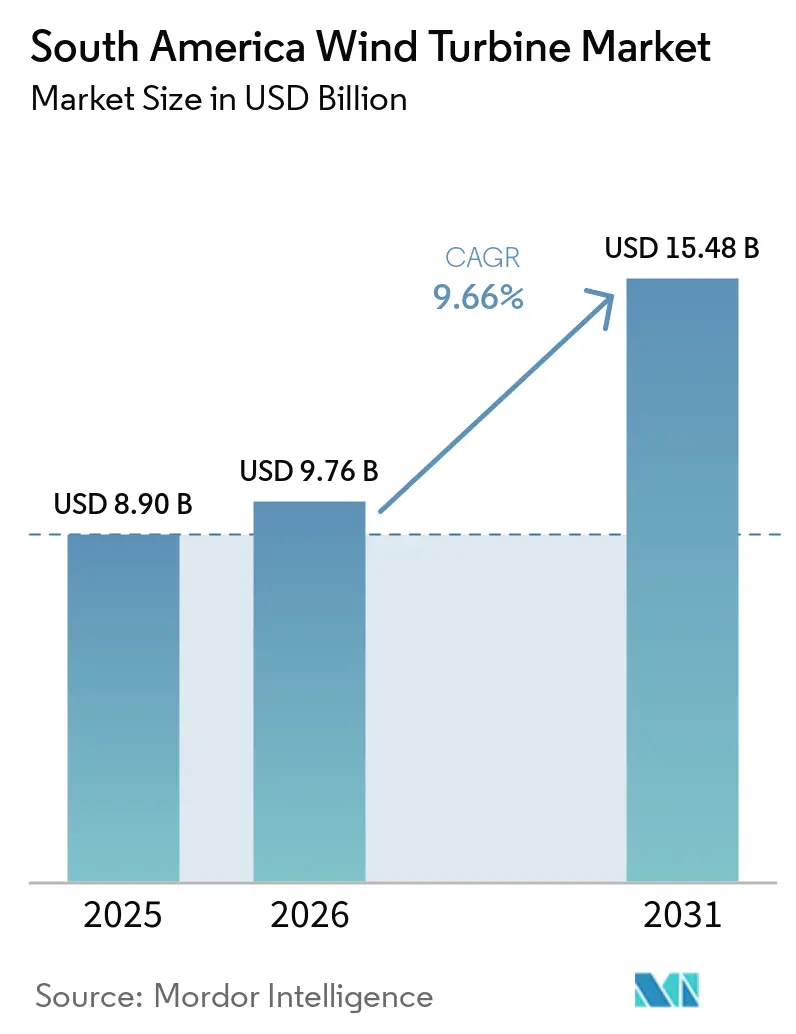
| Base Year Market Size (2025) | USD 8.90 Billion |
| Market Size (2026) | USD 9.76 Billion |
| Market Size (2031) | USD 15.48 Billion |
| Growth Rate (2026 - 2031) | 9.66% CAGR |
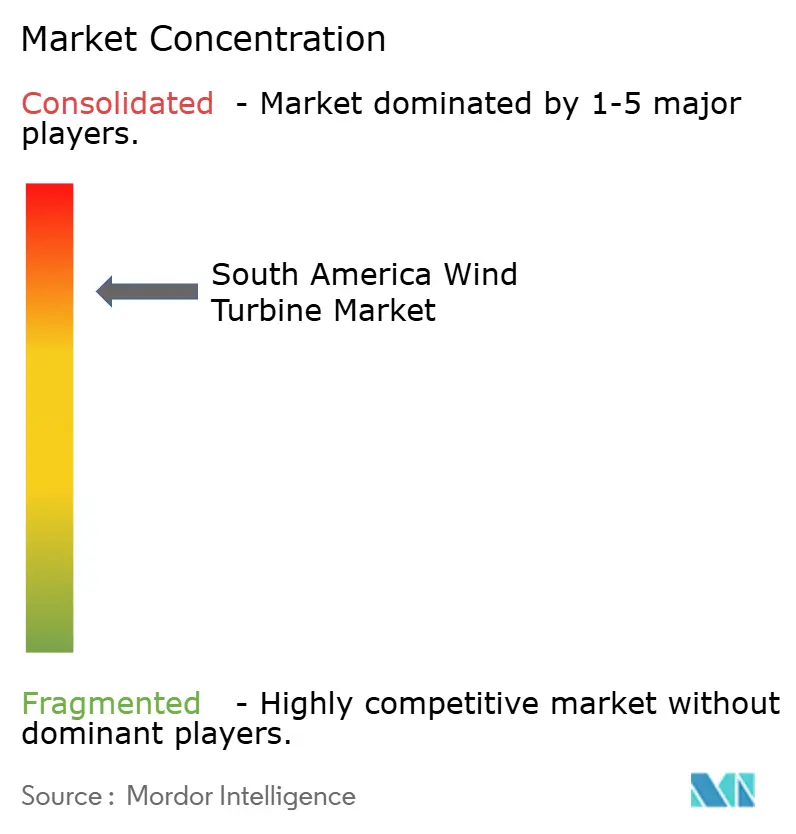
| Market Concentration | High |
Major Players *Disclaimer: Major Players sorted in no particular order Image © Mordor Intelligence. Reuse requires attribution under CC BY 4.0. | |
South America Wind Turbine Market Analysis by Mordor Intelligence
The South America Wind Turbine Market size is projected to expand from USD 8.90 billion in 2025 and USD 9.76 billion in 2026 to USD 15.48 billion by 2031, registering a CAGR of 9.66% between 2026 to 2031. The South America wind turbine market is expanding on the back of very strong onshore wind economics, especially in Brazil, where wind resources and operating performance remain unusually favorable for utility-scale development. Brazil recorded a levelized cost of electricity of USD 0.025/kWh for onshore wind in 2024, and capacity factors reached 56%, which kept wind among the region’s lowest-cost new power options. The market is also being shaped by a wider mix of buyers, as corporate offtake, industrial decarbonization programs, and export-oriented green hydrogen plans are adding demand beyond traditional grid-led procurement. National climate commitments continue to support new wind additions, with Brazil’s updated NDC targeting a 59% to 67% cut in greenhouse gas emissions below 2005 levels by 2035 and naming offshore wind and low-carbon hydrogen among policy priorities. At the same time, the South America wind turbine market is facing a more uneven operating environment, because grid congestion in Northeast Brazil is slowing project economics while pushing developers toward captive demand structures such as industrial supply, data-center contracts, and port-linked energy hubs.
Key Report Takeaways
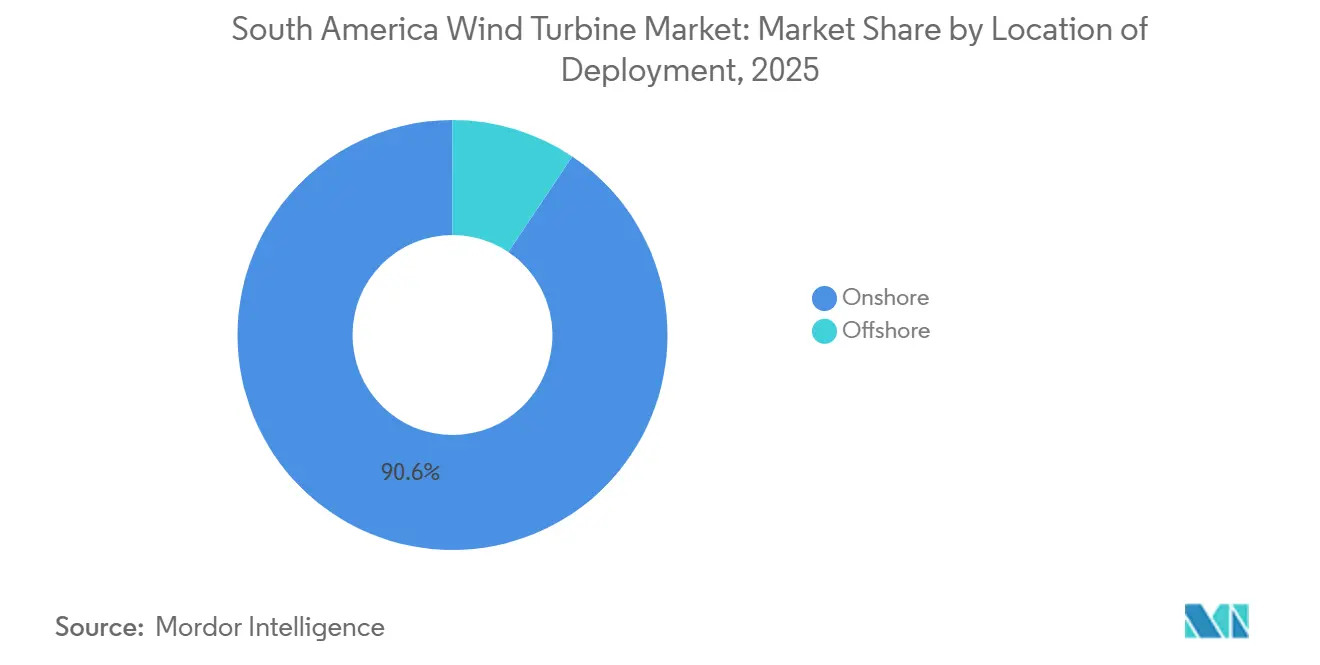
- By location of deployment, onshore held 90.6% of South America wind turbine market share in 2025, while offshore is expected to expand at 18.1% CAGR through 2031.
- By capacity rating, large turbines in the 1-5 MW range accounted for 45.7% of the market in 2025, while the above 5 MW segment is projected to record the highest CAGR of 13.8% through 2031.
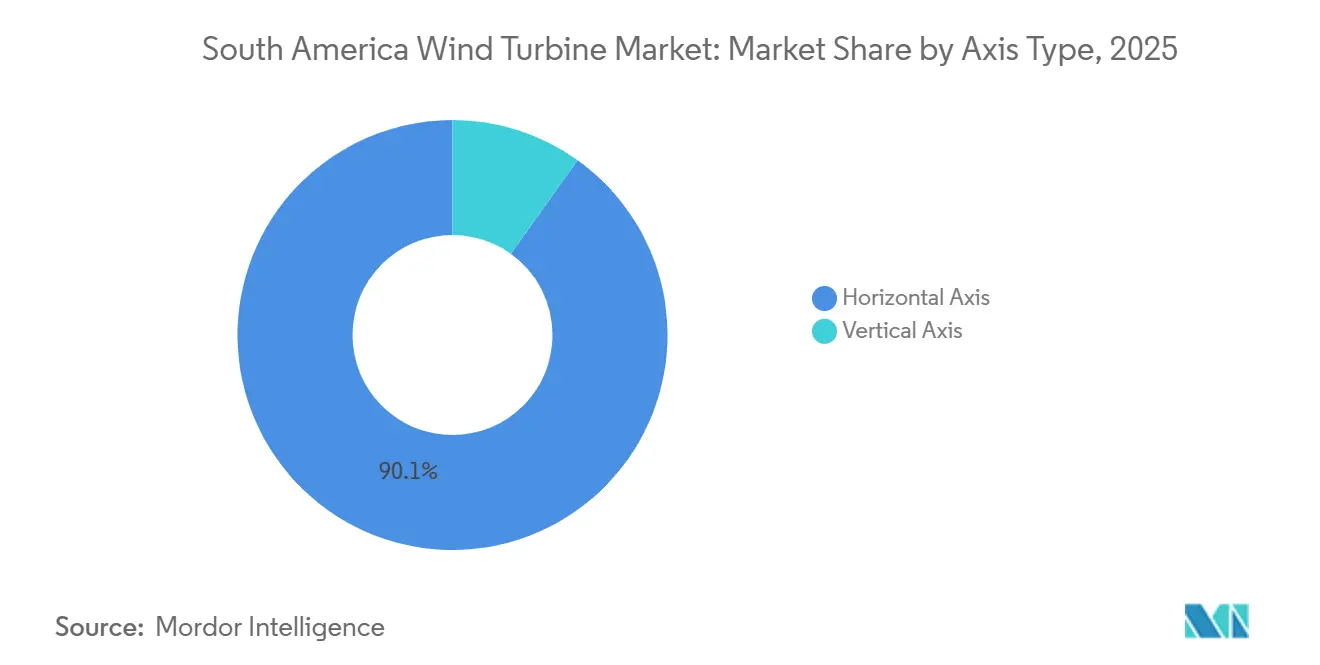
- By axis type, horizontal-axis turbines represented 90.1% of the market in 2025, while vertical-axis turbines are expected to grow at a 12.5% CAGR through 2031.
- By component, rotor blades accounted for 31.3% of the market in 2025, while power-electronics and control systems are projected to grow at an 11.8% CAGR through 2031.
- By end use, utility-scale accounted for 84.9% of the South America wind turbine market size in 2025, while commercial and industrial is expected to advance at a 14.2% CAGR through 2031.
- By geography, Brazil held 59.2% of the South America wind turbine market size in 2025, while Chile is expected to record the fastest regional growth at 12.1% CAGR through 2031.
Note: Market size and forecast figures in this report are generated using Mordor Intelligence’s proprietary estimation framework, updated with the latest available data and insights as of January 2026.
South America Wind Turbine Market Trends and Insights
Drivers Impact Analysis*
| Driver | (~) % Impact on CAGR Forecast | Geographic Relevance | Impact Timeline |
|---|---|---|---|
| Declining LCOE for onshore wind | +2.5% | Brazil (primary), Chile, Argentina | Short term (≤ 2 years) |
| Accelerating renewable-PPA and auction pipeline | +2.0% | Brazil, Chile, Colombia | Short to medium term (1–3 years) |
| National decarbonisation targets (NDC-aligned) | +1.5% | Regional (all major markets) | Medium term (2–4 years) |
| Green-hydrogen export hubs in Patagonia and NE Brazil | +1.2% | Argentina (Patagonia), Brazil (NE), Chile (Magallanes) | Medium to long term (3–6 years) |
| Data-centre-led transmission upgrades | +0.8% | Brazil (Ceará, Rio de Janeiro), Chile | Short to medium term (1–3 years) |
| State-level manufacturing incentives in Ceará and Pernambuco | +0.5% | Brazil (Ceará, Pernambuco) | Short to medium term (1–3 years) |
| Source: Mordor Intelligence | |||
Declining LCOE Turns Onshore Wind Into the Region's Cheapest Dispatchable Resource
Lower onshore generation costs remain one of the clearest supports for new turbine demand in the region. Brazil’s onshore wind LCOE fell to USD 0.025/kWh in 2024, and the country’s wind fleet achieved capacity factors of 56%, which is well above the global onshore average [1]International Renewable Energy Agency, “Renewable Power Generation Costs in 2024,” International Renewable Energy Agency, irena.org. That cost position matters because it gives developers room to preserve project returns even when financing stays expensive or transmission access becomes less predictable. It also keeps onshore projects competitive in procurement rounds and bilateral contracts, especially in Brazil’s Northeast and other high-wind corridors. For the South America wind turbine market, this means the base case for new installations is still being set by onshore economics rather than by policy support alone.
Renewable-PPA and Auction Pipeline Extends Contract Certainty Beyond Government Offtake
The demand base for new wind projects is becoming broader than the earlier model that depended mainly on government-led auctions. Corporate buyers, industrial users, and large digital infrastructure operators are taking a larger role in long-term renewable procurement, which gives developers more than one route to contract revenues. Amazon announced an investment of more than USD 4 billion to launch an AWS infrastructure region in Chile by the end of 2026, with renewable energy forming part of the operating model for that site. [2]Amazon, “Amazon to Invest More Than $4 Billion to Launch Infrastructure Region in Chile,” Amazon, press.aboutamazon.com This matters for project development because a deeper buyer pool can support wind additions even when sovereign procurement slows. In the South America wind turbine market, that change is improving contract diversity and favoring developers that can match wind generation profiles with the needs of large, creditworthy offtakers.
Green-Hydrogen Export Hubs Co-locate Wind Infrastructure at Port-Adjacent Sites
Green hydrogen is creating a new layer of demand for wind capacity in parts of South America with strong resources and export access. In these projects, wind farms are increasingly planned as dedicated generation for electrolysis rather than as simple grid-connected assets. That distinction is important because it changes how developers think about siting, transmission dependence, and offtake risk. It also makes port regions and industrial corridors more attractive, since the value of generation can be linked to export production instead of wholesale power prices alone. For the South America wind turbine market, this emerging demand model could support larger turbine orders in areas where captive consumption can absorb output that might otherwise face curtailment.
Data-Centre-Led Transmission Upgrades Generate Incremental Wind Demand
Digital infrastructure is adding a new source of electricity demand that fits well with large-scale renewable procurement. Amazon’s Chile investment shows that hyperscale expansion is now tied directly to renewable energy sourcing, which strengthens the case for new wind capacity around major load centers and data infrastructure corridors. This matters beyond direct power sales because large, long-duration buyers can also help justify transmission upgrades and grid interconnections that benefit surrounding renewable projects. In practical terms, data-center demand is starting to matter not only as an offtake source but also as a catalyst for broader system investment. That makes the South America wind turbine market more connected to digital capex cycles than it was only a few years ago.
Restraints Impact Analysis*
| Restraint | (~) % Impact on CAGR Forecast | Geographic Relevance | Impact Timeline |
|---|---|---|---|
| Grid congestion and curtailment in NE Brazil | -1.8% | Brazil (Ceará, Rio Grande do Norte, Bahia) | Short to medium term (ongoing through ~2029) |
| Turbine-component port and logistics bottlenecks | -0.9% | Brazil (Fortaleza, Suape, Pecém ports), Argentina, Chile | Short to medium term (1–3 years) |
| Currency volatility and high financing costs across emerging South American economies | -1.2% | Brazil, Argentina, Colombia | Medium term (2–4 years) |
| Limited local manufacturing capacity for large turbine components and dependence on imports | -0.7% | Brazil (NE), Chile, Argentina | Medium to long term (3–5 years) |
| Source: Mordor Intelligence | |||
Grid Congestion Creates Structural Revenue Risk Across NE Brazil's Wind Belt
Grid congestion in Northeast Brazil remains the main operating constraint for utility-scale wind projects. Curtailment losses for wind and solar plants rose 220% in 2025 and reached 32.9 million MWh, which shows how quickly the issue has moved from a local operating challenge to a broader investment concern. The market effect is clear even without assigning every lost megawatt-hour to a single project, because lenders, OEMs, and developers now have to account for weaker utilization in areas that were once seen as the safest wind corridors. This is why the South America wind turbine market is still growing, but with stronger attention on location quality, local demand pairing, and the pace of transmission reinforcement.
Currency Volatility and High Capital Costs Act as a Structural Barrier to Foreign Investment
Financing conditions remain a structural challenge across several South American countries, especially where long-dated hedging is thin and local currencies are volatile. This matters for wind because projects are capital intensive, asset lives are long, and financing terms shape total project returns as much as turbine performance does. The Inter-American Development Bank and Brazil’s Central Bank signed an agreement in November 2025 to unlock up to USD 3.4 billion in foreign-exchange hedging instruments under the Eco Invest Brasil program, which was designed to reduce currency risk for private investors in renewable projects. [3]Inter-American Development Bank, “IDB-Brazil Central Bank Agreement Unlocks $3.4 Billion in FX Hedging to Mobilize Private Investment,” Inter-American Development Bank, iadb.org Even with that support, the region still carries a financing burden that is higher than in mature wind markets, and this can delay investment decisions or reduce the size of procurement packages. For the South America wind turbine market, the result is a growth pattern that remains positive but more sensitive to sovereign risk, local capital costs, and project structuring discipline.
*Our forecasts treat driver/restraint impacts as directional, not additive. The impact forecasts reflect baseline growth, mix effects, and variable interactions.
Segment Analysis
By Location of Deployment: Onshore Commands the Base, Offshore Reframes the Growth Story
Onshore represented 90.6% of the installed base in 2025, which kept it firmly at the center of turbine demand across the region. This part of the South America wind turbine market continues to benefit from established land-based development corridors in Brazil, Argentina, and Chile, where wind resources are strong and the delivery model is already familiar to lenders and utilities. Onshore projects also fit existing manufacturing and logistics networks better than offshore projects do, which helps preserve cost competitiveness when supply conditions tighten. That advantage is especially important in a region where local content, financing access, and transport execution can still influence project bankability almost as much as turbine technology.
Offshore starts from a much smaller base, but it is projected to grow at an 18.1% CAGR through 2031, which makes it the fastest-moving deployment category in the South America wind turbine market. The growth case rests on future platform scaling, a formalizing policy framework in Brazil, and increasing interest in coastal industrial clusters that could use offshore power over time. Even so, offshore will remain a smaller revenue pool than onshore through most of the forecast period because it still needs port readiness, supply-chain depth, and project execution experience. The main near-term effect is therefore strategic rather than volumetric, since offshore is changing how OEMs, developers, and governments think about future manufacturing, service capabilities, and coastal infrastructure.


By Capacity Rating: Large Turbines Lead, Very Large Platforms Gain Ground
Large turbines in the 1-5 MW range accounted for 45.7% of the market in 2025, which reflects how most regional wind projects were built over the past decade. That installed base keeps the segment important because fleet familiarity, service capabilities, and financing comfort are already in place for this rating class. In practice, this gives developers a stable reference point when they evaluate new procurement decisions in Brazil’s Northeast, Patagonia, and Chile’s wind corridors. It also means the large-turbine class still anchors most near-term order activity even as developers look for larger machines.
The above 5 MW segment is projected to record the fastest growth at 13.8% CAGR, driven by a search for higher yield per unit, fewer turbines per project, and better economics in large greenfield developments. Goldwind’s first overseas factory in Brazil began producing turbines in the 5.3 MW to 7.5 MW range in 2024, which showed that the regional supply picture is starting to adapt to higher-capacity machines. The South America wind turbine industry is therefore moving toward a wider mix of ratings, but the shift will be gradual because developers still have to balance turbine scale against logistics, site conditions, and available grid capacity. Over the forecast period, the very large category should gain share mainly in projects where stronger output and lower balance-of-system intensity can offset the execution complexity that comes with bigger components.
By Axis Type: Horizontal Axis Dominates, Vertical Axis Finds Its Niche
Horizontal-axis turbines held 90.1% of the installed base in 2025, which makes them the clear standard for utility-scale deployment across the region. That position is rooted in established supply chains, proven operating performance, and the fact that most developers, operators, and lenders already know how to underwrite this technology. In the South America wind turbine market, that installed base advantage makes displacement difficult because the technology is already embedded in service networks, spare-parts planning, and project design standards. It also means most volume demand will stay tied to horizontal-axis platforms over the forecast period.
Vertical-axis turbines are forecast to grow at a 12.5% CAGR, but they are growing from a much smaller base and remain focused on narrower use cases. Their role is strongest in distributed settings where space, sound, or urban siting constraints make conventional machines less practical. This keeps them relevant for smaller commercial, rural, and micro-grid applications rather than for regional utility-scale additions. The South America wind turbine industry may therefore see vertical-axis demand expand steadily, but it will remain a complement to the mainstream fleet rather than a substitute for it.
By Component: Rotor Blades Lead Value Share, Power-Electronics Emerge as the Technology Battleground
Rotor blades accounted for 31.3% of installed-base value in 2025, which made them the largest component category in the region. That share reflects both their cost weight within a turbine and the logistical difficulty of moving large blades across long distances to inland project sites. In the South America wind turbine market, blade demand remains closely tied to local manufacturing health because shutdowns, restructuring, or transport bottlenecks can quickly disrupt delivery schedules and cost planning. This is one reason component strategy matters as much as turbine selection when developers assess project timing.
Power-electronics and control systems are forecast to grow at 11.8% CAGR through 2031, and that points to a more software-heavy phase of competition. As grid conditions become less predictable and storage integration becomes more relevant, developers are placing greater value on controls, monitoring, and system flexibility. That trend is important because it shifts part of the competitive discussion away from hardware cost alone and toward how well a turbine can operate under curtailment, ramping, and power quality requirements. The South America wind turbine market is therefore likely to see growing differentiation in component packages, especially where developers need tighter grid compliance and stronger operational visibility.
By End-Use Application: Utility Scale Anchors Volume, C&I Contracts Reframe Risk Allocation
Utility-scale projects represented 84.9% of end-use demand in 2025, which confirms that large centralized procurement still defines the market’s volume base. This share reflects the scale advantages of major wind corridors and the fact that regional project economics still work best where large sites can be developed around high resource quality. In the South America wind turbine market, utility-scale will remain the main revenue engine because the installed base, financing model, and operating experience all favor large projects. It also keeps the developer and OEM landscape tied closely to grid planning, land access, and transmission timing.
Commercial and industrial demand is expanding faster, with a projected CAGR of 14.2% through 2031. IFC’s financing for PCR’s 185.6 MW Olavarría Wind Farm in Argentina showed how corporate-linked project structures are gaining relevance, especially when industrial users need cleaner power and more direct control over supply. [4]International Finance Corporation, “IFC Supports Landmark Wind Power and Transmission Project in Argentina,” International Finance Corporation, ifc.org This part of the South America wind turbine market is growing because it reduces reliance on a single procurement model and opens demand from manufacturing, mining, digital infrastructure, and self-supply arrangements. Residential and micro-grid demand remains smaller, but it still matters in remote areas where hybrid systems can be the practical route to new electricity access.
Geography Analysis
Brazil accounted for 59.2% of the market in 2025, which kept it as the clear anchor of regional demand. Brazil also held 59.2% of South America wind turbine market share in 2025, supported by some of the strongest onshore economics in the world. Brazil’s onshore wind LCOE reached USD 0.025/kWh in 2024, and capacity factors climbed to 56%, which reinforced the country’s role as the main volume center for the South America wind turbine market. Renewable sources accounted for 84.6% of Brazil’s electricity mix, and wind alone contributed 15% of generation in 2024. Brazil’s updated climate plan also supports continued wind buildout by linking emissions reduction goals with offshore wind and low-carbon hydrogen development.
Chile is the fastest-growing geography, with a projected CAGR of 12.1% through 2031. The country’s wind outlook is being supported by a deep project pipeline, better policy momentum, and a growing role for renewable power in industrial and digital demand. Chile’s Committee of Ministers cleared administrative appeals on 3 stalled renewable projects in March 2026, which improved visibility for delayed investments and showed a firmer permitting stance. Amazon’s plan to launch an AWS infrastructure region in Chile by the end of 2026 adds another source of long-term renewable demand that supports the South America wind turbine market in that country.
Argentina and Colombia remain smaller today, but both offer meaningful upside for the South America wind turbine market if execution risks are managed well. Argentina benefits from very strong wind conditions, especially in Patagonia, and project finance structures are becoming more workable when multilateral support is present. IFC’s March 2026 financing for PCR’s Olavarría project showed that bankable wind investments can still move forward in Argentina when transmission and funding are packaged carefully. Colombia has a smaller installed base, but its wind future still depends heavily on La Guajira, where resource quality is high and project sequencing is tied closely to social consultation and transmission readiness. Across both countries, the opportunity is real, but the pace of growth will depend less on resource potential than on financing stability, permitting consistency, and the ability to convert large plans into operating assets.
Competitive Landscape
The South America wind turbine market is concentrated, with a small group of global OEMs holding the strongest regional positions while newer suppliers try to build order share. European manufacturers still lead the installed base, especially in projects that required established service networks, familiar financing assumptions, and local operating history. At the same time, Chinese suppliers are becoming more visible in higher-capacity platforms and price-sensitive tenders, which is raising pressure on margins and widening the competitive field. This mix gives the South America wind turbine market a split structure, where incumbents still lead on installed depth but challengers are shaping the next round of procurement choices. The result is not a closed market, but it is one where execution credibility still matters as much as quoted turbine price.
Vestas remains one of the strongest names in the region because it combines local manufacturing relevance with recent large contract wins. The company announced the 828 MW Dom Inocêncio partnership with Casa dos Ventos in December 2025 and secured the 230 MW Esquina do Vento order from Equinor and Rio Energy in March 2026. Nordex also retains a meaningful position, with more than 3.7 GW commissioned in Brazil and local assembly that supports project execution and domestic content alignment. These moves matter because scale, localization, and service reach still carry more weight than brand visibility alone in the South America wind turbine market.
Among developers and independent power producers, the competitive pattern is shifting toward platforms that can link resource access, contracting, and long-duration offtake. ENGIE strengthened that position when it fully commissioned the 846 MW Serra do Assuruá Wind Complex in Brazil in December 2025, one of the region’s largest onshore developments. Corporate-linked financing is also becoming more important, as shown by IFC’s support for the Olavarría wind and transmission project in Argentina. Over time, the South America wind turbine market should reward companies that can manage not only turbine supply, but also transmission exposure, contract quality, and industrial offtake alignment. That is especially true in markets where grid risk, currency risk, and local execution still shape the difference between an announced project and a completed one.
South America Wind Turbine Industry Leaders
Vestas Wind Systems A/S
Siemens Gamesa Renewable Energy SA
GE Vernova
Nordex SE
Goldwind
- *Disclaimer: Major Players sorted in no particular order

Recent Industry Developments
- March 2026: Chile's Committee of Ministers cleared administrative appeals on three stalled wind and hybrid projects totalling over USD 1 billion, including AES Andes' Rinconada wind park in Bio Bío and Hy2Wind's Los Coihues wind farm in Ñuble, signalling an accelerated permitting posture.
- March 2026: Equinor and Rio Energy ordered 51 Vestas V163-4.5 MW turbines for the 230 MW Esquina do Vento Wind Project in Rio Grande do Norte, with installation scheduled from March 2027 and a 30-year AOM 5000 service agreement.
- February 2026: IFC provided a USD 110 million senior corporate loan for PCR's 185.6 MW Olavarría Wind Farm in Buenos Aires province, the first renewable project in Argentina to integrate privately financed transmission infrastructure into the SADI national grid.
- December 2025: ENGIE fully commissioned the 846 MW Serra do Assuruá Wind Complex in Gentio do Ouro, Bahia, comprising 188 turbines across 24 wind farms and 28 km of dedicated transmission lines.


South America Wind Turbine Market Report Scope
A wind turbine is a renewable energy device that transforms wind's kinetic energy into electricity using rotating blades connected to a generator. Commonly utilized in onshore and offshore wind farms, wind turbines offer a clean and sustainable energy source, contributing to reduced carbon emissions and decreased reliance on fossil fuels.
The South America wind turbine market is segmented by location, capacity, axis, component, end-use, and geography. By location, the market is segmented into onshore and offshore. By capacity, the market is segmented into small, medium, large, and very large. By axis, the market is segmented into horizontal and vertical. By component, the market is segmented into rotor blades, nacelle and drivetrain, generator, tower, and power-electronics and control. By end-use, the market is segmented into utility-scale, commercial and industrial, and residential and micro-grid. The report also covers the market sizes and forecasts for the South America wind turbine market across major countries in the region. For each segment, the market sizing and forecasts have been done on the basis of value (USD).
| Onshore | |
| Offshore | Fixed-bottom |
| Floating |
| Small (Below 100 kW) |
| Medium (100 kW to 1 MW) |
| Large (1 to 5 MW) |
| Very Large (Above 5 MW) |
| Horizontal Axis |
| Vertical Axis |
| Rotor Blades |
| Nacelle and Drivetrain |
| Generator |
| Tower |
| Power-Electronics and Control |
| Utility-Scale |
| Commercial and Industrial |
| Residential and Micro-grid |
| Brazil |
| Chile |
| Argentina |
| Colombia |
| Rest of South America |
| By Location of Deployment | Onshore | |
| Offshore | Fixed-bottom | |
| Floating | ||
| By Capacity Rating | Small (Below 100 kW) | |
| Medium (100 kW to 1 MW) | ||
| Large (1 to 5 MW) | ||
| Very Large (Above 5 MW) | ||
| By Axis Type | Horizontal Axis | |
| Vertical Axis | ||
| By Component | Rotor Blades | |
| Nacelle and Drivetrain | ||
| Generator | ||
| Tower | ||
| Power-Electronics and Control | ||
| By End-Use Application | Utility-Scale | |
| Commercial and Industrial | ||
| Residential and Micro-grid | ||
| By Geography | Brazil | |
| Chile | ||
| Argentina | ||
| Colombia | ||
| Rest of South America | ||


Key Questions Answered in the Report
What is the current outlook for South America wind turbine demand?
The South America wind turbine market was valued at USD 8.90 billion in 2025, reached USD 9.76 billion in 2026, and is forecast to reach USD 15.48 billion by 2031 at a 9.66% CAGR.
Which deployment type leads regional installations?
Onshore leads by a wide margin, with 90.6% of the installed base in 2025, while offshore is the fastest-growing deployment type with an 18.1% CAGR through 2031.
Why does Brazil lead regional turbine purchases?
Brazil held 59.2% of the regional market in 2025 because it combines very low onshore wind costs, strong capacity factors, and a large installed project pipeline.
Which turbine size category is growing fastest in South America?
Turbines above 5 MW are expanding fastest, with a projected CAGR of 13.8% through 2031, as developers seek higher output per unit and lower balance-of-system intensity.
What is the biggest operating risk for wind projects in Brazil?
Grid congestion and curtailment in Northeast Brazil remain the main risk because they weaken plant utilization and make project returns more sensitive to location and transmission timing.
Page last updated on:


