
Market Overview
| Study Period | 2021 - 2031 |
|---|---|
| Forecast Data Period | 2026 - 2031 |
| Base Year Market Size (2025) | 365.97 gigawatt |
| Market Volume (2026) | 400.78 gigawatt |
| Market Volume (2031) | 615.31 gigawatt |
| Growth Rate (2026 - 2031) | 8.95 % |
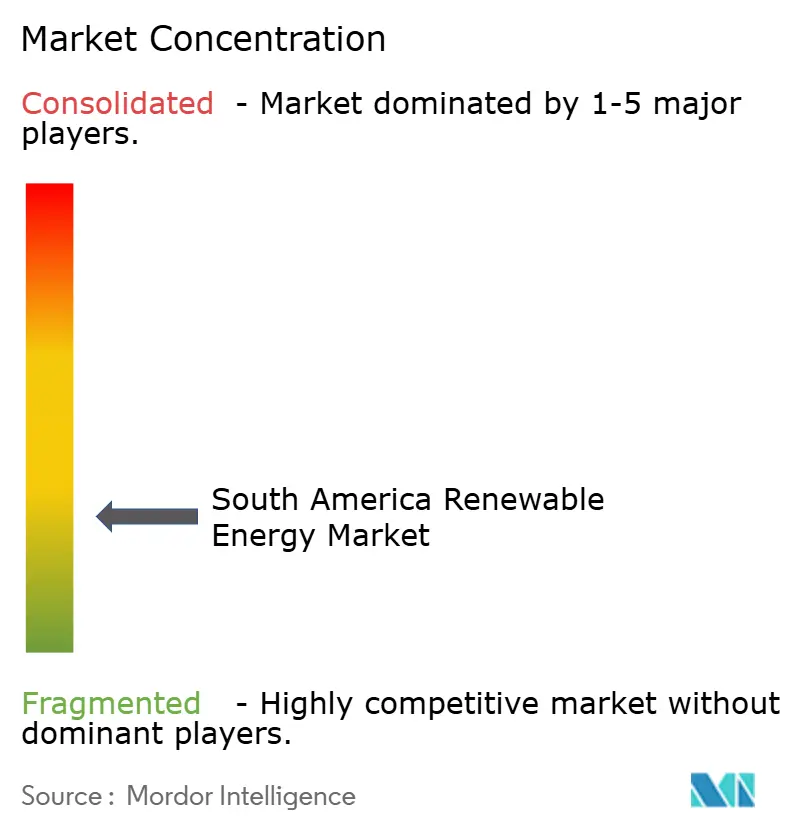
| Market Concentration | Low |
Major Players *Disclaimer: Major Players sorted in no particular order Image © Mordor Intelligence. Reuse requires attribution under CC BY 4.0. | |
South America Renewable Energy Market Analysis by Mordor Intelligence
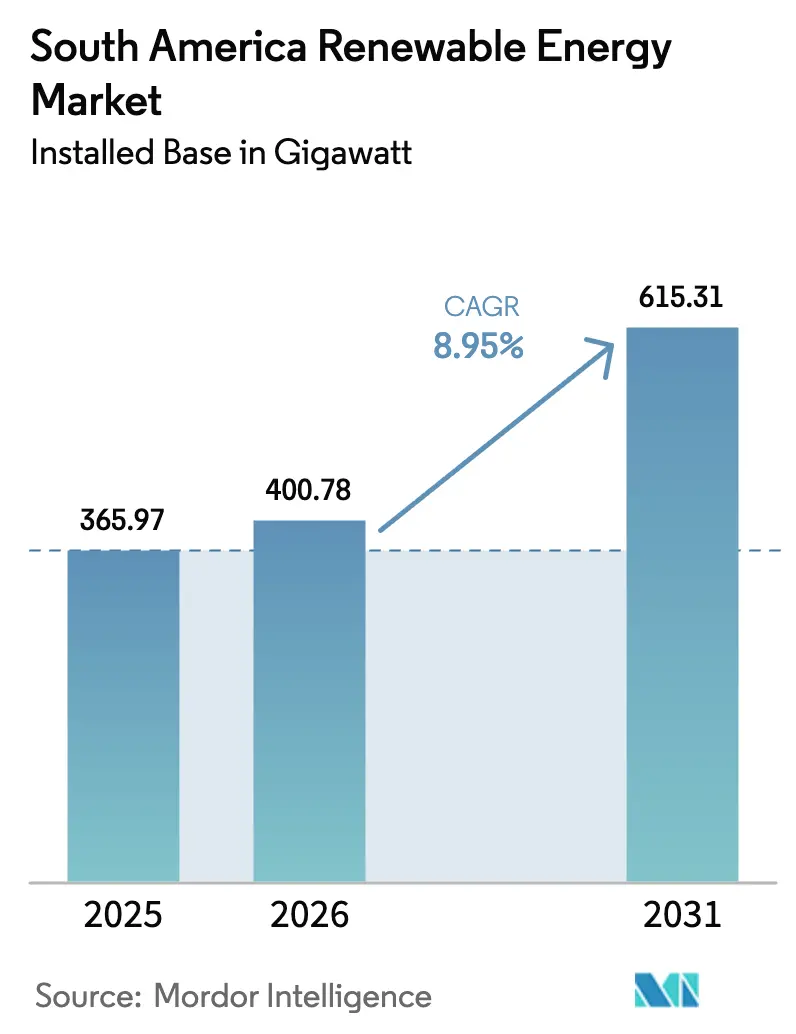
The South America Renewable Energy Market size in terms of installed base is projected to be 365.97 gigawatt in 2025, 400.78 gigawatt in 2026, and reach 615.31 gigawatt by 2031, growing at a CAGR of 8.95% from 2026 to 2031.
Competitive auctions, lower levelized costs, and long-term corporate power-purchase agreements are aligning to pull fresh capital into utility-scale assets. Falling solar and wind tariffs now undercut thermal generation, while battery storage is easing variability concerns. Mining conglomerates are locking in 20-year fixed-price contracts to decarbonize off-grid operations, and green-hydrogen export plans are reshaping site selection toward coastal and desert regions. Developers that pair generation with storage secure cheaper funding, as lenders view the hybrids as dispatchable resources with stable cash flows.
Key Report Takeaways
- By technology, hydropower led with 52.98% of the South America renewable energy market share in 2025, while solar is forecast to expand at an 18.30% CAGR through 2031.
- By end-user, utilities held 77.67% of capacity in 2025, but the commercial and industrial segment is projected to grow at a 13.88% CAGR to 2031.
- By geography, Brazil commanded 63.09% of capacity in 2025, and Chile is set to record the fastest 17.19% CAGR over 2026-2031.
Note: Market size and forecast figures in this report are generated using Mordor Intelligence’s proprietary estimation framework, updated with the latest available data and insights as of January 2026.
South America Renewable Energy Market Trends and Insights
Drivers Impact Analysis*
| Driver | (~) % Impact on CAGR Forecast | Geographic Relevance | Impact Timeline |
|---|---|---|---|
| Auction programs expanding project pipeline | +2.1% | Brazil, Chile, Colombia, Argentina | Medium term (2-4 years) |
| Declining LCOE for solar PV and onshore wind | +1.8% | Regionwide, strongest in Brazil and Chile | Short term (≤ 2 years) |
| Green-hydrogen export ambitions | +1.5% | Chile, Brazil northeast, Argentina Patagonia | Long term (≥ 4 years) |
| Mining-sector corporate PPAs | +1.3% | Chile, Peru, Brazil Minas Gerais and Pará | Medium term (2-4 years) |
| Grid-connected batteries | +1.0% | Brazil, Chile, Argentina | Medium term (2-4 years) |
| Source: Mordor Intelligence | |||
Renewable-Energy Auction Programs Accelerating Project Pipeline
Competitive tenders replaced feed-in tariffs after 2023. Brazil, Chile, and Colombia jointly awarded 8.5 GW in 2024-2025, and penalty clauses now force bidders to secure equipment and grid permits before signing, which cuts speculation and speeds build schedules. Brazil’s 2024 reserve auction cleared 3.1 GW at USD 28 per MWh, a record low that showed solar-plus-storage can compete with gas peakers. Chile’s 2025 2.5 GW call mandates four-hour batteries, ensuring a firm evening supply. Colombia’s 2.2 GW award in 2024 reopened its stalled market, while Argentina’s provinces tendered 800 MW of wind to bypass federal budget limits. These rules give investors confidence that contracted assets will connect on time and earn revenue from day one.
Declining LCOE for Solar PV and Onshore Wind
Utility-scale solar averaged USD 29 per MWh in 2024 as bifacial modules and single-axis trackers boosted yields by up to 20%.[1] Onshore wind fell to USD 35 per MWh, helped by 120-meter hub heights that catch steadier flows in Brazil’s northeast. Chile’s Atacama solar parks signed sub-USD 20 PPAs in 2024, prompting early retirement of 1.2 GW of coal. Wind farms in Bahia logged more than 50% capacity factors in 2024, shrinking payback periods to under seven years. Cost parity against fossil assets has ended the need for subsidies, letting corporate buyers sign direct PPAs at tariffs 10-15% below retail rates.
Green-Hydrogen Export Ambitions Driving Utility-Scale Additions
Chile targets 25 GW of electrolyzers by 2030, which will need 40 GW of dedicated renewables.[2] The first 1.5 GW of linked capacity won contracts in 2024, locking in offtake with German and Japanese buyers. Brazil’s northeast coast plans 7 GW of offshore wind to feed hydrogen hubs near Ceará ports, and Uruguay commissioned a 10 MW pilot to produce ammonia for export. Investors accept slightly lower tariffs in exchange for 20-year hydrogen contracts, which cut merchant risk and pull in cheaper debt.
Mining-Sector Corporate PPAs for Off-Grid Decarbonization
Miners signed 4.2 GW of renewable PPAs in 2024-2025 to meet Scope 2 goals. Codelco inked a 1.8 TWh annual supply deal backed by 375 GWh of batteries, guaranteeing round-the-clock power for smelters in the Atacama. Anglo American committed USD 500 million for 300 MW of solar-plus-storage at Brazilian iron-ore sites, while Peru’s Antamina mine secured 120 MW of wind. Take-or-pay clauses and inflation-indexed tariffs turn these contracts into quasi-utility revenue streams, drawing pension funds seeking stable yields.
Restraints Impact Analysis*
| Restraint | (~) % Impact on CAGR Forecast | Geographic Relevance | Impact Timeline |
|---|---|---|---|
| Transmission bottlenecks and delays | -1.2% | Brazil Bahia, Chile Atacama, Argentina Patagonia | Short term (≤ 2 years) |
| Foreign-exchange volatility | -0.9% | Argentina, Brazil, Colombia | Medium term (2-4 years) |
| Local-content rules raising OEM capex | -0.6% | Brazil, Argentina | Medium term (2-4 years) |
| Source: Mordor Intelligence | |||
Transmission Bottlenecks and Interconnection Delays
Brazil’s Bahia queue reached 5.4 GW in late 2024, stretching average wait times to 18 months as new substations lag project completion. Chile’s Atacama backlog stranded 3 GW and caused 1.8 TWh of curtailment in 2024. Patagonia wind projects face a 24-month delay because high-voltage links to Buenos Aires remain unfunded. Long queues raise development costs 10-15% and erode tariff margins, pushing sponsors to demand grid-access guarantees before closing debt.
Local-Content Rules Increasing OEM Capex
Brazil requires 60% local content for wind and 50% for solar to tap BNDES loans, adding up to 12% to hardware prices. Vestas opened a nacelle plant in Bahia in 2024 to comply, but ramp-up delays lengthened lead times by four months.[3] Argentina’s 30% rule inflated turbine prices by 15% because local suppliers cannot reach scale. While the mandates created about 12,000 manufacturing jobs, they cut developer margins by 200-300 basis points and slowed project schedules.
*Our forecasts treat driver/restraint impacts as directional, not additive. The impact forecasts reflect baseline growth, mix effects, and variable interactions.
Segment Analysis
By Technology: Solar Surges as Hydro Dominance Wanes
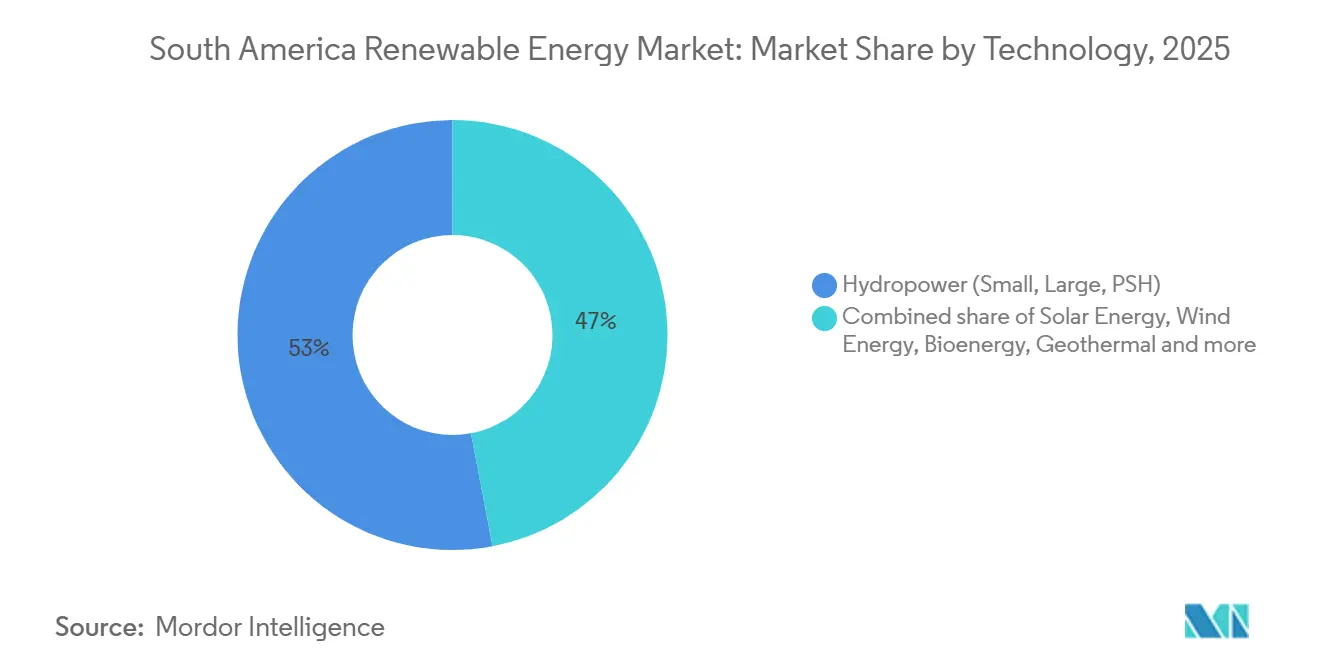
Hydropower held 52.98% of 2025 capacity, yet environmental permitting and variable rainfall slow new builds. Solar will grow at an 18.30% CAGR, the fastest of any technology, propelled by sub-USD 30 per MWh economics and modular designs that skirt transmission bottlenecks. Wind adds about 4.5 GW annually, boosted by 50% capacity factors in Brazil’s northeast. Bioenergy contributes 12 GW through bagasse-fired cogeneration, anchored by Brazil’s RenovaBio targets. Emerging niches include pumped-storage hydropower such as Brazil’s 401 MW Sinop project, which delivers eight-hour discharge capability. Offshore wind development is taking shape with a 16 GW Brazilian pipeline aiming for first turbines in 2027.
Solar’s rapid buildout is shifting the power mix, yet higher variable output requires storage for evening peaks. Concentrated solar power remains marginal beyond Chile’s 110 MW Cerro Dominador plant due to USD 6,000-per-kW costs. Geothermal holds 48 MW at Cerro Pabellón, though Enel is exploring another 200 MW in the Andes. Ocean energy is still confined to pilot projects with capital costs above USD 10,000 per kW. The South America renewable energy market size allocated to solar and wind will therefore expand faster than hydro until 2031, provided that storage and grid upgrades keep pace.

By End-User: C&I Segment Accelerates Behind Utilities
Utilities controlled 77.67% of capacity in 2025 because auction volumes feed directly into their portfolios. The commercial and industrial segment is set to grow at a 13.88% CAGR, powered by behind-the-meter rooftop solar in Brazil and Chile. Distributed solar in Brazil hit 39 GW in 2024, and 28 GW came from C&I rooftops that shave bills 30-40% below grid rates. Chile’s revised net-metering lets businesses sell surplus electricity at 70% of retail rates, adding 1.2 GW of new rooftops in 2024. Mining PPAs form the largest anchor load within C&I, while residential systems reached 8 GW in 2025, mostly in Brazil’s southeast.
Currency instability curbed Argentina’s residential uptake in 2024, but property-tax breaks in Mendoza revived sales in 2025. Colombia’s residential market stayed small at 200 MW as low tariffs lengthen payback periods. As corporate buyers chase price certainty, the South America renewable energy market will see more capacity shift from utilities to C&I rooftops, easing the strain on transmission lines.

Geography Analysis
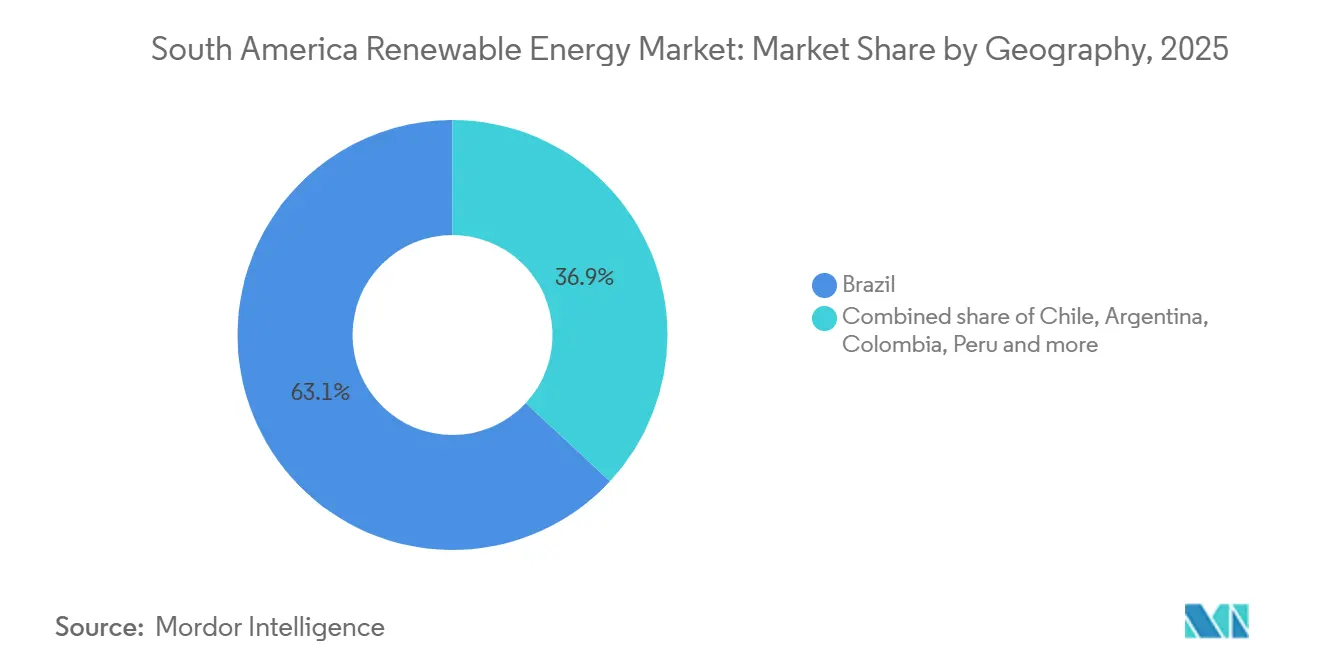
Brazil held 63.09% of 2025 capacity with 100 GW of hydro, 45 GW of wind, 39 GW of distributed solar, and 28 GW of utility solar. An August 2024 reserve auction cleared 3.1 GW at USD 28 per MWh and allocated 60% to solar-plus-storage hybrids. A 1.6 GW storage tender the same year underscored a grid-flexibility pivot as variable renewables crossed 30% penetration. Offshore wind is gaining traction through Petrobras’s 7 GW plan and Iberdrola’s 14 GW pipeline, each targeting 2027 installation. ANEEL approved USD 2.1 billion in new lines to ease Bahia and Rio Grande do Norte.
Chile will post the region’s quickest 17.19% CAGR over 2026-2031. Green-hydrogen export contracts secured 1.5 GW of dedicated renewable capacity in 2024, and battery mandates require 20% storage pairing for all large projects from 2025. Transmission upgrades now fast-track 500 kV lines from Atacama to Santiago. Codelco’s 1.8 TWh annual PPA, backed by 375 GWh of batteries, shows how mining demand anchors growth.
Argentina logged 12 GW of capacity in 2025, mainly wind in Patagonia, but currency swings delayed 1.2 GW of new builds. Provincial auctions for 800 MW of wind used multilateral finance to sidestep federal policy gaps. Colombia returned from a five-year pause with 2.2 GW of 2024 auction awards in La Guajira, while Peru advanced 1.5 GW of pipeline projects spearheaded by Enel’s 240 MW Wayra expansion. Uruguay, Paraguay, Ecuador, and Bolivia combined for 8.2 GW in 2025, led by Uruguay’s 10 MW hydrogen pilot.
Regulatory Landscape
Across South America, the policy mix is shifting from procurement-first mechanisms toward grid integration and flexibility rules that improve the bankability of variable renewables. In Brazil, the regulator ANEEL issued Normative Resolutions No. 1.161/2026 and 1.162/2026 in June 2026, formally treating energy storage as a regulated activity and setting requirements for authorization, grid connection, metering, and billing. This follows Brazil's Law No. 15.269/2025, which set guidelines for regulating storage to support tariff affordability and energy security, aligning auctions and interconnection rules with the growing role of hybrid solar-wind-battery projects.
Chile is pairing its renewable buildout with planning and integration instruments, including the Ministry of Energy's Ruta Energetica 2026-2030 roadmap and the launch of the participatory process for the 2028-2032 Long-Term Energy Planning (PELP) in April 2026. Outside the largest markets, Paraguay modernized its legal framework for non-conventional, non-hydraulic renewables through Law No. 7599/2025 (promulgated in 2026), which points to a clearer permitting and compliance pathway for solar and wind developers and self-generation schemes.
Competitive Landscape
The top ten companies controlled about 45% of installed capacity in 2025, pointing to moderate fragmentation. Enel, Iberdrola, and ENGIE integrate generation, transmission, and retail, giving them bidirectional flexibility to balance portfolios and hedge demand swings. Independent power producers such as Atlas Renewable Energy and Brookfield Renewable Partners focus on long-dated corporate PPAs that secure sub-5% financing. Equipment majors Vestas, Siemens Gamesa, and GE Renewable Energy add digital-twin software that lifts annual output by 3% at installations like the 846 MW Serra do Assuruá wind farm.[4]
Hybrid solar-wind-battery projects are a white-space niche that rewards developers with storage expertise. ABO Wind and Mainstream Renewable Power chase sub-100 MW assets in Peru and Colombia, where large utilities have limited reach. Chinese OEMs Canadian Solar and Trina Solar are moving upstream into project development, using supply chain control to trim EPC costs 10-15% below Western rivals. Local-content hurdles and ISO 14001 compliance favor incumbents with established manufacturing bases and regulatory teams.
South America Renewable Energy Industry Leaders
-
Enel Green Power S.p.A.
-
Iberdrola S.A.
-
ENGIE Brasil Energia S.A.
-
Neoenergia S.A.
-
AES Andes S.A.
- *Disclaimer: Major Players sorted in no particular order
Market Opportunities and Future Outlook
The near-term opportunity centers on transmission and distribution upgrades that relieve interconnection bottlenecks and reduce curtailment for new solar and wind builds. Brazil offers a clear scale reference, with EPE reporting 24.6 GW of generation capacity additions in 2025, led by solar PV (16.3 GW) and wind (5.2 GW), while total installed capacity reached 261 GW with solar PV at 24.8% of the mix. As variable renewables expand faster than grid buildouts in key corridors, developers, utilities, and network operators are increasingly bundling generation with grid-reinforcement plans and storage-friendly connection designs to support commissioning timelines and contracted revenues.
A second opportunity is the acceleration of utility-scale solar and corporate offtake structures in markets that are restarting or scaling procurement. Colombia illustrates this momentum, with the Ministry of Mines and Energy reporting total installed solar and wind capacity at 4.63 GW as of July 17, 2026, alongside the start of commercial operations of Patria Investimentos' 360 MWp Puerta de Oro solar park in July 2026. At the same time, enabling policy updates in smaller systems, including Paraguay's modernization under Law No. 7599/2025 and Brazil's storage regulatory framework (Law No. 15.269/2025 and ANEEL's June 2026 resolutions), are creating room for distributed generation, storage, and hybrid projects that monetize both energy delivery and flexibility services.
Recent Industry Developments
- June 2026: Neoenergia Coelba (Iberdrola group) secured BRL 780 million in JICA-backed financing to strengthen electricity distribution infrastructure in Bahia, Brazil. The funding will support upgrades that improve resilience and reduce losses in a state with heavy wind and solar buildout, helping distribution networks absorb higher variable generation and electrification demand.
- December 2025: Mercomar expanded logistics services focused on oversized and critical cargo for renewable projects, including turbines, blades, and transformers, across South America. By targeting transport risk and schedule reliability, the initiative supports faster execution for utility-scale wind and solar projects where delivery windows can affect EPC costs and commissioning dates.
- November 2024: Brazil's federal Novo PAC program earmarked BRL 666.3 billion for the energy transition, with BRL 446.5 billion targeted for execution by 2026. The program supports a pipeline of grid and enabling infrastructure aimed at addressing constraints to bringing new renewable capacity online at scale.
Research Methodology Framework and Report Scope
Market Definition and Coverage
For this report, the market covers renewable electricity generation in South America, measured through installed capacity additions and the existing installed base across key countries and the rest of the region.
Scope exclusions: Off-grid captive assets that are not reported in formal capacity statistics, and non-power uses such as renewable fuels, are not counted.
Segmentation Overview
- By Technology
- Solar Energy (PV and CSP)
- Wind Energy (Onshore and Offshore)
- Hydropower (Small, Large, PSH)
- Bioenergy
- Geothermal
- Ocean Energy (Tidal and Wave)
- By End-User
- Utilities
- Commercial and Industrial
- Residential
- By Geography
- Brazil
- Chile
- Argentina
- Colombia
- Peru
- Rest of South America
Data Sources, Market Sizing, and Validation
Desk Research
Desk work starts with mapping installed capacity by technology and country using public energy statistics, then cross-checking policy notes and pipeline visibility. We typically refer to sources such as IRENA statistics, IEA electricity and renewables datasets, national energy ministry publications, system operator and regulator releases, and regional power planning documents, and we align definitions so the same technology rules are applied everywhere.
To anchor trends, we review developer announcements, utility filings, and investor presentations that indicate commissioning timelines, repowering activity, and grid connection constraints. We use import and export trade releases and customs portals selectively to sanity check equipment flow in high-growth years, and patent databases help confirm where technology focus is moving. We also draw on paid subscriptions for company financials and intelligence, and for shipment level trade checks when public data leaves gaps. The sources mentioned here are illustrative, and we review many other public documents to support data capture, validation, and clarification.
Primary Interviews and Surveys
We conduct interviews and surveys with utilities, developers, equipment providers, financiers, and regulators across South America. Expert views test commissioning dates, capacity factors, auction pipelines, curtailment, and delays, helping us resolve missing country data. Responses are compared with public records before assumptions and final estimates are approved.
Distribution of primary research fieldwork respondents
| Company type | Respondent position |
|---|---|
| Top tier: 28% | CXOs: 15% |
| Mid tier: 47% | Functional/Unit leaders: 30% |
| Smaller Players: 25% | Managers: 55% |
Market-Sizing & Forecasting
We size this market mainly through a top-down rebuild of the renewable installed base by country and technology, where national statistics and grid-connected commissioning data are assembled into a single consistent dataset. To keep the totals realistic, the outputs are then corroborated with selective bottom-up checks, such as sampling project pipelines, applying typical capacity factors, and comparing implied build rates with known procurement and auction volumes.
Inputs that matter in this market include annual commissioning by technology, announced and awarded auction capacity, grid connection and curtailment signals, hydrology variability that affects hydro build decisions, and policy items like net metering rules and renewable targets. When a country has thin public reporting, gaps are handled by using the closest official capacity series available, and then adjusting with interview feedback on what is operational versus delayed.
For forecasting, we use scenario analysis because policy, permitting, and transmission availability can shift the commissioning year without changing the long-term direction. Assumptions are stepped through for each technology and country and then aligned to regional power demand outlook and project financing conditions that were validated in interviews.
Data Validation & Update Cycle
Model outputs are checked against independent signals such as national generation mixes, published grid expansion plans, and the historical relationship between awarded capacity and realized commissioning. Large jumps are reviewed country by country, and any outliers trigger a second pass on unit conversions, technology tagging, and timing assumptions before sign-off.
Reports are refreshed annually, and interim updates are made when material events occur, such as major auctions being canceled, new incentive schemes being issued, or large projects being delayed. Before delivery, an analyst performs a fresh review so clients receive the most current view supported by the latest public data and the validation calls.
Mordor Intelligence's South America Renewable Energy Market Size Measured Against Other Published Estimates
Published market sizes for South America renewables can vary widely because authors choose different units, include different technologies, and treat hydropower and distributed solar very differently. Timing choices also matter, since some sources count capacity at award stage, while others count assets only after commissioning.
Some estimates roll the market into investment or spending values and include grid, storage, and other transition items. In Mordor Intelligence, the reported market size is tracked as installed renewable power capacity in gigawatts, and it is counted only for grid-connected generation across the covered South American countries.
Benchmark comparison
| Source | Market Size | Gaps in Research Methodology |
|---|---|---|
| Mordor Intelligence | USD 365.97 B (2025) | |
| Industry Association A | USD 410.00 B (2025) | Often aggregates broader energy transition capacity including storage and some distributed assets, and may mix nameplate capacity with pipeline or awarded projects in the same year. |
| Trade Journal B | USD 320.00 B (2025) | May exclude large hydro or treat it as a separate market, and can apply conservative commissioning assumptions that push a portion of announced capacity outside the base year. |
The spread in the table mainly comes from what is being counted and when it is counted, not from a single math error. By keeping the unit consistent and tying each country total to observable capacity series and commissioning signals, the final number stays traceable to steps that can be repeated during updates.
Key Questions Answered in the Report
How large is the South America renewable energy market in 2026?
Installed capacity stands at 400.78 GW in 2026, on track for 615.31 GW by 2031 at an 8.95% CAGR.
Which country is growing fastest in renewable capacity?
Chile is forecast to expand at roughly 17% annually through 2031 as hydrogen export projects and mining PPAs lift demand.
Why are corporate PPAs popular with miners?
Long-term fixed-price PPAs slash Scope 2 emissions and stabilize energy costs for remote smelters that face diesel price volatility.
What role will battery storage play by 2030?
Four-hour lithium-ion systems will pair with most new solar and wind plants, cutting curtailment and letting grids exceed 40% variable renewables without reliability loss.
How is foreign-exchange risk managed in Brazil?
Developers increasingly use BNDES currency-hedged loans that cap exposure at 30% of project value, though hedging adds up to 120 basis points to borrowing costs.
Which technologies will add the most capacity by 2031?
Solar leads with an 18% CAGR, followed by wind, while hydro additions remain limited due to environmental and social hurdles.