
Market Overview
| Study Period | 2021 - 2031 |
|---|---|
| Forecast Data Period | 2026 - 2031 |
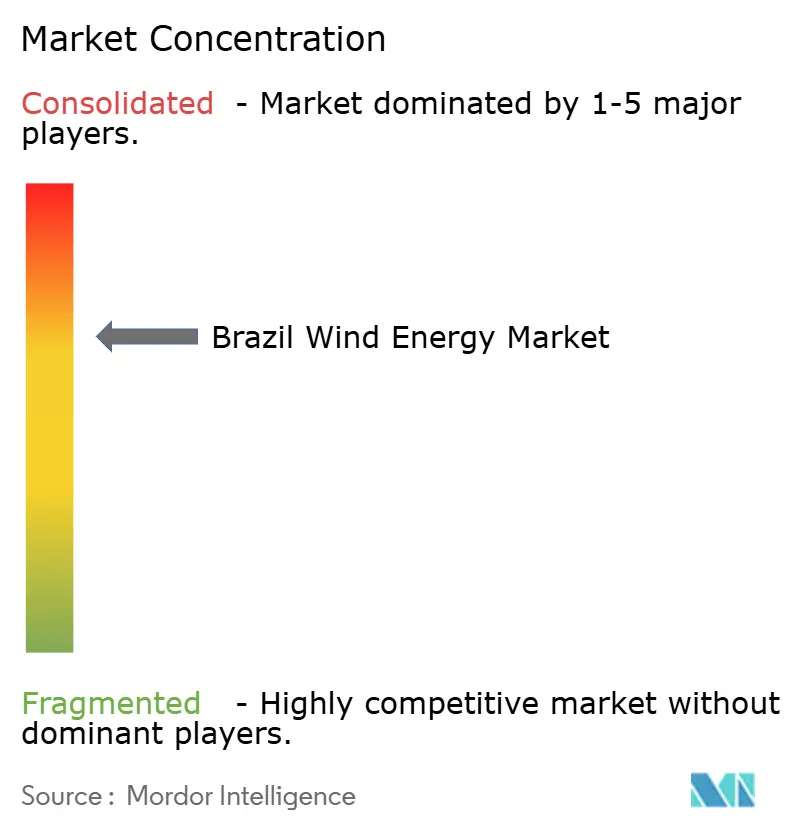
| Base Year Market Size (2025) | 35.5 gigawatt |
| Market Volume (2026) | 36.79 gigawatt |
| Market Volume (2031) | 43.93 gigawatt |
| Growth Rate (2026 - 2031) | 3.62 % |
| Market Concentration | Medium |
Major Players *Disclaimer: Major Players sorted in no particular order Image © Mordor Intelligence. Reuse requires attribution under CC BY 4.0. | |
Brazil Wind Energy Market Analysis by Mordor Intelligence
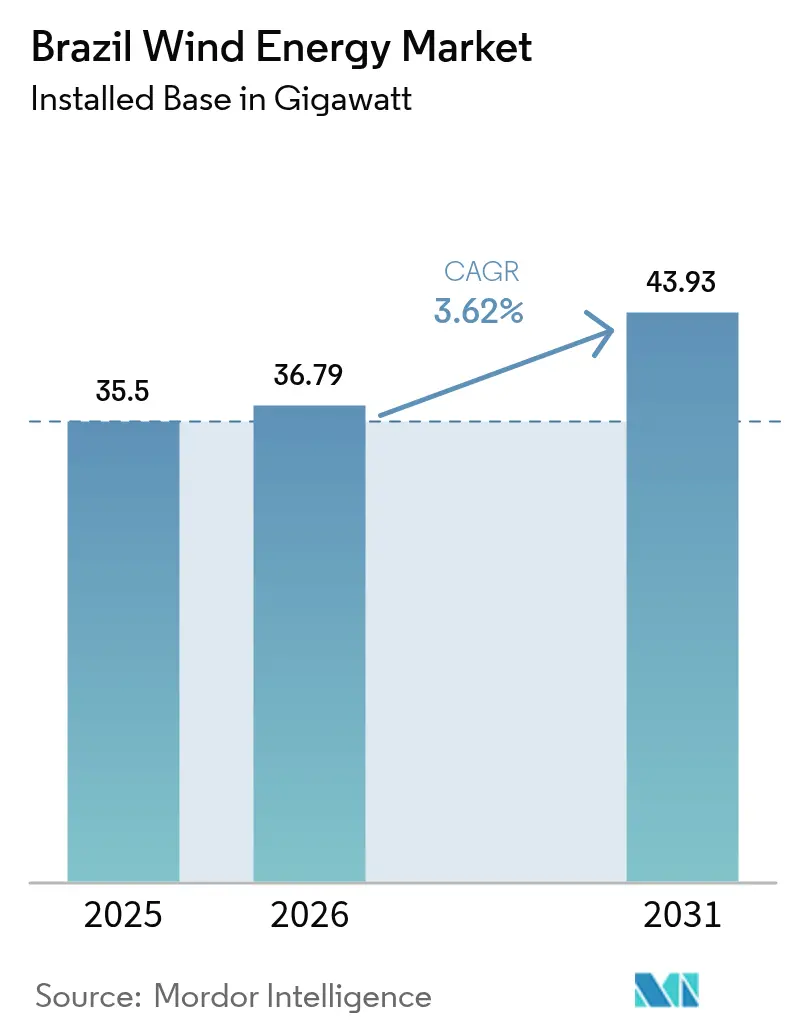
Brazil Wind Energy Market size in 2026 is estimated at 36.79 gigawatt, growing from 2025 value of 35.5 gigawatt with 2031 projections showing 43.93 gigawatt, growing at 3.62% CAGR over 2026-2031.
This shift from breakneck expansion toward steadier growth mirrors a maturing Brazilian wind energy industry, in which developers focus on grid-ready projects, rising corporate power-purchase agreements, and the repowering of legacy assets. Northeast trade-wind corridors still anchor capacity additions, but transmission build-outs, currency risks, and stricter environmental reviews now shape deployment pacing. As the Free Contracting Environment (ACL) scales, industrial buyers sign multiyear PPAs that lock in revenue certainty and encourage selective greenfield investment. Financing from BNDES and Banco do Nordeste sustains the capital flow, while larger 3-6 MW turbines deliver lower levelized costs, keeping the Brazilian wind energy market competitive against rapidly falling solar.
Key Report Takeaways
- By location of deployment, onshore installations held 100.00% of Brazil's wind energy market share in 2025 and are expected to remain the fastest-growing segment at a 3.68% CAGR through 2031.
- By turbine capacity, units up to 3 MW commanded 61.72% of the Brazil wind energy market size in 2025, while the 3-6 MW class is expanding at a 12.03% CAGR through 2031.
- By application, utility-scale projects contributed 86.85% of Brazil's wind energy market share in 2025; the commercial and industrial segment recorded the highest growth at an 17.62% CAGR to 2031.
Note: Market size and forecast figures in this report are generated using Mordor Intelligence’s proprietary estimation framework, updated with the latest available data and insights as of 2026.
Brazil Wind Energy Market Trends and Insights
Drivers Impact Analysis*
| Driver | (~) % Impact on CAGR Forecast | Geographic Relevance | Impact Timeline |
|---|---|---|---|
| Rapid Scale-Up of Brazil's Free-Market (ACL) Power Contracts Boosting Wind PPAs | +1.2% | National, concentrated in Southeast and Northeast industrial corridors | Medium term (2-4 years) |
| Northeast Grid Expansion (Chesf & ONS) Unlocking New Interconnections | +0.9% | Northeast Brazil, spillover to Southeast transmission capacity | Long term (≥ 4 years) |
| Lower LCOE From 4-6 MW Turbines Accelerating Repowering | +0.7% | National, early gains in Rio Grande do Norte, Ceará, Bahia | Short term (≤ 2 years) |
| Corporate Decarbonisation Targets of Brazilian C&I Off-Takers Driving Captive Procurement | +0.6% | Southeast and South industrial centers, expanding to Northeast | Medium term (2-4 years) |
| Favourable BNDES & BNB Financing Lines for Local-Content-Compliant Equipment | +0.4% | National, with Northeast regional development focus | Long term (≥ 4 years) |
| Strong Trade-Wind Resource in Northeastern Littoral Reducing Variability | +0.3% | Northeast coastal and inland plateau regions | Long term (≥ 4 years) |
| Source: Mordor Intelligence | |||
Rapid scale-up of ACL power contracts boosting wind PPAs
Brazil’s ACL lowered the eligibility threshold to 500 kW in 2023 and is expected to be fully operational by 2028, thereby multiplying the addressable buyer pool. Corporations now sign multi-year wind PPAs to hedge spot volatility, exemplified by ArcelorMittal’s R $4.2 billion deal, which covers 38% of its Brazilian load.[1]ArcelorMittal Brasil, “Maior contrato de energia renovável do país,” brasil.arcelormittal.com Energy desks at B3 offer risk-management products that enable generators to swap Real-denominated cash flows into USD, thereby offsetting currency swings. Developers secure premium tariffs versus regulated auctions, and the trend accelerates as renewable subsidies phase out, making the ACL the main revenue engine for the Brazil wind energy market.
Northeast grid expansion unlocking new interconnections
Chesf and ONS are rolling out 1,700 km of extra-high-voltage lines, most visibly the Asa Branca corridor, to ferry surplus Northeast wind toward load centers in the Southeast. Iberdrola’s USD 1 billion commitment signals foreign confidence that congestion can be tamed.[2]Iberdrola, “1,700-km transmission line in Brazil,” iberdrola.com Each kilometer energized frees stranded parks and trims curtailment, raising delivered megawatt-hours without tapping new sites. In the longer term, reinforced corridors will enable hybrid wind-plus-solar farms to co-share capacity, further stabilizing grid frequency.
Lower LCOE from 4-6 MW turbines accelerating repowering
Modern 3-6 MW platforms enhance nameplate capacity while reusing roads and foundations, driving levelized costs below USD 34/MWh and increasing average project factors to around 50%.[3]World Wind Energy Association, “Repowering Potential,” worldwindenergy.org Brazil’s earliest PROINFA projects now hit the 15-year mark, making repowering viable. OEMs report Brazilian order books dominated by 4-5 MW units tailored to 140 m hub heights, a sweet spot for the trade-wind regime. Repowering reduces permitting timelines and drives incremental gigawatt growth within the existing Brazilian wind energy market footprint.
Corporate decarbonisation targets of Brazilian C&I off-takers
Science-based emissions commitments drive mining, metals, and health-care groups to secure renewable supply. Anglo American’s 195 MW PPA at Rio do Vento trims 430 kt of CO₂ annually, proving wind delivers headline ESG wins. I-REC certificates add export-market credibility, and wind’s dusk-to-dawn profile aligns more tightly with industrial demand than solar. As ACL access widens, mid-tier manufacturers join first movers, broadening demand across the Brazil wind energy industry.
Restraints Impact Analysis*
| Restraint | (~) % Impact on CAGR Forecast | Geographic Relevance | Impact Timeline |
|---|---|---|---|
| Transmission Congestion Risk in Rio Grande do Norte & Bahia | -0.8% | Rio Grande do Norte, Bahia, transmission corridors to Southeast | Short term (≤ 2 years) |
| Slow Environmental Licensing for Offshore Foundations & Cables | -0.6% | Coastal regions, federal waters under IBAMA jurisdiction | Medium term (2-4 years) |
| Competition From Rapidly Falling Utility-Scale Solar CAPEX in Sertão | -0.4% | Interior Northeast, Sertão region, areas with high solar irradiation | Medium term (2-4 years) |
| Real Depreciation Raising Cost of Imported Nacelle Components | -0.3% | National, affecting all projects with imported equipment | Short term (≤ 2 years) |
| Source: Mordor Intelligence | |||
Transmission congestion risk in Rio Grande do Norte & Bahia
A 2023 grid split cut 18,900 MW of load, exposing the Northeast–Southeast bottleneck.[4]Agência Nacional de Energia Elétrica, “Relatório de Ocorrências do SIN 2023,” aneel.gov.br Curtailment peaks force generators to spill wind even as thermal plants fire up elsewhere, eroding project IRRs. Until new 500 kV circuits are energized, some developers locate projects in suboptimal wind tracts solely to access evacuation, thereby trimming the overall growth of the Brazilian wind energy market.
Slow environmental licensing for offshore foundations & cables
IBAMA is vetting 189 GW of marine proposals, yet multi-agency reviews prolong timelines and create capital-holding costs.[5]Instituto Brasileiro do Meio Ambiente, “Licenciamento Eólico Offshore,” ibama.gov.br The absence of clear seabed-lease rules pushes the first auctions into 2026+, delaying diversification beyond onshore. Smaller players struggle with the high costs of baseline studies, which hinder competition in the future offshore tier of the Brazilian wind energy industry.
*Our forecasts treat driver/restraint impacts as directional, not additive. The impact forecasts reflect baseline growth, mix effects, and variable interactions.
Segment Analysis
By Location of Deployment: Onshore optimization dominates growth
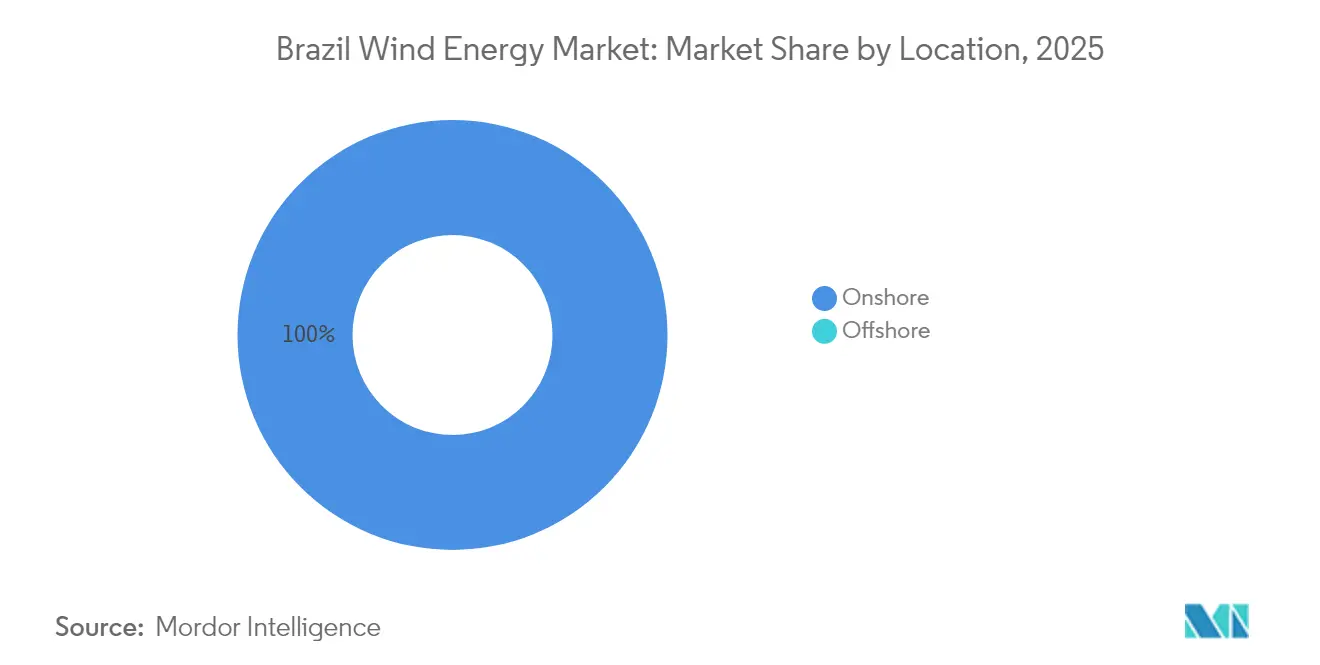
Onshore assets delivered the full 35.5 GW operating base in 2025 and continue to expand at a moderate 3.68% CAGR as developers squeeze more energy from existing corridors. Repowering PROINFA-era sites with 4-5 MW machines increases output without requiring new land, supporting incremental additions to the Brazilian wind energy market size. Consistent trade-wind regimes and mature supply chains keep LCOE competitive, while ACL contracts help offset mild curtailment risk in grid-constrained nodes.
Offshore remains aspirational. Although 189 GW sit in IBAMA’s queue, permitting complexity and undefined auction terms defer large-scale commitments. Demonstration projects, such as the 720 MW Asa Branca array, could pioneer revenue models; however, full commercialization is unlikely before 2028. In the meantime, onshore projects dominate corporate procurement, underscoring the near-term centrality of land-based build-outs to the Brazilian wind energy market.



By Turbine Capacity: Mid-range platforms lead technology shift
Units under 3 MW still make up 61.72% of installed turbines, a legacy of early auctions. Developers now favor 3-6 MW machines, the fastest-growing class, which is experiencing a 12.03% CAGR, because larger rotors harvest more of the Northeastern boundary layer. Swapping a 1.5 MW nacelle for a 4.2 MW model can double annual energy yield, lifting site-level capacity factors to the Brazil wind energy market share thresholds needed to clear ACL pricing. Units above 6 MW remain niche, awaiting offshore demand and localized blade logistics.
OEM strategies reflect this pivot. Vestas captured 347 MW of multi-megawatt orders in 2024, while Nordex’s 112 MW Auren Energia contract spotlighted demand for 5 MW platforms. Goldwind’s USD 28.6 million Bahia factory adds supply-chain depth and meets BNDES content tests. As repowering accelerates, the fleet-wide average rating is expected to surpass 3 MW by 2030, enhancing overall productivity within the Brazilian wind energy industry.
By Application: C&I appetite widens the buyer mix
Utility-scale auctions still underwrite 86.85% of installed capacity, but commercial and industrial (C&I) demand grows at an annual rate of 17.62% as ACL liberalization lowers participation barriers. Steel, pulp, and data-center operators sign ten- to fifteen-year deals that hedge spot-price swings and satisfy Scope 2 mandates, expanding the Brazil wind energy market size beyond state-utility balancing requirements. Community projects remain embryonic; yet as distributed-generation rules mature, co-operatives could unlock local ownership models in the Northeast hinterland.
The C&I shift alters commercial terms. Developers structure indexed tariffs, synthetic hedges, and I-REC bundles to win industrial loads, while retailers acquire portfolios to arbitrage diurnal spreads. Casa dos Ventos’ purchase of América Varejista exemplifies vertical integration, capturing supply, trading, and retail margins inside the Brazil wind energy market.

Geography Analysis
Northeast Brazil hosts roughly 80% of the national capacity, led by Rio Grande do Norte, which produces enough wind to export power southward on most days. Persistent 8 m/s winds generate 45-50% capacity factors that underpin the Brazil wind energy market’s global competitiveness. Ceará positions itself as an offshore staging ground thanks to ports at Pecém, while academic clusters refine floating-platform design to exploit deeper waters. Bahia trails closely, combining coastal gales with inland plateau resources and boasting the 566.5 MW Oitis complex, Latin America’s largest onshore wind farm.
Piauí and Maranhão deliver diversified resource pockets, reducing locational risk. Invenergy’s 600 MW portfolio acquisition, spanning Piauí and Rio Grande do Norte, demonstrates investor appetite for multi-state synergies in the Brazilian wind energy market. Complementarity with hydro in the Southeast stabilizes the national grid, as wind peaks during reservoir drawdowns. Transmission upgrades under the ONS 2026 plan aim to add 4 GW of Northeast export capacity, mitigating curtailment and widening market access.
Southeast and South states, while wind-poorer, drive demand through corporate PPAs that backhaul power via 500 kV corridors. São Paulo hosts trading desks that slice renewable blocks into hourly products, deepening liquidity. As battery costs fall, developers may pair Northeastern wind with Southeastern storage to arbitrage peak prices, thereby stretching the geographic footprint of the Brazilian wind energy industry.
Regulatory Landscape
Brazil’s wind market operates under ANEEL oversight for generation authorizations and grid-connection rules within the National Interconnected System (SIN). Project tracking and commissioning visibility are supported by ANEEL’s RALIE and its open-data releases on commercial operation for new plants. On the demand side, the ongoing expansion of the Free Contracting Environment (ACL), including the 500 kW eligibility threshold change implemented in 2023, has strengthened the role of bilateral PPAs as a primary contracting route for wind developers, particularly for commercial and industrial offtakers.
Offshore regulation moved from concept to formal execution steps after the sanctioning of Lei no. 15.097/2025 (January 10, 2025), which established the legal framework for offshore wind use rights and project development. In April 2026, CNPE approved guideline directions to regulate Lei no. 15.097/2025, and the government centralized offshore area management through the Portal Unico de Gestao de Areas Offshore (PUG Offshore), including procedures related to the Declaracao de Interferencia Previa (DIP). Defined near-term deadlines cover drafting the decree and the DIP workflow by May 2026.
Competitive Landscape
The top five OEMs, Vestas, Siemens Gamesa, GE Vernova, Nordex, and Goldwind, deliver approximately 70% of the turbines, creating a balanced bargaining environment for the Brazilian wind energy market. Competition shifts to grid-access rights, ACL retail platforms, and repowering expertise. Casa dos Ventos has pivoted from pure development to full-stack energy retail, while Petrobras’ 2025 offshore survey tender signals state-backed entry into marine renewables.
Local-content policy guides strategy. Goldwind’s Bahia factory meets BNDES thresholds, and Siemens Gamesa’s Ceará blade plant expands rotor capacity for 5-MW-plus orders. Transmission ownership offers another moat; ENGIE deploys capital in the Asa Branca line, integrating project and wire revenue streams. Financial innovation abounds: Banco do Nordeste packages Real swaps with concessionary loans, and private-equity funds flip de-risked assets to pension investors, recycling capital into new builds. As the Brazil wind energy market matures, operational excellence, supply-chain resilience, and regulatory fluency trump sheer megawatt count.
Brazil Wind Energy Industry Leaders
Neoenergia SA
Vestas Wind Systems AS
Siemens Gamesa Renewable Energy SA
Nordex SE
ABB Ltd
- *Disclaimer: Major Players sorted in no particular order

Market Opportunities and Future Outlook
Grid-ready onshore build-outs and repowering remain the most actionable whitespace, given that Brazil’s installed base is entirely onshore (35.5 GW in 2025) while offshore development continues through environmental review, including a large queue under IBAMA. The move toward larger turbines and repowering at mature sites supports faster execution and lower permitting friction compared with new greenfield locations. Transmission availability also continues to shape deployment pacing in Rio Grande do Norte and Bahia.
Corporate procurement is still widening the buyer pool as ACL access expands, with recent corporate-scale contracting and retail-platform integration creating room for developers that can package PPAs, certificates such as I-RECs, and risk-management structures. Two near-term opportunity areas stand out from current market actions and programs. First, large corporate-led investment signals point to continued appetite for utility-scale wind in the Northeast, with Casa dos Ventos publicly committed around BRL 12 billion to two wind projects in Piaui and Ceara (reported May 2026). Second, system integration services and enabling infrastructure are emerging as differentiated value pools, spanning transmission build-outs, curtailment-management practices, and workforce readiness, supported by planning and statistical publications from EPE and industry initiatives from ABEEolica that emphasize operational priorities as renewable penetration rises.
Recent Industry Developments
- March 2026: Vestas announced that Equinor (via Rio Energy) acquired the fully developed 230 MW Esquina do Vento wind project from Vestas, alongside a turbine supply agreement for 51 V163-4.5 MW units. The transaction illustrates a sell-down model to recycle development capital while locking in turbine and long-term services, which can accelerate execution for large Brazilian onshore projects.
- December 2025: Casa dos Ventos and Vestas reported an 828 MW turbine contract for the Dom Inocencio Wind Complex in Piaui, including 184 V150-4.5 MW turbines. Construction is slated to start in 2026, with commissioning targeted for 2028, and the deal reinforces the market shift toward multi-hundred-megawatt complexes and multi-year OEM pipelines.
- March 2025: Nordex received a 112 MW order from Auren Energia to supply and install 19 N163/5.X turbines for the Cajuina 3 wind farm in Rio Grande do Norte. The order points to ongoing demand for 5 MW-class platforms that improve energy yield in Brazil’s Northeast wind corridors and supports repowering and technology upscaling trends.


Research Methodology Framework and Report Scope
Market Definition and Coverage
For this study, the Brazil wind energy market is defined as the total installed wind power capacity operating in Brazil, measured in gigawatts, and it includes both onshore and offshore additions tracked through commissioning activity.
Scope exclusions: We exclude wind turbine component manufacturing revenue, EPC service revenue, O&M service revenue, and power trading values that do not directly change installed wind capacity.
Segmentation Overview
- By Location
- Onshore
- Offshore
- By Turbine Capacity
- Up to 3 MW
- 3 to 6 MW
- Above 6 MW
- By Application
- Utility-scale
- Commercial and Industrial
- Community Projects
- By Component (Qualitative Analysis)
- Nacelle/Turbine
- Blade
- Tower
- Generator and Gearbox
- Balance-of-System
Data Sources, Market Sizing, and Validation
Desk Research
Desk work started by mapping Brazil's wind capacity timeline and project pipeline using public energy statistics and system operator disclosures, and then aligning definitions so the numbers stay comparable across years. Sources used for grounding include official energy planning and power-sector publications, such as from the national energy regulator, the energy research office, the national grid/system operator, and Brazil's official statistics institute, along with customs trade releases when equipment imports help explain build cycles.
Next, we reviewed company filings, investor decks, press releases, and association publications to understand commissioning schedules, typical turbine ratings used in new parks, and which states are seeing new transmission availability. A limited set of paid subscriptions for company financials and intelligence, project and tender tracking, and patent search was used selectively to clarify ownership changes, project status, and technology direction. These desk research sources are illustrative, and many other public documents were also referred to for data collection, validation, and clarification.
Primary Interviews and Surveys
Primary work was used to pressure-test the capacity build plan and understand what is realistically getting commissioned, delayed, or re-scoped, especially around grid connection timing and financing. We spoke with a mix of developers, utilities and large buyers, contractors, and industry advisors across Brazil, and the inputs were used to confirm utilization assumptions and to correct desk-based pipeline signals when they conflicted with what is happening on the ground.
Distribution of primary research fieldwork respondents
| Company type | Respondent position |
|---|---|
| Top tier: 26% | CXOs: 14% |
| Mid tier: 60% | Functional/Unit leaders: 30% |
| Smaller Players: 14% | Managers: 56% |
Market-Sizing & Forecasting
Sizing was built using a top-down approach where national installed capacity totals are reconstructed from official capacity registers and commissioning records, and then the annual additions are allocated across wind based on verified project start dates and grid connection milestones. To keep the model honest, selective bottom-up checks were run using sampled project roll-ups by state, typical turbine nameplate ratings, and developer level commissioning announcements, which are then used to adjust totals when gaps showed up.
A few inputs mattered more than others in Brazil, so we tracked them explicitly, such as annual wind park commissioning volumes in GW, average turbine capacity trend (MW per turbine), availability of transmission connections in the Northeast corridors, auction and corporate PPA activity that drives new builds, and permitting pace for offshore proposals versus onshore expansions. When project level detail was missing or inconsistent, we used conservative timing rules anchored to grid connection readiness and typical construction cycles, and then validated those rules in interviews.
For forecasting, scenario analysis was applied with a base case that reflects the most common commissioning timelines shared by industry participants, and it was cross-checked against recent build history and the confirmed pipeline. This keeps the forecast explainable in a client discussion because each step ties back to capacity additions and the practical constraints that decide whether a wind farm reaches commercial operation in a given year.
Data Validation & Update Cycle
Model outputs were checked against independent signals, such as year-on-year capacity change reported by official sources, project commissioning announcements, and observed swings in turbine sizing that can shift GW additions even when project counts stay similar. If a variance looked too large, the drivers were traced back to the underlying assumptions, and follow-ups were triggered with experts to confirm whether the issue was timing, re-rating, curtailment related reporting, or a pipeline status change.
Before sign-off, the dataset and calculations go through multi-step analyst reviews so that unit consistency, year mapping, and inclusion rules are applied the same way across the time series. The report is refreshed annually, and interim updates are made when material events occur, such as major auction changes, new grid build approvals, or a large wave of projects slipping schedules. Right before delivery, a final pass is completed so clients receive the most current view available at that time.
Mordor Intelligence's Brazil Wind Energy Market Estimate Compared With Other Published Estimates
Published market sizes for Brazil wind energy can look far apart because some sources report money values, while others track physical capacity, and the timelines and what gets counted can also shift. The table makes that split visible, and it helps explain why two USD figures can sit next to a GW based view without being directly comparable.
The benchmark table shows a capacity based estimate, and in Mordor Intelligence's model the market is counted as installed wind capacity in GW (including onshore and offshore as coverage categories) rather than supplier revenue from turbines, construction, or O&M services. When other publishers convert activity into USD, their results can move a lot depending on whether they assume new-build capex only or include services, how they treat imported equipment pricing, and which currency conversion timing they apply for a volatile period.
Benchmark comparison
| Source | Market Size | Gaps in Research Methodology |
|---|---|---|
| Mordor Intelligence | USD 35.50 B (2025) | |
| Regional Consultancy A | USD 5.20 B (2024) | Uses a value based view in USD, which is sensitive to capex and service scope choices, and it can also mix distributed and utility definitions differently than an installed capacity roll-forward. |
| Trade Publisher B | USD 4.67 B (2022) | Anchors the estimate to an earlier base year and a revenue lens, so results depend on pricing and supply chain inclusion, and they may not reconcile cleanly with official capacity totals by commissioning year. |
Across the three figures, the main takeaway is that unit choice and scope boundaries drive most of the spread, followed by base year timing and pricing assumptions used in USD conversions. By keeping the steps tied to commissioning and installed GW, and then cross-checking with project level signals and expert feedback, the estimate stays traceable to clear variables that can be re-tested when new projects or grid connections change the outlook.


Key Questions Answered in the Report
How large is the Brazil wind energy market today?
Operating capacity reached 36.79 GW in 2026 and is projected to rise to 43.93 GW by 2031.
Why is growth slower than in the past decade?
Prime onshore sites are largely occupied and transmission bottlenecks temper new builds, shifting focus toward repowering and ACL-driven quality projects.
What drives corporate demand for Brazilian wind power?
ACL liberalization lets industrial buyers lock in long-term fixed prices while meeting science-based emissions targets through I-REC-certified PPAs.
When will Brazil launch large-scale offshore wind?
The first commercial auction is expected post-2026 once IBAMA finalizes seabed-lease regulations and environmental protocols.
Which turbine class is gaining momentum?
3-6 MW platforms are the fastest-growing segment, expanding at 12.03% CAGR as repowering projects swap out older 1-3 MW units.
How does wind complement Brazil’s hydro fleet?
Wind peaks during dry seasons, offsetting reduced reservoir inflows and enhancing overall grid reliability.
Page last updated on:




