Market Overview
| Study Period | 2021 - 2031 |
|---|---|
| Forecast Data Period | 2026 - 2031 |
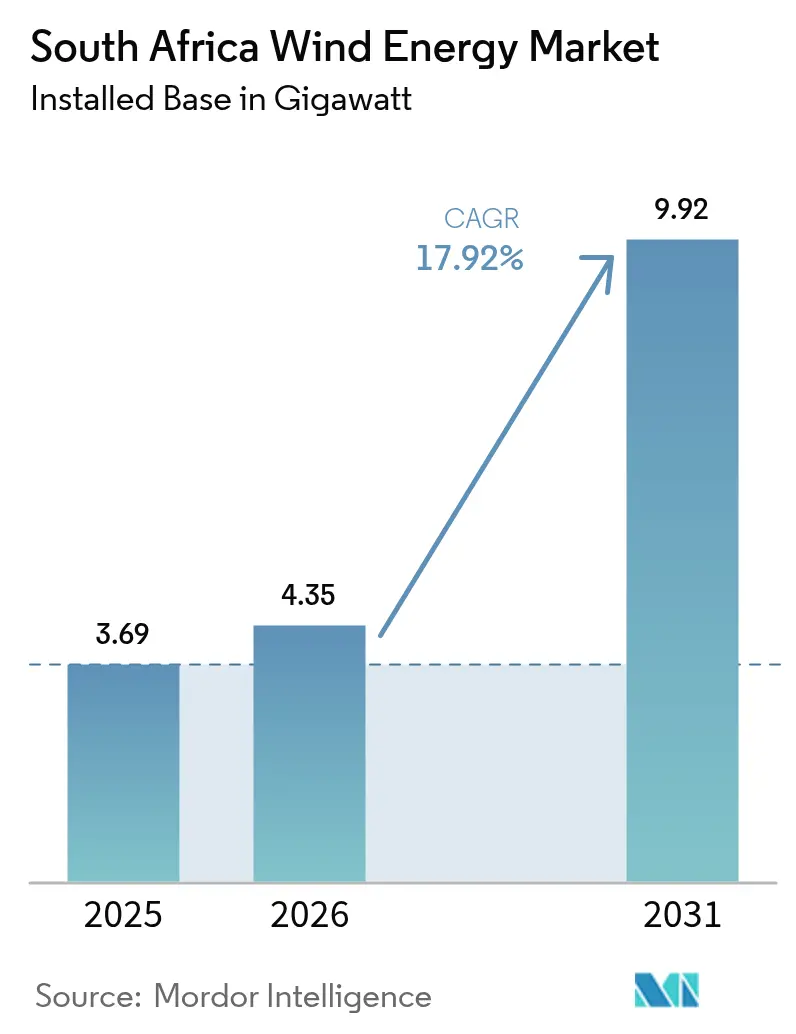
| Base Year Market Size (2025) | 3.69 gigawatt |
| Market Volume (2026) | 4.35 gigawatt |
| Market Volume (2031) | 9.92 gigawatt |
| Growth Rate (2026 - 2031) | 17.92% CAGR |
| Market Concentration | Medium |
Major Players *Disclaimer: Major Players sorted in no particular order Image © Mordor Intelligence. Reuse requires attribution under CC BY 4.0. | |
South Africa Wind Energy Market Analysis by Mordor Intelligence
The South Africa Wind Energy Market size was valued at 3.69 gigawatt in 2025 and estimated to grow from 4.35 gigawatt in 2026 to reach 9.92 gigawatt by 2031, at a CAGR of 17.92% during the forecast period (2026-2031).
Policy reforms that eliminated the 100 MW cap on distributed generation, the legalization of competitive wholesale trading, and the surge in corporate PPAs have redirected investment away from Eskom-only procurement toward private offtake. Transmission constraints in the Northern and Western Cape still temper the deployment speed, yet local-content incentives and a maturing wheeling framework are strengthening domestic manufacturing and financing ecosystems. Competitive intensity is rising as Chinese OEMs leverage turbine-plus-financing packages while European suppliers defend premium pricing through service networks. Overall, the South Africa wind energy market is advancing from a policy-led to an infrastructure-constrained growth phase, where grid reinforcement and streamlined permitting are the decisive variables.
Key Report Takeaways
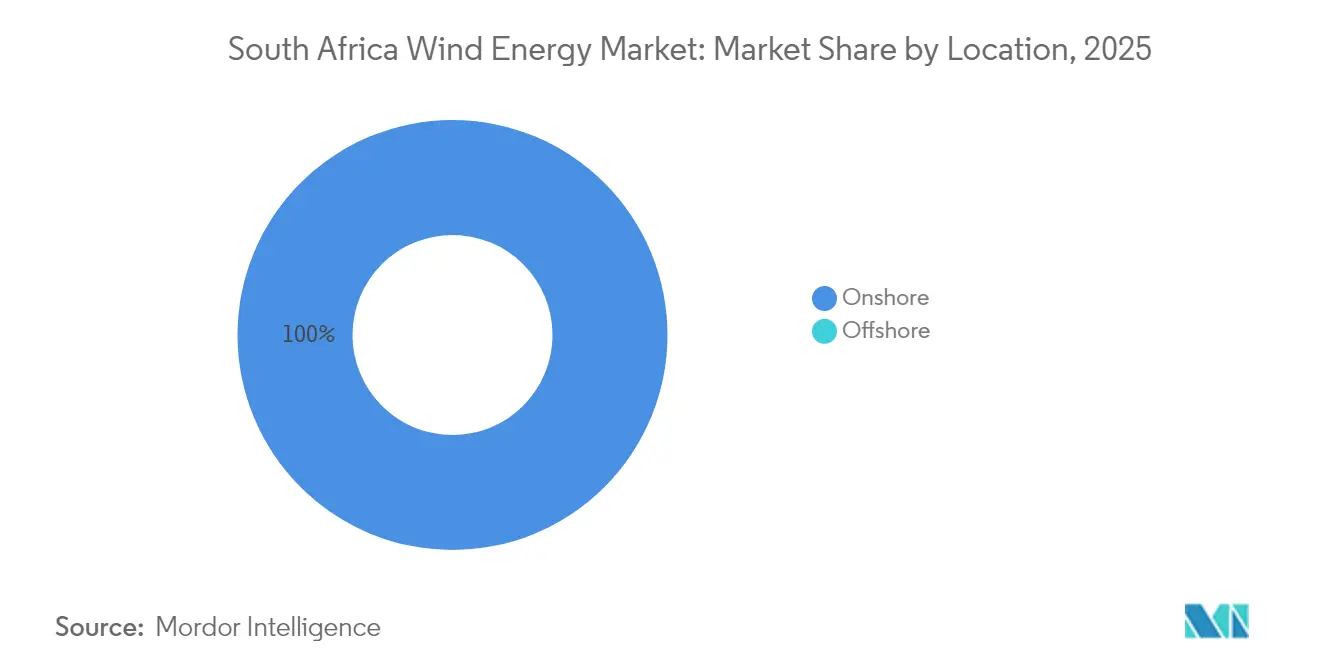
- By location, onshore installations accounted for 100.00% of the South Africa wind energy market share in 2025, while offshore remains at the feasibility stage, leaving onshore to expand at an 17.86% CAGR through 2031.
- By turbine capacity, platforms rated 3-6 MW commanded 55.80% of the South Africa wind energy market size in 2025; the Above 6 MW class is forecast to lead growth at a 20.12% CAGR to 2031.
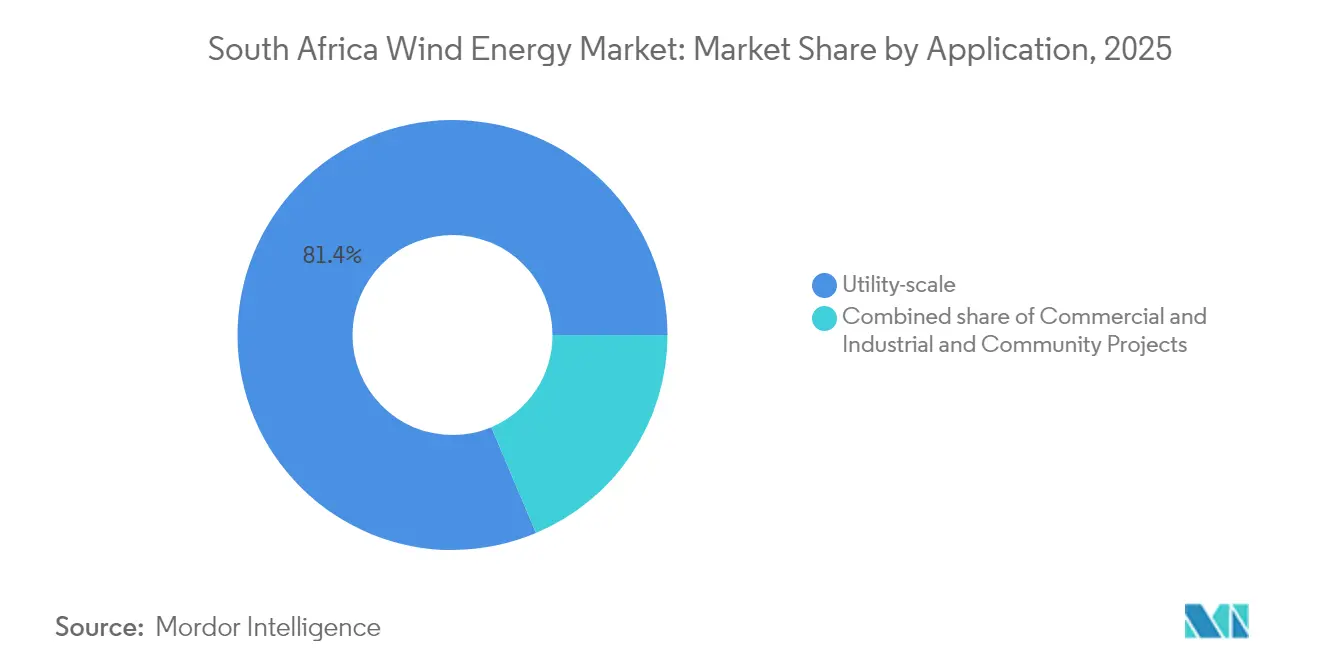
- By application, utility-scale projects held 81.35% share of the South Africa wind energy market size in 2025 and are projected to grow at a 19.08% CAGR through 2031.
Note: Market size and forecast figures in this report are generated using Mordor Intelligence’s proprietary estimation framework, updated with the latest available data and insights as of 2026.
South Africa Wind Energy Market Trends and Insights
Drivers Impact Analysis*
| Driver | (~) % Impact on CAGR Forecast | Geographic Relevance | Impact Timeline |
|---|---|---|---|
| IRP-2019 wind quota of 1.6 GW/yr ensures steady pipeline | +3.2% | Northern Cape, Eastern Cape, Western Cape | Medium term (2-4 years) |
| Rapid LCOE decline keeps wind cheaper than new coal & CCGT | +2.8% | National, strongest in Mpumalanga and KwaZulu-Natal | Short term (≤ 2 years) |
| REIPPPP auctions unlocking > 7 GW private investment | +4.1% | National, project clusters in Cape provinces | Medium term (2-4 years) |
| Surge in corporate-PPA wheeling deals post-2024 grid code | +3.5% | Mining belts in Limpopo & North West, industrial zones nationwide | Short term (≤ 2 years) |
| Transmission-company spin-off unlocks grid-expansion finance | +2.3% | Cape transmission corridors | Long term (≥ 4 years) |
| Local-content incentives under 2025 Renewable-Energy Masterplan | +1.9% | Manufacturing hubs in Eastern Cape | Long term (≥ 4 years) |
| Source: Mordor Intelligence | |||
IRP-2019 Wind Quota of 1.6 GW/yr Ensures Steady Pipeline
A fixed 1.6 GW annual procurement target gives developers visibility to lock in turbine supply, negotiate debt at tighter spreads, and shorten construction cycles, contrasting with earlier stop-start bid windows.[1]Global Wind Energy Council, “Global Wind Report 2025,” GWEC.NET The quota’s Cape-province focus aligns grid reinforcement priorities with the highest capacity-factor zones, encouraging efficient capital deployment. Draft IRP-2024 scenarios raise cumulative wind ambition to as high as 76 GW by 2050, yet near-term momentum still hinges on timely auction calendars. Predictability is already compressing project development timelines by up to nine months as financiers view repeatable bid rounds as lower-risk. This certainty is also stimulating domestic tower fabrication commitments in Humansdorp.
Rapid LCOE Decline Keeps Wind Cheaper Than New Coal & CCGT
Onshore wind’s LCOE has fallen to USD 40-50 / MWh, far below new coal and gas alternatives when carbon costs are included.[2]International Renewable Energy Agency, “Floating Offshore Wind Outlook,” IRENA.ORG Turbine scaling to 5-6 MW machines with 180 m rotors lifts capacity factors in South Africa’s coastal regimes to 35-45%. Mining majors such as Rio Tinto now secure 20-year PPAs priced beneath Eskom’s escalating tariffs, using wind as a hedge against price inflation and emissions compliance. The cost gap is widening as coal plants confront retrofit expenses, while wind projects see negligible variable costs post-commissioning. Declining costs also underpin the economics of hybrid wind-battery plants that can arbitrage curtailment periods.
REIPPPP Auctions Unlocking > 7 GW Private Investment
Since 2011, the REIPPPP scheme has contracted more than 7 GW of wind, with 3.34 GW already online and Bid Window 5 projects moving toward financial close. The Electricity Regulation Amendment Act restores confidence by mandating transparent timelines following earlier delays that forced tariff renegotiations. Local lenders such as Standard Bank and DBSA financed the 380 MW Overberg facility at competitive rates, proving domestic appetite when grid and offtake risks are mitigated.[3]Development Bank of Southern Africa, “DBSA Finances South Africa’s Largest Wind Farm,” DBSA.ORG Revived auctions are expected to re-activate idle manufacturing capacity and attract foreign equity partners.
Surge in Corporate-PPA Wheeling Deals Post-2024 Grid Code
Operationalization of the National Wheeling Framework in January 2025 triggered at least 1.94 GW of announced private-offtake wind deals, notably Cennergi’s 140 MW agreement with Northam Platinum that transports power across Eskom’s network at wheeling tariffs near ZAR 0.12/kWh. Aggregators such as NOA Group reduce transaction costs by bundling generation and distributing it to multiple buyers. Early adopters report 15-20% savings versus grid supply, prompting copy-cat deals among ferrochrome and cement producers. Improved revenue certainty is expanding the South Africa wind energy market by broadening the buyer universe beyond Eskom.
Restraints Impact Analysis*
| Restraint | (~) % Impact on CAGR Forecast | Geographic Relevance | Impact Timeline |
|---|---|---|---|
| Cape-province grid congestion & queue backlogs | -2.7% | Northern Cape, Eastern Cape, Western Cape | Short term (≤ 2 years) |
| Lengthy EIA & land-use permitting timelines | -1.5% | National, with delays concentrated in coastal zones and protected areas | Medium term (2-4 years) |
| Policy uncertainty around IRP-2023 draft revisions | -1.8% | National, affecting procurement pipeline and investor confidence | Medium term (2-4 years) |
| Rising mid-day curtailment risk from rooftop-solar oversupply | -1.2% | Cape provinces and Gauteng, where rooftop solar penetration exceeds 15% | Short term (≤ 2 years) |
| Source: Mordor Intelligence | |||
Cape-Province Grid Congestion & Queue Backlogs
Curtailment climbed to 307 GWh in 2024 and already exceeds 403 GWh in 2025 as saturated corridors force grid operators to prioritize conventional generation. Connection queues lack transparency, leaving new developers facing three-year waits even after permits. Projects with legacy allocations enjoy priority, producing a two-tier market that dampens competition. Frequency excursions tied to rising inverter-based penetration have led NTCSA to tighten grid-code rules, raising project costs. Although the Independent Transmission Projects model promises relief, tariff-recovery mechanisms remain untested.
Lengthy EIA & Land-Use Permitting Timelines
EIAs average 18-24 months and can stretch beyond 30 months for sites intersecting bird corridors or heritage zones. Multi-agency reviews invite appeals that delay financial close and favor experienced developers with deeper capital reserves. Communal land tenure in the Eastern Cape further complicates acquisition, requiring protracted negotiations with traditional authorities. Aviation-lighting requirements introduced in 2024 added blade-patterning costs and technical reviews, extending procurement schedules. Industry proposals for standardized low-risk site protocols remain unimplemented, perpetuating bottlenecks that hold back the South Africa wind energy market.
*Our forecasts treat driver/restraint impacts as directional, not additive. The impact forecasts reflect baseline growth, mix effects, and variable interactions.
Segment Analysis
By Location: Onshore Dominance, Offshore Nascent
Onshore capacity totaled 3.69 GW in 2025, capturing the entire South Africa wind energy market share, and is projected to expand at an 17.86% CAGR as developers exploit 35-45% capacity factors along the Cape coastline. Proven resource data, existing transmission nodes, and standardized permitting templates shorten project cycles, making onshore the low-risk growth avenue. Balance-of-plant savings from larger turbines further enhance onshore economics, consolidating its primacy within the South Africa wind energy market.
A fledgling offshore segment is emerging through feasibility studies on floating platforms off KwaZulu-Natal, yet it contributes 0.00% to the South Africa wind energy market size today. Deep waters, absence of leasing regulations, and port-infrastructure gaps keep commercial deployment unlikely before 2035. Nonetheless, the Agulhas Current offers high and consistent wind speeds that could one day diversify geographic risk away from constrained onshore corridors.


By Turbine Capacity: Scaling Toward 6+ MW Platforms
Machines rated 3-6 MW dominated installations with a 55.80% South Africa wind energy market share in 2025, leveraging proven platforms such as Vestas V150-4.2 MW. The Above 6 MW segment, however, is accelerating at a 20.12% CAGR, reflecting developers’ pursuit of economies of scale and grid operators’ preference for fewer interconnection points. Goldwind’s 6.2 MW units at the 380 MW Overberg cluster exemplify this trend, yielding 15-20% more annual energy per turbine.
Transitioning to larger rotors reshapes logistics and supply-chain demands, requiring blade-handling infrastructure and specialized transport. The South Africa wind energy market size for turbines above 6 MW is benefiting from localized tower fabrication that offsets transport complexity. Grid-code updates mandating advanced power electronics also favor the newest high-capacity machines, reinforcing the migration to 6-8 MW platforms.
By Application: Utility-Scale Leads, C&I Gains Traction
Utility-scale projects held 81.35% of installed capacity in 2025 and are projected to expand at a 19.08% CAGR, underpinning the bulk of the South Africa wind energy market size. Large PPAs such as Richards Bay Minerals’ 230 MW offtake from Overberg illustrate how single-buyer demand can underwrite multi-hundred-megawatt plants. Standardized contracts and lender familiarity minimize transaction costs and attract foreign equity.
Commercial and industrial buyers are accelerating adoption through wheeling, shrinking Eskom exposure, and meeting decarbonization mandates. The Cennergi–Northam Platinum deal highlights cost savings and risk hedging achievable for mid-tier users. Community projects remain marginal due to financing hurdles, yet transformation targets in the Renewable-Energy Masterplan could unlock concessional funding that broadens participation, adding resilience to the South Africa wind energy market.
Geography Analysis
South Africa’s wind fleet is concentrated in the Northern, Eastern, and Western Cape provinces, jointly hosting more than 90% of capacity due to 8 m/s wind speeds and existing 400 kV lines. The Northern Cape leads the pipeline with projects like Scatec’s Kenhardt hybrid, yet its Aries and Hydra nodes are curtailment hotspots, spilling over 150 GWh in 2024. NTCSA’s 765 kV backbone proposal aims to reroute surplus to Gauteng by 2029, potentially unlocking 5-7 GW of new capacity.
The Eastern Cape benefits from Coega port logistics and a skilled manufacturing base pivoting from automotive to renewable components. Nordex’s Humansdorp facility signals the rise of a localized tower supply chain. However, biodiversity safeguards within the Cape Floral Kingdom lengthen EIA reviews, elevating development risk. The Western Cape’s proximity to Cape Town’s load centers reduces wheeling fees, making projects such as Overberg attractive to corporate buyers despite stricter environmental protocols.
Mpumalanga, historically coal-dependent, is emerging through Seriti Green’s 900 MW wind plan, aligning with the Just Energy Transition and repurposing mine land. KwaZulu-Natal’s deepwater offshore prospect remains speculative, pending leasing rules. Limpopo and North West host wheeling-based projects feeding platinum and ferrochrome plants, demonstrating that grid-rich but wind-moderate regions can still contribute incremental growth through private PPA structures.
Competitive Landscape
Vestas, Siemens Gamesa, and Nordex collectively hold roughly 60% of cumulative installations, underpinning a moderately concentrated market. Chinese OEMs, led by Goldwind, are rapidly gaining share by bundling equipment, EPC, and concessional finance. Goldwind’s Johannesburg service center addresses historic concerns over after-sales support, narrowing European suppliers’ advantage. Price competition is now supplemented by digital-service differentiation, with Vestas GridStreamer and Siemens Gamesa PowerBoost specified in NERSA filings to satisfy stricter grid-code demands.
Developer consolidation is intensifying as smaller IPPs exit due to grid-access hurdles, creating acquisition opportunities for Mainstream Renewable Power and Enel Green Power. Energy traders such as NOA Group introduce flexibility by decoupling generation from single-buyer PPAs, fostering a secondary market for offtake contracts. Hybrid wind-battery projects, like Oya Energy’s 86 MW wind component paired with 92 MW/242 MWh storage, illustrate new competitive niches where value comes from dispatchable renewable power.
South Africa Wind Energy Industry Leaders
Nordex SE
Vestas Wind Systems A/S
Siemens Gamesa Renewable Energy SA
Enel Green Power SpA
Mainstream Renewable Power Ltd
- *Disclaimer: Major Players sorted in no particular order

Recent Industry Developments
- July 2025: DBSA reached financial close on the 380 MW Overberg Wind Farm, South Africa’s largest privately developed wind project, using 39 Goldwind 6.2 MW turbines and securing a 230 MW PPA with Richards Bay Minerals.
- May 2025: Construction began on the 140 MW Ishwati Emoyeni wind farm, the first large-scale project to rely on an energy trader (NOA Group) for aggregated offtake.
- April 2025: The government approved the Renewable-Energy Masterplan, targeting 40-60% local content by 2025 and 70-90% by 2030.
- March 2025: South African-Swedish JV announced a USD 2.9 billion floating offshore wind proposal off KwaZulu-Natal.
- February 2025: Cennergi signed a 140 MW wheeled PPA with Northam Platinum, reducing the miner’s electricity cost by up to 20%.
- August 2024: Vestas booked 95 MW in new South Africa turbine orders, lifting 2024 sales to 383 MW, the highest among OEMs.


South Africa Wind Energy Market Report Scope
The wind energy market refers to using wind energy resources for electricity generation. Wind energy is harnessed by wind turbines that channel the power of the wind to produce electricity. A wind turbine consists of three blades: a rotor and a generator. The electricity generated by a wind turbine is fed into the grid for its consumption by an end-user. The market sizing and forecasts for each segment have been done based on Installed Capacity (in MW) during the forecast period. The South Africa wind energy market report includes:
By Location
| Onshore |
| Offshore |
By Turbine Capacity
| Up to 3 MW |
| 3 to 6 MW |
| Above 6 MW |
By Application
| Utility-scale |
| Commercial and Industrial |
| Community Projects |
By Component (Qualitative Analysis)
| Nacelle/Turbine |
| Blade |
| Tower |
| Generator and Gearbox |
| Balance-of-System |
| By Location | Onshore |
| Offshore | |
| By Turbine Capacity | Up to 3 MW |
| 3 to 6 MW | |
| Above 6 MW | |
| By Application | Utility-scale |
| Commercial and Industrial | |
| Community Projects | |
| By Component (Qualitative Analysis) | Nacelle/Turbine |
| Blade | |
| Tower | |
| Generator and Gearbox | |
| Balance-of-System |


Key Questions Answered in the Report
How fast is South Africa's wind capacity expected to grow by 2031?
Installed capacity is projected to rise from 4.35 GW in 2026 to 9.92 GW by 2031 at an 17.92% CAGR.
What is driving corporate demand for wind power in South Africa?
Grid-code reforms now permit wheeling, enabling mining and industrial firms to lock in fixed-price PPAs that undercut Eskom tariffs by up to 20%.
Which turbine class is expanding the quickest?
Above 6 MW turbines are growing at a 20.12% CAGR as developers favor scale economies and grid operators seek fewer connection points.
Where are the main geographic bottlenecks for new wind projects?
The Northern and Western Cape provinces suffer from transmission congestion, causing hundreds of GWh in curtailment each year.
How is local manufacturing being promoted?
The 2025 Renewable-Energy Masterplan offers preferential bid scores and duty relief, pushing towers, blades, and balance-of-plant toward 40-60% local content by 2025.
What role do hybrids play in the market?
Projects coupling wind with batteries, such as Oya Energy's hybrid, mitigate curtailment risk and supply dispatchable renewable power to industrial buyers.
Page last updated on:


