South America Rice Market Analysis by Mordor Intelligence
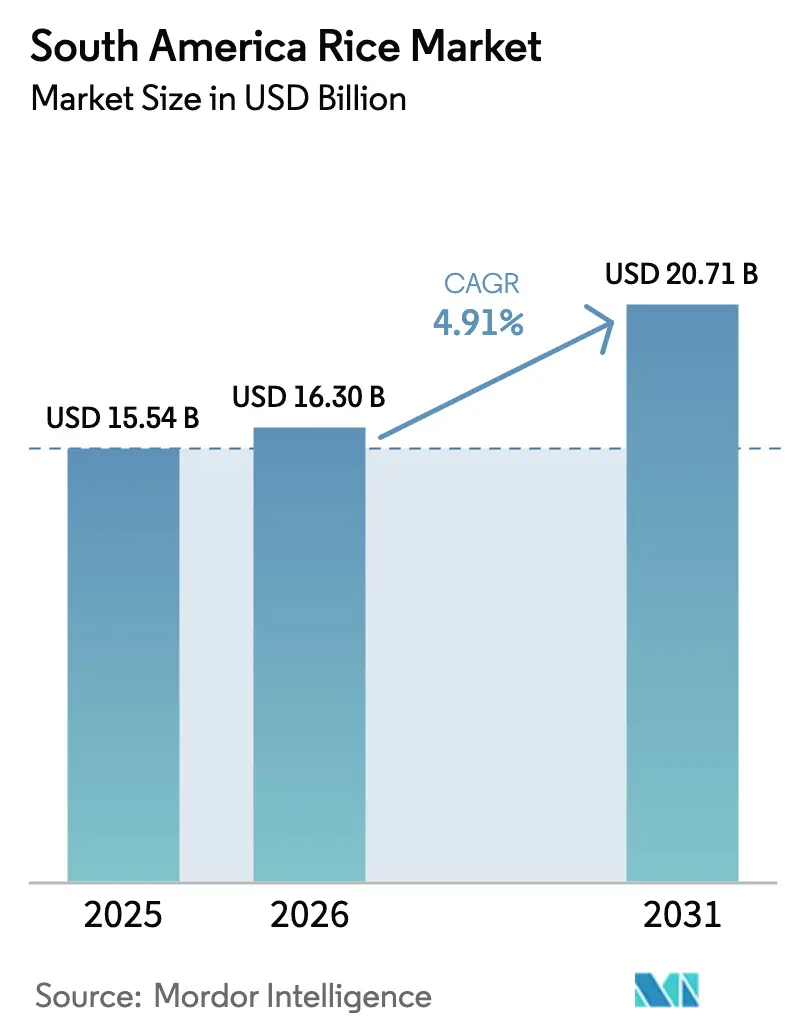
The South America rice market size is projected to expand from USD 15.54 billion in 2025 and USD 16.30 billion in 2026 to USD 20.71 billion by 2031, registering a CAGR of 4.91% between 2026 to 2031. Productivity gains from hybrid-seed adoption, mechanization on farms above 100 hectares, and expanding irrigated acreage in the La Plata Basin are sustaining growth even as El Niño-linked weather swings add year-to-year volatility. Brazil remains the production anchor, but land competition from soy and corn constrains its medium-term output. Peru’s concerted import-substitution push, together with rising per-capita consumption in coastal cities, positions it as the fastest-expanding national segment. Export-oriented suppliers in Argentina and Uruguay benefit from favorable tax regimes but face tightening pesticide-residue rules in Europe and Japan, accelerating the shift toward blockchain-based traceability.
Key Report Takeaways
By geography, Brazil led with 48.9% South America rice market share in 2025, whereas Peru is forecast to expand at a 6.6% CAGR through 2031.
Note: Market size and forecast figures in this report are generated using Mordor Intelligence’s proprietary estimation framework, updated with the latest available data and insights as of January 2026.
South America Rice Market Trends and Insights
Drivers Impact Analysis*
| Driver | (~) % Impact on CAGR Forecast | Geographic Relevance | Impact Timeline |
|---|---|---|---|
| Rising rice productivity through hybrid-seed adoption | +0.8% | Brazil, Argentina, and Uruguay core adoption zones | Medium term (2-4 years) |
| Mechanization upgrades on medium and large farms | +0.7% | Brazil, Argentina, and Uruguay with farm consolidation | Medium term (2-4 years) |
| Expansion of irrigated acreage along La Plata Basin | +0.6% | Argentina, Uruguay, and Paraguay riparian zones | Long term (≥ 4 years) |
| Government export-revenue incentives | +0.5% | Argentina and Uruguay export-focused policies | Short term (≤ 2 years) |
| Growing intra-regional demand from food processors | +0.6% | Brazil, Peru, and Chile urban consumption hubs | Medium term (2-4 years) |
| Blockchain-based traceability premiums | +0.3% | Brazil and Argentina premium export channels | Long term (≥ 4 years) |
| Source: Mordor Intelligence | |||
Rising Rice Productivity Through Hybrid-Seed Adoption
Hybrid varieties deliver 15%-20% higher yields but cost more than inbred lines, which slows their uptake outside pilot programs. Embrapa commercialized two hybrids for southern Brazil in 2024, targeting farmers who accept a 30% seed premium for shorter maturity and improved lodging resistance[1]Source: EMBRAPA, “Hybrid Rice Cultivars for Irrigated Systems,” embrapa.br. Argentina’s National Institute of Agricultural Technology (INTA) is field-testing private-sector hybrids in Entre Ríos and Corrientes, with releases projected by 2026. Peru subsidized certified hybrid seed for 5,000 coastal smallholders in 2025, narrowing the yield gap between irrigated and rain-fed districts. The resulting output stability supports export commitments, even when land is shifted to soy or corn.
Mechanization Upgrades on Medium and Large Farms
Farm consolidation enables the use of capital-intensive machinery, which cuts input costs by 8%-12%. Combine-harvester deliveries to Rio Grande do Sul climbed 12% in 2024, financed by Banco do Brasil credit lines. GPS-guided planters in Argentina’s Litoral region reduced seed waste by 18% the same year. Ecuador’s Rice Cluster, backed by the Inter-American Development Bank, laser-leveled 280,000 hectares in 2024-2025, lowering water use by 20% [2]Source: Inter-American Development Bank, “Laser Land Leveling in Ecuador’s Rice Sector,” iadb.org. Profitability at mechanized farms remains positive even when prices dip below USD 400 per metric ton.
Expansion of Irrigated Acreage Along La Plata Basin
The basin supports 70% of the regional paddy land. Uruguay added 4,000 hectares of irrigated land in 2024 through public-private reservoir projects. Argentina cleared 12 new irrigation permits for Corrientes in 2025, targeting 15,000 hectares by 2027. An Inter-American Development Bank (IDB)-funded study is optimizing multistate reservoir releases to balance hydropower, navigation, and agricultural withdrawals. Reliable irrigation reduces weather-driven yield fluctuations, allowing for long-term supply contracts.
Government Export-Revenue Incentives
Argentina’s rice export tax remained at 12% in 2025, far below the 33% levy on soy, creating a relative incentive for rice cultivation in irrigated provinces. Uruguay eliminated its rice export tax in 2024, improving net-back margins by about 12% and strengthening its competitiveness in regional and Middle Eastern markets. Paraguay launched a USD 20 million program in 2025 to co-fund phytosanitary certifications and quality audits for exports to Chile and Colombia. These policy differentials shift relative returns between crops, steering acreage toward rice when soy prices soften.
Restraints Impact Analysis*
| Restraint | (~) % Impact on CAGR Forecast | Geographic Relevance | Impact Timeline |
|---|---|---|---|
| El Niño-driven flood and drought cycles | -0.9% | Brazil (Rio Grande do Sul) and Argentina (Litoral region) | Short term (≤ 2 years) |
| Competition from soy and corn for prime farmland | -0.6% | Brazil, Argentina, and Paraguay rotation zones | Medium term (2-4 years) |
| Low farm-gate prices in oversupply years | -0.4% | Argentina and Uruguay export regions | Medium term (2-4 years) |
| Logistics bottlenecks at inland waterways | -0.3% | Paraguay and Argentina Hidrovía corridor | Short term (≤ 2 years) |
| Source: Mordor Intelligence | |||
El Niño-Driven Flood and Drought Cycles
The 2023-2024 El Niño slashed Rio Grande do Sul’s harvest by 15% and prompted Argentina’s first rice imports in a decade. La Niña rainfall in early 2025 then delayed planting in Uruguay’s Treinta y Tres district. International Monetary Fund (IMF) analysis indicates that a 10% deviation in rainfall leads to a 6%-8% change in rice yields, compared to 3%-5% for soybeans [3]Source: International Monetary Fund, “El Niño and Commodity Yields,” imf.org. Higher yield risk inflates insurance costs, deterring capital outlays for irrigation. The Food and Agriculture Organization of the United Nations (FAO) deployed anticipatory action plans in Bolivia, Ecuador, and Peru in 2024 to support smallholders.
Competition from Soy and Corn for Prime Farmland
In 2024, Brazil expanded its soybean cultivation by 1.2 million hectares, primarily in regions where rice and soy are rotated. Argentina's corn acreage grew by 8%, driven by favorable export prices and reduced input costs. In contrast, Paraguay's rice acreage decreased by 5% as farmers shifted to soybean cultivation due to improved crush margins and prices exceeding USD 450 per ton. Soybean and corn crops benefit from simpler agronomic practices, more developed commodity-finance markets, and higher returns per hectare. These factors continue to exert pressure on rice cultivation, which faces challenges in retaining land unless supported by export-tax relief, government incentives, or long-term contracts with processors.
*Our forecasts treat driver/restraint impacts as directional, not additive. The impact forecasts reflect baseline growth, mix effects, and variable interactions.
Geography Analysis
Brazil holds 48.9% of the South America rice market share in 2025. Demand stability masks short-term supply swings driven by weather and crop rotation. Rice imports of 2.4 million metric tons in 2025 helped balance a domestic shortfall, underscoring the continued regional interdependence. Government price-support mechanisms and public stock management further cushioned domestic volatility, reinforcing Brazil’s role as the anchor market in the region.
Peru’s segment expands at a 6.6% CAGR, the fastest in the South America rice market, aided by coastal irrigation and hybrid-seed subsidies. Domestic output rose 9% year-on-year in 2025/26 while consumption of 2.8 million metric tons still required imports, positioning Peru as a reliable outlet for Uruguayan and Paraguayan surpluses. The interplay of these two geographies illustrates how consumption growth can outpace production even in high-yield zones, preserving intra-regional trade flows despite localized weather adversity.
Argentina and Uruguay benefited from lower or zero export taxes on rice production. Both countries channel a large share of their output to neighboring Brazil and Peru. Uruguay’s long-grain competitiveness improved after it abolished export taxes in 2024, while Argentina’s remaining levy is still well below that applied to soy, which continues to make rice acreage attractive in Corrientes and Entre Ríos. This favorable tax environment supports export-oriented planting decisions and strengthens the Southern Cone’s role as a swing supplier within the South America rice market.
Competitive Landscape
The South America rice market operates under a two-tier structure. Regional integrated companies dominate activities such as milling, branding, and retail, while global commodity traders primarily focus on bulk exports and logistics. In Brazil, Camil Alimentos holds approximately 30% of retail milled rice sales. Meanwhile, SLC Agrícola and Adecoagro concentrate on large-scale farming, adjusting rice acreage based on comparative returns from soy and corn. In Argentina, Molinos Río de la Plata leads the milling segment, competing with SAMAN (Ebro Foods) in Uruguay, while Alicorp plays a significant role in Peru’s milling sector.
Multinational traders such as Cargill Incorporated, Archer Daniels Midland Company, Louis Dreyfus Company Holdings B.V., Olam International Limited, and COFCO Corporation continue to manage substantial export volumes. However, increasing downstream integration by regional players is compressing their margins. SunRice Uruguay, for example, targets export markets by adhering to strict quality and phytosanitary standards, reflecting a shift toward differentiated, higher-value rice products rather than traditional bulk trading.
Recent market strategies emphasize vertical integration, capacity expansion, automation, and the introduction of convenience formats. In 2024, Josapar expanded its parboiled rice production capacity in Brazil. Similarly, Urbano Agroindustrial upgraded its processing lines in 2025 to supply supermarkets directly. Chile’s Tucapel remains a significant importer and distributor, sourcing rice from Argentina and Uruguay. Regional firms are increasingly moving closer to end consumers, thereby reducing the role of global traders in value-added segments.
Recent Industry Developments
- January 2026: Cibus and Interoc have signed a non-binding agreement to facilitate the commercialization of herbicide-tolerant rice traits in key South American markets. The partnership aims to launch initially in Ecuador and Colombia by 2027, with plans to expand into Peru and other rice-producing countries in the region to enhance weed control and agricultural productivity.
- May 2024: Brazil has removed import tariffs on certain types of rice until the end of 2024. This decision aims to address potential shortages and lower prices following floods in Rio Grande do Sul, a key rice-producing region in the country. The tariff exemption applies to HS codes 10061092 and 10062020, which previously had a 9% tariff, and 10063021, which was subject to a 10.8% tariff.
- June 2023: Epagri has launched its 34th variety of irrigated rice, designed to address the challenges of climate change in southern Brazil. This variety is tolerant to temperature extremes, including both cold and heat, during the reproductive phase.


South America Rice Market Report Scope
Rice is a cereal grain derived from the annual grass Oryza sativa, cultivated primarily in warm climates and serving as a major global food source. In South America, it holds significant economic importance as a staple crop. The South America Rice Market Report is segmented by Geography into Brazil, Argentina, Chile, Peru, Uruguay, Paraguay, Ecuador, and Bolivia. The Report includes Production Analysis (Volume), Consumption (Value and Volume), Imports (Value and Volume), Exports (Value and Volume), Wholesale Price Trend Analysis and Forecast, Regulatory Framework, List of Key Players, Logistics and Infrastructure, and Seasonality Analysis. The Market Forecasts are Provided in Terms of Value (USD) and Volume (Metric Tons).
By Geography
| Brazil | Production Analysis (Area Harvested, Yield, and Production Volume) |
| Consumption Analysis (Consumption Value and Volume) | |
| Import Market Analysis (Import Value, Volume, and Key Supplying Markets) | |
| Export Market Analysis (Export Value, Volume, and Key Destination Markets) | |
| Wholesale Price Trend Analysis and Forecast | |
| Regulatory Framework | |
| List of Key Players | |
| Logistics and Infrastructure | |
| Seasonality Analysis | |
| Argentina | Production Analysis (Area Harvested, Yield, and Production Volume) |
| Consumption Analysis (Consumption Value and Volume) | |
| Import Market Analysis (Import Value, Volume, and Key Supplying Markets) | |
| Export Market Analysis (Export Value, Volume, and Key Destination Markets) | |
| Wholesale Price Trend Analysis and Forecast | |
| Regulatory Framework | |
| List of Key Players | |
| Logistics and Infrastructure | |
| Seasonality Analysis | |
| Chile | Production Analysis (Area Harvested, Yield, and Production Volume) |
| Consumption Analysis (Consumption Value and Volume) | |
| Import Market Analysis (Import Value, Volume, and Key Supplying Markets) | |
| Export Market Analysis (Export Value, Volume, and Key Destination Markets) | |
| Wholesale Price Trend Analysis and Forecast | |
| Regulatory Framework | |
| List of Key Players | |
| Logistics and Infrastructure | |
| Seasonality Analysis | |
| Peru | Production Analysis (Area Harvested, Yield, and Production Volume) |
| Consumption Analysis (Consumption Value and Volume) | |
| Import Market Analysis (Import Value, Volume, and Key Supplying Markets) | |
| Export Market Analysis (Export Value, Volume, and Key Destination Markets) | |
| Wholesale Price Trend Analysis and Forecast | |
| Regulatory Framework | |
| List of Key Players | |
| Logistics and Infrastructure | |
| Seasonality Analysis | |
| Uruguay | Production Analysis (Area Harvested, Yield, and Production Volume) |
| Consumption Analysis (Consumption Value and Volume) | |
| Import Market Analysis (Import Value, Volume, and Key Supplying Markets) | |
| Export Market Analysis (Export Value, Volume, and Key Destination Markets) | |
| Wholesale Price Trend Analysis and Forecast | |
| Regulatory Framework | |
| List of Key Players | |
| Logistics and Infrastructure | |
| Seasonality Analysis | |
| Paraguay | Production Analysis (Area Harvested, Yield, and Production Volume) |
| Consumption Analysis (Consumption Value and Volume) | |
| Import Market Analysis (Import Value, Volume, and Key Supplying Markets) | |
| Export Market Analysis (Export Value, Volume, and Key Destination Markets) | |
| Wholesale Price Trend Analysis and Forecast | |
| Regulatory Framework | |
| List of Key Players | |
| Logistics and Infrastructure | |
| Seasonality Analysis | |
| Ecuador | Production Analysis (Area Harvested, Yield, and Production Volume) |
| Consumption Analysis (Consumption Value and Volume) | |
| Import Market Analysis (Import Value, Volume, and Key Supplying Markets) | |
| Export Market Analysis (Export Value, Volume, and Key Destination Markets) | |
| Wholesale Price Trend Analysis and Forecast | |
| Regulatory Framework | |
| List of Key Players | |
| Logistics and Infrastructure | |
| Seasonality Analysis | |
| Bolivia | Production Analysis (Area Harvested, Yield, and Production Volume) |
| Consumption Analysis (Consumption Value and Volume) | |
| Import Market Analysis (Import Value, Volume, and Key Supplying Markets) | |
| Export Market Analysis (Export Value, Volume, and Key Destination Markets) | |
| Wholesale Price Trend Analysis and Forecast | |
| Regulatory Framework | |
| List of Key Players | |
| Logistics and Infrastructure | |
| Seasonality Analysis |
| By Geography | Brazil | Production Analysis (Area Harvested, Yield, and Production Volume) |
| Consumption Analysis (Consumption Value and Volume) | ||
| Import Market Analysis (Import Value, Volume, and Key Supplying Markets) | ||
| Export Market Analysis (Export Value, Volume, and Key Destination Markets) | ||
| Wholesale Price Trend Analysis and Forecast | ||
| Regulatory Framework | ||
| List of Key Players | ||
| Logistics and Infrastructure | ||
| Seasonality Analysis | ||
| Argentina | Production Analysis (Area Harvested, Yield, and Production Volume) | |
| Consumption Analysis (Consumption Value and Volume) | ||
| Import Market Analysis (Import Value, Volume, and Key Supplying Markets) | ||
| Export Market Analysis (Export Value, Volume, and Key Destination Markets) | ||
| Wholesale Price Trend Analysis and Forecast | ||
| Regulatory Framework | ||
| List of Key Players | ||
| Logistics and Infrastructure | ||
| Seasonality Analysis | ||
| Chile | Production Analysis (Area Harvested, Yield, and Production Volume) | |
| Consumption Analysis (Consumption Value and Volume) | ||
| Import Market Analysis (Import Value, Volume, and Key Supplying Markets) | ||
| Export Market Analysis (Export Value, Volume, and Key Destination Markets) | ||
| Wholesale Price Trend Analysis and Forecast | ||
| Regulatory Framework | ||
| List of Key Players | ||
| Logistics and Infrastructure | ||
| Seasonality Analysis | ||
| Peru | Production Analysis (Area Harvested, Yield, and Production Volume) | |
| Consumption Analysis (Consumption Value and Volume) | ||
| Import Market Analysis (Import Value, Volume, and Key Supplying Markets) | ||
| Export Market Analysis (Export Value, Volume, and Key Destination Markets) | ||
| Wholesale Price Trend Analysis and Forecast | ||
| Regulatory Framework | ||
| List of Key Players | ||
| Logistics and Infrastructure | ||
| Seasonality Analysis | ||
| Uruguay | Production Analysis (Area Harvested, Yield, and Production Volume) | |
| Consumption Analysis (Consumption Value and Volume) | ||
| Import Market Analysis (Import Value, Volume, and Key Supplying Markets) | ||
| Export Market Analysis (Export Value, Volume, and Key Destination Markets) | ||
| Wholesale Price Trend Analysis and Forecast | ||
| Regulatory Framework | ||
| List of Key Players | ||
| Logistics and Infrastructure | ||
| Seasonality Analysis | ||
| Paraguay | Production Analysis (Area Harvested, Yield, and Production Volume) | |
| Consumption Analysis (Consumption Value and Volume) | ||
| Import Market Analysis (Import Value, Volume, and Key Supplying Markets) | ||
| Export Market Analysis (Export Value, Volume, and Key Destination Markets) | ||
| Wholesale Price Trend Analysis and Forecast | ||
| Regulatory Framework | ||
| List of Key Players | ||
| Logistics and Infrastructure | ||
| Seasonality Analysis | ||
| Ecuador | Production Analysis (Area Harvested, Yield, and Production Volume) | |
| Consumption Analysis (Consumption Value and Volume) | ||
| Import Market Analysis (Import Value, Volume, and Key Supplying Markets) | ||
| Export Market Analysis (Export Value, Volume, and Key Destination Markets) | ||
| Wholesale Price Trend Analysis and Forecast | ||
| Regulatory Framework | ||
| List of Key Players | ||
| Logistics and Infrastructure | ||
| Seasonality Analysis | ||
| Bolivia | Production Analysis (Area Harvested, Yield, and Production Volume) | |
| Consumption Analysis (Consumption Value and Volume) | ||
| Import Market Analysis (Import Value, Volume, and Key Supplying Markets) | ||
| Export Market Analysis (Export Value, Volume, and Key Destination Markets) | ||
| Wholesale Price Trend Analysis and Forecast | ||
| Regulatory Framework | ||
| List of Key Players | ||
| Logistics and Infrastructure | ||
| Seasonality Analysis | ||


Key Questions Answered in the Report
How large is the South American rice market in 2026?
The South American rice market size is projected to be USD 16.30 billion in 2026, keeping it on track for a 4.91% CAGR to 2031.
Which country accounts for the biggest share of regional production in 2025?
Brazil holds about 48.9% South American rice market share in 2025.
Why is Peru considered the fastest-growing national segment?
Peru’s 6.6% CAGR through 2031, stems from expanding coastal irrigation, hybrid-seed subsidies, and an import-substitution program that narrows its supply gap.
How do El Niño and La Niña events affect regional output?
Rainfall extremes tied to the oscillation can swing yields by 6%-8%, prompting higher insurance costs and reinforcing investment in irrigation.
Page last updated on:


