
Laboratory Filtration Market Size and Share
Market Overview
| Study Period | 2020 - 2031 |
|---|---|
| Market Size (2026) | USD 5.01 Billion |
| Market Size (2031) | USD 7.58 Billion |
| Growth Rate (2026 - 2031) | 8.63 % |
| Fastest Growing Market | Asia-Pacific |
| Largest Market | North America |
| Market Concentration | Medium |
Major Players *Disclaimer: Major Players sorted in no particular order Image © Mordor Intelligence. Reuse requires attribution under CC BY 4.0. | |
Laboratory Filtration Market Analysis by Mordor Intelligence
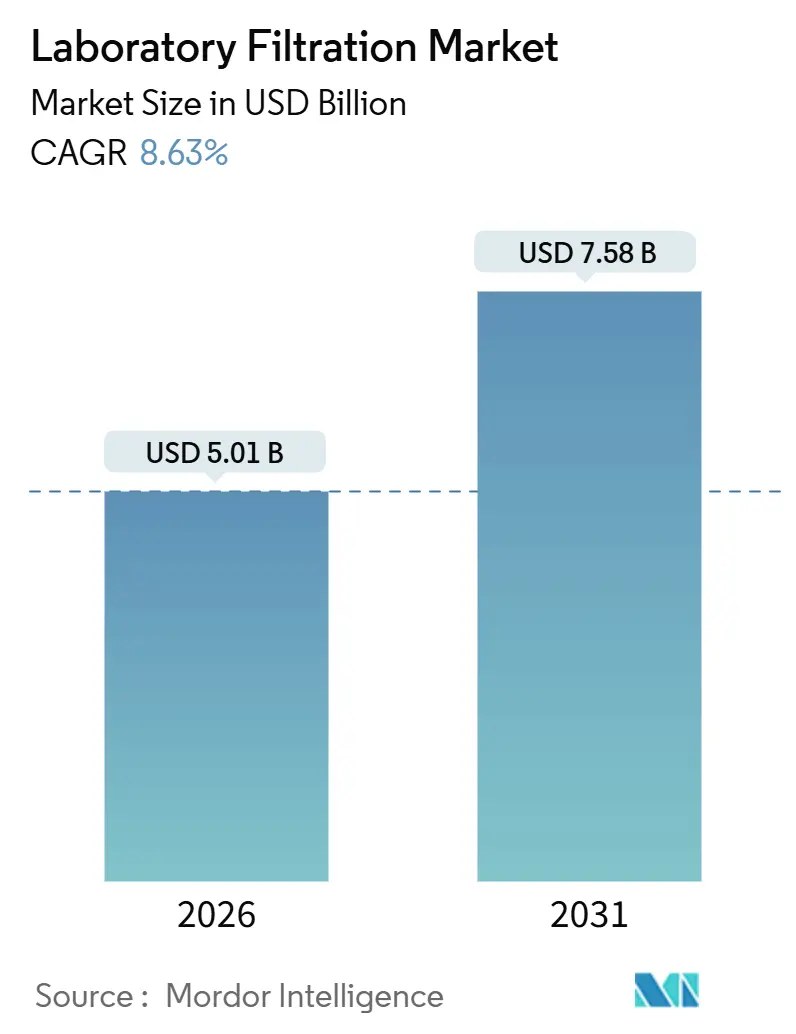
The Laboratory Filtration Market size is estimated at USD 5.01 billion in 2026, and is expected to reach USD 7.58 billion by 2031, at a CAGR of 8.63% during the forecast period (2026-2031).
Cell- and gene-therapy scale-up replaces stainless-steel loops with disposable capsules, which reduce cross-contamination risk and validation time. Meanwhile, biopharma R&D spending drives contract labs to secure annual media contracts, stabilizing demand. Miniaturized high-throughput screening rigs increase accessory consumption because every 96-well plate incorporates discrete 0.2-µm filters, strengthening the connections between filtration suppliers and instrumentation OEMs. Viral-safety mandates now require orthogonal barriers, so monoclonal-antibody manufacturers embed 20-nm nanofiltration steps that lift consumable value per batch, turning compliance into a clear revenue accelerant. Competitive dynamics favor vertically integrated vendors capable of casting membranes, assembling sterile capsules, and shipping within 48 hours; yet, white space persists in nanoliter-scale devices and hybrid ceramic-polymer media that resist caustic cleaning, leaving the laboratory filtration market open for niche innovators.
Key Report Takeaways
- By product type, Filtration Media led with 57.31% revenue share in 2025, whereas Filtration Accessories are forecast to expand at a 10.92% CAGR through 2031.
- By technique, microfiltration accounted for 39.68% of the laboratory filtration market share in 2025, while nanofiltration and reverse osmosis are projected to grow at a 9.54% CAGR through 2031.
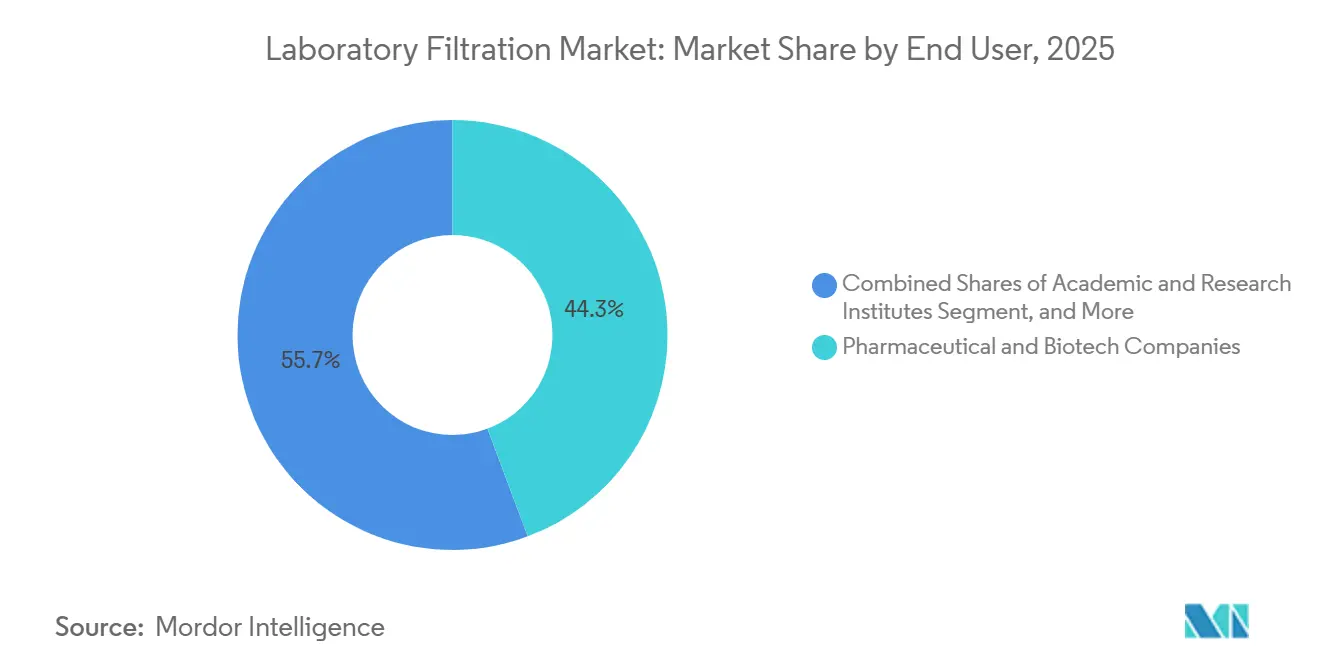
- By end user, pharmaceutical and biotechnology companies held a 44.26% share in 2025, but academic and research institutes are advancing at a 12.51% CAGR over the forecast window.
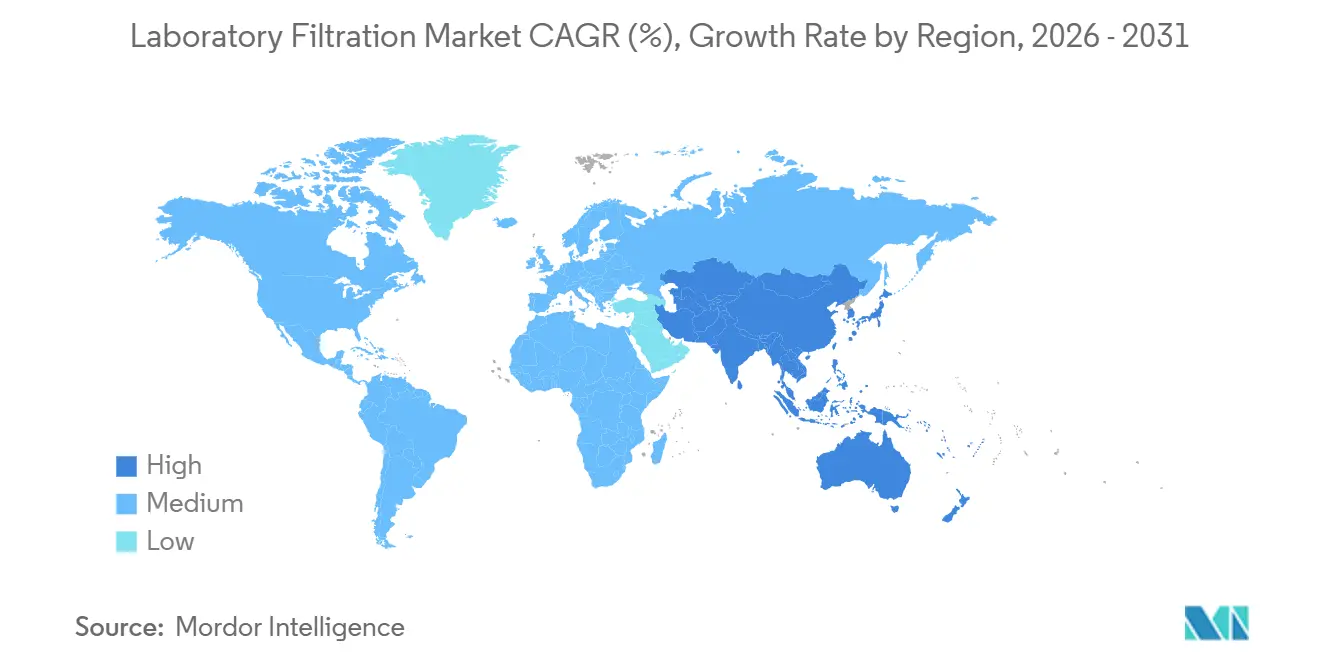
- By geography, North America commanded a 36.24% share in 2025, whereas the Asia-Pacific region is poised for an 11.63% CAGR through 2031, as China and India license dozens of biosimilar plants.
Note: Market size and forecast figures in this report are generated using Mordor Intelligence’s proprietary estimation framework, updated with the latest available data and insights as of January 2026.
Market Trends and Insights
Drivers Impact Analysis of Laboratory Filtration Market*
| Driver | (~) % Impact on CAGR Forecast | Geographic Relevance | Impact Timeline |
|---|---|---|---|
| Accelerating Biopharma R&D Spend | +2.3% | Global, concentrated in North America & Europe | Medium term (2-4 years) |
| Expansion of Cell & Gene Therapy Manufacturing | +2.1% | North America, Europe, Asia-Pacific (China, Japan, South Korea) | Long term (≥ 4 years) |
| Rapid Adoption of Single-Use Filtration Assemblies | +1.8% | Global, led by North America & Western Europe | Short term (≤ 2 years) |
| Miniaturized High-Throughput Screening Driving Microfiltration Demand | +1.4% | North America, Europe, Asia-Pacific research hubs | Medium term (2-4 years) |
| Growth of CROs & CDMOs Boosting Cost-Effective Filtration Assemblies | +1.6% | Asia-Pacific core, spill-over to Latin America & MEA | Medium term (2-4 years) |
| Technological Advancements in Laboratory Filtration | +1.2% | Global, early adoption in North America & Europe | Long term (≥ 4 years) |
| Source: Mordor Intelligence | |||
Accelerating Biopharma R&D Spend
Global pharmaceutical R&D reached USD 244 billion in 2025, a 7.5% increase year-over-year, with biologics accounting for 62% of this expenditure.[1]Pharmaceutical Research and Manufacturers of America, “Biopharmaceutical Research Industry Profile 2025,” phrma.org Each investigational new drug submission now triggers 15–20 sterility and viral clearance validation runs, which translates into a membrane area equivalent to three to five production batches. Contract laboratories experienced a 28% increase in sample throughput for stability testing, prompting procurement managers to negotiate long-term filtration-media agreements that secure price and availability. Regulators continue to refine guidance on process validation, prompting sponsors to repeat studies to meet evolving sterility benchmarks, thereby sustaining membrane consumption. The upshot is a durable baseline of recurring orders that helps the laboratory filtration market weather macroeconomic swings.
Expansion of Cell & Gene Therapy Manufacturing
Approved cell- and gene-therapy products climbed to 37 by end-2025, and 180 programs advanced to Phase II/III, doubling the installed base of GMP suites dedicated to viral-vector work.[2]U.S. Food and Drug Administration, “Guidance for Industry: Sterile Drug Products Produced by Aseptic Processing,” fda.gov Lentiviral and AAV purification depend on tangential-flow filtration, with each 50-L bioreactor run consuming around 12 m² of hollow-fiber membrane. Sartorius reported that cell-therapy customers rose from 11% to 19% of its bioprocess revenue between 2023 and 2025, underlining how the segment reshapes order books.[3]Sartorius AG, “Investor Relations – Annual Reports,” sartorius.com Commercial-scale expansion will require a tenfold increase in filtration capacity by 2028, compelling CDMOs to pre-qualify multiple suppliers. Vendors able to furnish viral-retention data across diverse serotypes enjoy a widening moat in the laboratory filtration market.
Rapid Adoption of Single-Use Filtration Assemblies
Single-use systems accounted for 58% of new filtration installations in 2025, up from 41% in 2022, as operators eliminated cleaning validation and reduced turnaround time from 18 hours to under 2 hours. Danaher’s Cytiva unit reported 34% growth in single-use filtration, nearly triple the pace of its reusable line, confirming the demand from small-volume, multi-product campaigns. Although per-liter consumable costs are higher, the total cost of ownership breaks even below 500 L, covering most clinical and niche commercial lots. Waste-disposal rules remain a hurdle, but industry consortia are piloting take-back schemes that reduce landfill volumes, sustaining momentum for disposables in the laboratory filtration market.
Miniaturized High-Throughput Screening Driving Microfiltration Demand
Drug-discovery robots now process 50,000 compounds per week, and each well requires a dedicated filter to prevent carryover, multiplying accessory volumes far faster than media footage. Agilent’s 2025 launch of Captiva Premium syringe filters reduced ion suppression in LC-MS workflows by 18%, demonstrating how performance differentiation can command price premiums in otherwise commoditized formats. Academic core facilities are following the trend, acquiring microplate filter inserts to streamline sample preparation for metabolomics. This surge underpins the laboratory filtration market’s accessory boom and helps offset margin pressure in standard cartridges.
Restraints Impact Analysis of Laboratory Filtration Market*
| Restraint | (~) % Impact on CAGR Forecast | Geographic Relevance | Impact Timeline |
|---|---|---|---|
| Supply-Chain Volatility for High-Grade Membrane Polymers | -1.2% | Global, acute in Asia-Pacific polymer production hubs | Short term (≤ 2 years) |
| Waste-Disposal Compliance Costs for Single-Use Plastics | -0.7% | Europe & North America, emerging in Asia-Pacific | Medium term (2-4 years) |
| Price Pressure from Commoditization of Syringe Filters | -0.6% | Global, most acute in price-sensitive emerging markets | Short term (≤ 2 years) |
| Emerging PFAS Regulations Limiting PTFE Filter Use | -0.9% | North America & Europe, potential spill-over to APAC | Medium term (2-4 years) |
| Source: Mordor Intelligence | |||
Supply-Chain Volatility for High-Grade Membrane Polymers
Polyvinylidene fluoride and polyethersulfone resins originate from just three Asian producers, so any disruption cascades through lead times of 8 to 12 weeks for finished rolls. A typhoon shut down a Taiwan PVDF plant in August 2025, reducing availability by 18% and driving up spot prices for pharmaceutical-grade PES by 23%. Large vendors hedge with multi-year offtake contracts, but mid-tier assemblers endure allocation cuts that erode margins. Regulatory dossiers name specific membrane chemistries, making emergency substitutions costly. Vertical integration, such as Sartorius’ 2024 acquisition of a PES compounder, partially insulates top players; however, supply shocks remain a structural headwind for the laboratory filtration market.
Waste-Disposal Compliance Costs for Single-Use Plastics
Europe’s Waste Framework Directive amendments and several U.S. state laws impose extended producer responsibility fees on single-use plastics made from bioplastics. Disposal costs add 3–7¢ per liter of processed biologic, prompting CDMOs to consider reuse options. Suppliers counter with take-back programs that pelletize spent capsules for energy recovery, but logistics remain complex. Until harmonized guidelines emerge, compliance expenditures will clip near-term margin expansion in the laboratory filtration market.
*Our forecasts treat driver/restraint impacts as directional, not additive. The impact forecasts reflect baseline growth, mix effects, and variable interactions.
Laboratory Filtration Market Segment Analysis
By Product Type:
Media Dominates, Accessories Surge on AutomationFiltration Media captured 57.31% of revenue in 2025, underscoring the centrality of membrane rolls, pleated cartridges, and capsule filters to every stage of bioprocessing. Commoditization of 0.22-µm discs compresses margins, so suppliers differentiate through hydrophilic coatings and charged layers that command 20% premiums. Filtration Accessories, though smaller in value, are forecast to expand at a 10.92% CAGR to 2031 as laboratories automate liquid handling. A single screening robot can process 10,000 syringe filters per day, making accessories the fastest-growing segment of the laboratory filtration market.
Media stays on top because each biologics batch consumes square meters of membrane, but accessories now drive incremental profit. Bundling precision filters with pipetting decks locks in aftermarket revenue and discourages third-party alternatives. Filtration Assemblies, which include plug-and-play capsules and tangential-flow skids, sit between the two extremes, winning favor at CDMOs that prioritize rapid tech transfer over bespoke engineering. The laboratory filtration market size for assemblies is poised to increase in line with the uptake of single-use products; however, its growth rate lags behind the accessory boom due to longer unit replacement cycles.




By Technique:
Microfiltration Leads, Nanofiltration Gains on Viral SafetyMicrofiltration held 39.68% of technique revenue in 2025, reflecting its versatility in clarifying harvests and ensuring sterile fill-finish. Standard 0.2-µm capsules are commodity items, but vendors now embed pressure sensors that feed real-time data into batch-record software, lifting the laboratory filtration market size by pairing hardware with analytics. Nanofiltration and reverse-osmosis units are expected to rise at a 9.54% CAGR as regulators demand additional viral-clearance barriers. A USD 1,500 disposable nanofilter that averts a USD 50 million contamination event is an easy sell, so nanofiltration’s value proposition transcends price.
Ultrafiltration tracks biologics output, concentrating proteins and exchanging buffers, yet its growth is steadier. Vacuum and depth filtration serve small-molecule QC and environmental labs where cost sensitivity caps ASPs. Hybrid techniques, such as electrofiltration, hover below a 5% share but command premium pricing because they shorten the downstream processing. The laboratory filtration market share mix will inch toward tighter-pore solutions as viral-safety culture spreads beyond monoclonals to vaccines and gene therapies.
By End User:
Pharmaceutical & Biotechnology Labs Retain LeadershipPharmaceutical & Biotechnology Companies generated 44.26% of 2025 revenue, as a single commercial monoclonal can burn through USD 3 million in membranes annually. GMP mandates ensure recurrent orders, and corporate QA departments prize suppliers that deliver lot traceability and change-control transparency. Academic & Research Institutes will rise at a 12.51% CAGR, helped by a 31% growth in NIH funding for infectious-disease and synthetic-biology labs between 2024 and 2025. University core facilities favor pre-sterilized accessories that bypass autoclave queues, aligning with the growing demand for accessories in the laboratory filtration market.
Food & Beverage Testing, along with Environmental Testing, accounts for approximately 18% of the value. EPA revisions to the Lead and Copper Rule lift water-testing volumes, but municipal budgets cap spending on premium filters. Forensic and petrochemical labs form a modest “Others” bucket, adopting filtration only when particle counts jeopardize analytical detection. The laboratory filtration industry thus straddles high-growth academic niches and stable industrial segments, with the pharmaceutical industry still anchoring absolute demand.
Geography Analysis
North America Laboratory Filtration Market
North America held 36.24% revenue in 2025, backed by more than 1,200 GMP suites and the world’s densest cluster of cell-therapy developers. U.S. CDMOs trial next-generation membranes first, so suppliers channel pilot lots to local customers, reinforcing the region’s status as an early adopter. Canada’s vaccine initiative funnels grants into single-use, ready-to-pilot plants, expanding the pull of accessories.
APAC Laboratory Filtration Market
The Asia-Pacific region is the growth engine, with an 11.63% CAGR projected through 2031. China licensed 47 biosimilar plants in 2024, and India approved 29 biologics facilities in 2025 that standardized on disposable trains to satisfy U.S. FDA export norms. Samsung Biologics and WuXi Biologics added over 400,000 L of capacity, selecting partners who can deliver within 48 hours. Japan retrofits stainless steel lines with hybrid single-use modules to reduce cleaning and validation downtime, spurring demand for capsule filters.
EMEA and South America Laboratory Filtration Market
Europe expands steadily, driven by EMA guidance on continuous manufacturing, which heightens the need for inline filtration. Germany and Switzerland are pivoting to autologous CAR-T platforms, so each patient lot requires dedicated filters, which lifts per-lot spend by up to 50%. The United Kingdom’s post-Brexit convergence with EU standards eases supplier compliance. The Middle East & Africa are smaller today, yet Gulf states pledged USD 1 billion in 2025 for local biopharma, importing filtration assemblies until regional conversion plants emerge. South America’s Brazil and Argentina push vaccine self-reliance; Fiocruz opened a 50,000-L complex in 2025 fitted with tangential-flow disposables. Across all regions, greenfield facilities leapfrog to single-use, accelerating the adoption of premium capsules and assemblies in the laboratory filtration market.

Regulatory Landscape
Laboratory filtration products that fall under medical-device definitions need to meet jurisdiction-specific quality and premarket requirements. In the United States, manufacturers selling regulated filtration devices follow FDA device classification and, where applicable, the 510(k) pathway for Class II devices unless exempt, alongside establishment registration and compliance with the FDA Quality Management System Regulation (QMSR), which comes into effect in 2026. This heightens the focus on design controls, traceability, and change control for materials such as PES and PVDF membranes that are referenced in validation packages.
In Europe, EU MDR 2017/745 increases the documentation burden for regulated filtration devices through Annex II and III technical documentation, linking performance testing and risk management to general safety and performance requirements. Standards activity also shapes test expectations across filtration media and membranes, including SIST EN ISO 7704:2023 for membrane filter performance in microbiological analysis and ISO 25081:2026 (published May 2026) covering test methods for particulate matter filtration in nonwovens. As PFAS-related scrutiny expands in North America and Europe, suppliers with alternatives to PTFE and clear comparability protocols reduce customer revalidation risk in regulated laboratory workflows.
Value Chain Analysis
The value chain begins upstream with a limited pool of specialty polymer and precursor suppliers feeding membrane producers for PES, PVDF, nylon, and regenerated cellulose. Membrane casting, nonwoven formation, and surface functionalization are followed by converting (pleating, cutting discs, assembling capsules/cassettes), then sterilization, packaging, and lot-release testing for compliance-grade products. Vertically integrated leaders such as Merck KGaA, Sartorius, and Danaher (Pall and Cytiva) pair membrane and device manufacturing with quality systems that support traceability, while challengers and specialists such as GVS, Porvair, and instrument-adjacent suppliers like Agilent compete through format innovation and workflow performance.
Downstream, distribution splits between direct sales to biopharma, CRO, and CDMO accounts and channel partners serving academic, environmental, and QC labs. Consumables are pulled through by instrumentation and automation platforms, including microplates and robotic sample preparation. Bottlenecks cluster around validated, lot-tracked production capacity and specialty membrane supply, which shows up in extended lead times for premium TFF cassettes and longer qualification cycles (often months). Once a filter is locked into SOPs and dossiers, switching costs rise. Emerging hybrid approaches, including inertial microfluidic clarification demonstrated in 2026 research using 3M Harvest RC filters for viral vector workflows, also create integration points between filtration media, devices, and process-intensification hardware.
Competitive Landscape
The top five vendors, Sartorius, Danaher (Cytiva & Pall), Merck KGaA, Thermo Fisher, and Repligen, control a significant portion of global revenue, placing the laboratory filtration market in the mid-concentration band. Vertical integration distinguishes leaders: Sartorius owns membrane-casting lines and cleanrooms, enabling 48-hour ship times, while Danaher’s Cytiva-Pall combo spans upstream to final fill, making one-stop procurement viable. Merck embeds NFC tags in filters to automate lot traceability, extracting premiums of 12–15% as QA teams adopt digital batch records.
White space remains in nanoliter-scale filtration for organ-on-chip devices, where current syringe filters waste precious samples. Hybrid ceramic-polymer membranes that tolerate caustic cleaning also beckon; multiple MIT-licensed startups target the niche. Digital service add-ons differentiate challengers: a cloud integrity-test dashboard cut downtime by 18% at pilot users. Meanwhile, niche firms like Porvair and GVS thrive by focusing on sintered-polymer depth filters and serum-clarification pre-filters, product lines too small for global giants to prioritize.
Patent velocity is brisk; the USPTO granted 127 filtration patents in 2025, with 34% focused on low-binding surfaces and 28% on single-use integrity testing. Acquisitions also reshape the map: Repligen acquired Polymem in August 2025 to secure hollow-fiber capacity, while Thermo Fisher expanded its Singapore capsule plant to protect Asia's customer lead times. The laboratory filtration market, therefore, balances scale economies with innovation niches, encouraging both titans and newcomers to invest.
Laboratory Filtration Industry Leaders
Merck KgaA
Danaher Corporation
Sartorius AG
GVS S.p.A
3M
- *Disclaimer: Major Players sorted in no particular order

Laboratory Filtration Market Companies Covered in this Report
- 3M
- Agilent Technologies
- Avantor Inc. (VWR)
- Clarcor Industrial Air
- Cobetter Filtration Group
- Cole-Parmer (Antylia Scientific)
- Corning
- Danaher Corp. (Cytiva & Pall)
- Donaldson Company Inc.
- Eaton
- GVS
- Membrane Solutions LLC
- Merck KGaA (MilliporeSigma)
- Parker Hannifin
- Porvair plc
- Repligen
- Sartorius
- Sterlitech
- Thermo Fisher Scientific

Market Opportunities and Future Outlook
Opportunities concentrate where end users face validation, throughput, or supply-risk constraints that commodity formats do not address. Viral-safety and sterility expectations in biologics and advanced therapies keep attention on higher-value filtration steps, including nanofiltration and integrity-test-enabled single-use assemblies. At the same time, miniaturized high-throughput screening supports accessory demand through microplate inserts and low-extractables syringe filters that protect analytical sensitivity. A key whitespace remains in nanoliter-scale and low-dead-volume filtration for organ-on-chip and scarce-sample workflows, where conventional syringe filters waste sample and can introduce binding losses.
Manufacturing localization and capacity additions offer a practical route for suppliers aiming to shorten lead times for compliance-grade membranes and capsules. Merck opened a EUR 150 million climate-neutral filter manufacturing facility in Cork, Ireland (September 2025) and also confirmed expansion at its Peenya, Bengaluru site with new production lines for filtration hardware and Pellicon 2 ultrafiltration cassettes (April 2026), supporting multi-region supply for labs and bioprocess-adjacent demand. Product innovation aimed at upstream clarification and perfusion intensification is also visible, including Asahi Kasei Life Science expanding its BioOptimal microfilter lineup with new UMP and UJP products (May 2026), which aligns with the shift toward higher-density cell culture and faster-turnaround single-use operations.
Recent Industry Developments in Laboratory Filtration Market
- June 2026: Danaher completed its acquisition of Masimo Corporation. While Masimo is anchored in monitoring and acute care, the combination broadens Danaher’s diagnostics footprint and can increase cross-selling leverage across regulated healthcare accounts that also procure lab consumables and workflow hardware.
- September 2025: Merck opened a EUR 150 million climate-neutral filter manufacturing facility in Blarney Business Park, Cork, Ireland. The site adds regional capacity for filtration products used in bioprocessing and laboratory workflows, supporting shorter lead times and supply assurance for customers managing lot-traceability and change-control requirements.
- March 2024: Merck introduced the Milliflip non-sterile vacuum-driven filtration unit for clarifying water, buffers, and other aqueous solutions. The launch expands ready-to-use vacuum filtration options in routine lab preparation, reinforcing pull-through for consumable filtration units in high-frequency QC and research workflows.


Laboratory Filtration Market Report Scope and Research Methodology
Market Definition and Coverage
For this study, the laboratory filtration market is defined as the value of filtration products and setups used inside labs to separate particles or microbes from liquids or gases during research, testing, and quality checks.
Scope exclusions: We exclude industrial process filtration, large building water or HVAC cartridge filters, and filtration systems sold mainly for commercial-scale manufacturing.
Segments Covered in This Report
- By Product Type
- Filtration Media
- Filtration Assemblies
- Filtration Accessories
- By Technique
- Microfiltration
- Ultrafiltration
- Nanofiltration & Reverse Osmosis
- Vacuum / Depth Filtration
- Others
- By End User
- Pharmaceutical & Biotechnology Companies
- Academic & Research Institutes
- Food & Beverage Testing Laboratories
- Environmental Testing Laboratories
- Others
- By Geography
- North America
- United States
- Canada
- Mexico
- Europe
- Germany
- United Kingdom
- France
- Italy
- Spain
- Rest of Europe
- Asia-Pacific
- China
- Japan
- India
- Australia
- South Korea
- Rest of Asia-Pacific
- Middle East & Africa
- GCC
- South Africa
- Rest of Middle East & Africa
- South America
- Brazil
- Argentina
- Rest of South America
- North America
Data Sources, Market Sizing, and Validation
Desk Research
Desk research starts by building a clean fact base on lab activity and regulated testing volumes, and then mapping it to filtration usage and pricing. We rely on public sources such as FDA databases and guidance documents, the US Census Bureau and Eurostat trade and production tables, UN Comtrade customs statistics, OECD health and science indicators, and peer-reviewed journals that report filtration methods and lab throughput.
To keep the dataset practical, we also review company annual reports, investor presentations, product brochures, and widely cited association websites for terminology and typical product lifecycles. In a few places, paid subscriptions are used for company financials and business intelligence, patent lookups, and shipment-level import and export checks when public data is too high level. This list is illustrative only, and many other sources were also consulted to collect data, validate assumptions, and clarify open questions.
Primary Interviews and Surveys
Primary work is used to confirm what the product mix looks like in real purchasing, and to test assumptions on replacement cycles, typical order sizes, and price movement for common filter formats. We speak with distributors, lab procurement teams, and technical specialists across major regions so that demand signals from life science, clinical, and academic labs can be cross-checked and then applied consistently in the model.
Distribution of primary research fieldwork respondents
| Company type | Respondent position | Region |
|---|---|---|
| Top tier: 36% | CXOs: 19% | APAC: 46% |
| Mid tier: 44% | Functional/Unit leaders: 38% | EMEA: 29% |
| Smaller Players: 20% | Managers: 43% | Americas: 25% |
Market-Sizing & Forecasting
The sizing model is built using top-down logic where laboratory activity indicators and trade flows are used to reconstruct the addressable spending pool for lab filtration, and then the totals are distributed by region based on observed lab intensity. To keep it grounded, the result is corroborated with selective bottom-up checks, such as sampled price per unit multiplied by estimated consumption volumes for common membrane filters, syringe filters, and vacuum filtration consumables.
Key inputs include public import and export values for relevant filtration consumables, trends in pharma and biotech R&D spending, growth in diagnostic testing volumes, lab water purity and sterility requirements, and typical replacement frequency for filtration media and assemblies. Where direct volume data is missing, we fill gaps using proxy ratios from interviews (for example, filters used per testing run) and then stress-test the implied prices against catalog ranges.
For forecasting, scenario analysis is used around lab funding cycles and biopharma pipeline activity, and the final trajectory is sanity-checked with expert expectations on price progression and adoption of higher-performance membranes.
Data Validation & Update Cycle
Validation is done through several checks so that one noisy data point does not drive the outcome. Outputs are compared against independent signals like trade totals, reported lab spending patterns, and the implied per-lab filtration cost, and any large variance triggers a deeper review of pricing or scope.
Before sign-off, the work goes through multi-step analyst reviews, and follow-up calls are made when interview feedback conflicts with the desk view. Reports are refreshed annually, and interim updates are made when material events affect demand, pricing, or supply. Right before delivery, a final pass is completed so clients receive the most current version available.
Mordor Intelligence's Laboratory Filtration Market Estimate Compared With Other Published Estimates
Published market sizes for laboratory filtration often differ because the product boundary is not always drawn the same way, and the data years are not aligned. It also matters whether a study prices the market using list prices, realized prices, or a blended view that accounts for channel discounts.
Import and export values for filtration consumables, combined with lab testing and R&D activity signals, are the evidence checks that keep Mordor Intelligence's 2026 estimate focused on filtration media, assemblies, and accessories used in research and diagnostic labs, without pulling in industrial process filtration demand. Differences usually come from scope creep into adjacent industrial categories, older base years that do not reflect recent pricing, and forecasts that assume either unusually fast adoption or unusually flat replacement cycles.
Benchmark comparison
| Source | Market Size | Gaps in Research Methodology |
|---|---|---|
| Mordor Intelligence | USD 5.01 B (2026) | |
| Industry Publisher A | USD 4.11 B (2024) | Uses an earlier base year and a longer forecast window, and the scope description is broader, so lab-only filtration spend can be mixed with adjacent equipment and application buckets that change the total. |
| Industry Publisher B | USD 3.60 B (2024) | Anchors the sizing to an older historical window and may rely on legacy segment definitions and pricing that understate recent growth in life science and clinical lab filtration demand. |
The spread in published values is mostly explained by year alignment and what gets counted as laboratory filtration versus adjacent filtration uses. Our approach keeps the total traceable to observable demand signals, realistic pricing logic, and repeatable validation checks, which makes the estimate easier to reconcile over time.


Key Questions Answered in the Report
How large is the laboratory filtration market today?
The laboratory filtration market size is USD 5.01 billion in 2026 and is projected to reach USD 7.58 billion by 2031, growing at an 8.63% CAGR.
Which product category is growing fastest within laboratory filtration?
Filtration Accessories, such as precision syringe filters and microplate inserts, are projected to rise at a 10.92% CAGR through 2031.
What is driving nanofiltration adoption in biopharma labs?
Stricter viral-safety guidance from regulators now requires an extra 20-nm polishing step before final formulation, making nanofiltration indispensable despite higher consumable costs.
Why are academic labs becoming important filtration customers?
National grant programs for pandemic preparedness and synthetic biology have funded new BSL-3 suites and pilot plants, boosting academic demand at a 12.51% CAGR.
Which region offers the highest growth potential for suppliers?
The Asia-Pacific region, led by China, India, South Korea, and Japan, is expected to expand at an 11.63% CAGR as dozens of biosimilar and cell-therapy facilities come online.
Page last updated on:





