Market Overview
| Study Period | 2018 - 2031 |
|---|---|
| Forecast Data Period | 2026 - 2031 |
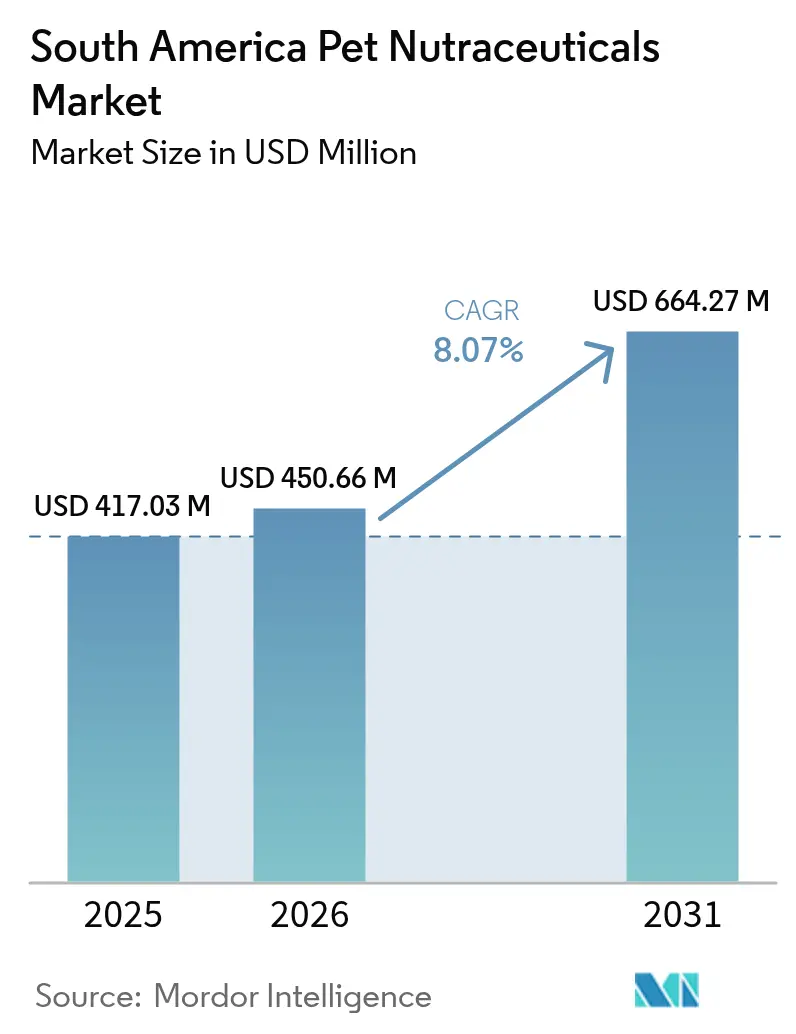
| Base Year Market Size (2025) | USD 417.03 Million |
| Market Size (2026) | USD 450.66 Million |
| Market Size (2031) | USD 664.27 Million |
| Growth Rate (2026 - 2031) | 8.07% CAGR |
| Market Concentration | Low |
Major Players*Disclaimer: Major Players sorted in no particular order Image © Mordor Intelligence. Reuse requires attribution under CC BY 4.0. | |
South America Pet Nutraceuticals Market Analysis by Mordor Intelligence
The South America pet nutraceutical market size is expected to grow from USD 417.03 million in 2025 to USD 450.66 million in 2026 and is forecast to reach USD 664.27 million by 2031 at 8.07% CAGR over 2026-2031. Rising pet humanization, robust companion-animal populations, and sustained veterinary endorsement of functional ingredients underpin the expansion. Brazil’s feed industry registered reasonable growth in 2024, with the pet food segment surpassing around 4% growth rate, confirming a solid nutritional base for premium supplements[1]Source: Sindirações, “Setor de Nutrição Animal Cresce 2,4% em 2024,” sindiracoes.org.br. Omega-3 fatty acids, probiotics, and soy-based hydrolysates gain momentum as owners seek preventive care solutions that mirror human wellness habits. Digital retail infrastructure continues to scale, improving access across South America’s vast geography and lowering last-mile costs. Meanwhile, dual oversight by MAPA (Ministry of Agriculture, Livestock, and Supply) and, where applicable, ANVISA (Brazilian Health Regulatory Agency) tightens quality standards, affording incumbents research and regulatory depth that provides distinct competitive advantages.
Key Report Takeaways
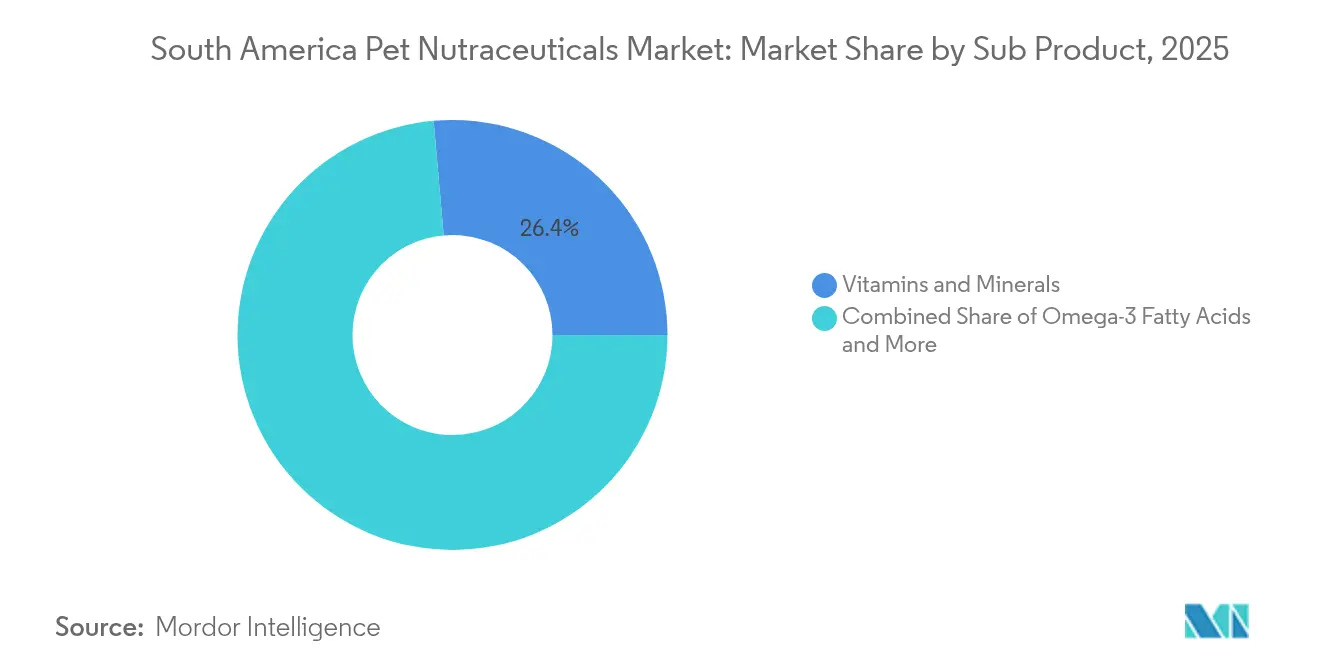
- By sub-product, vitamins and minerals accounted for 26.40% of the South America pet nutraceutical market share in 2025; omega-3 fatty acids are projected to expand at a 8.7% CAGR through 2031.
- By pet type, dogs led with 53.90% revenue share in 2025, while cats are forecast to post the highest 12.1% CAGR through 2031.
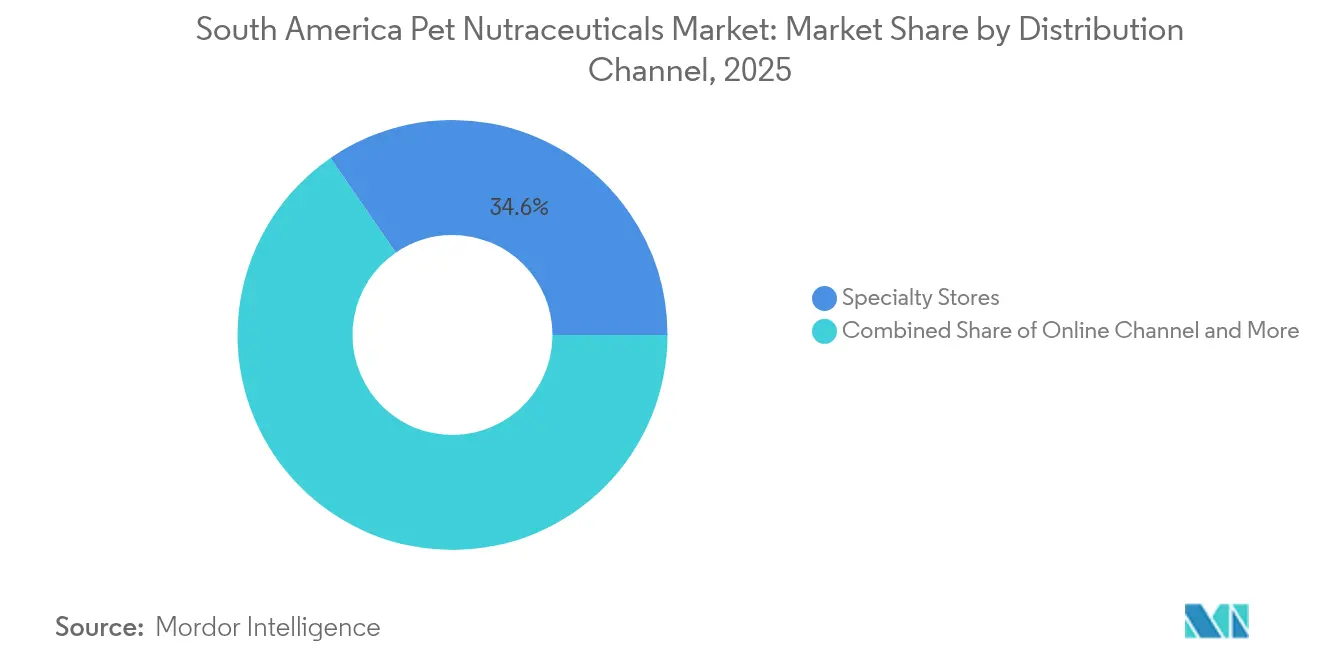
- By distribution channel, specialty stores held a 34.60% share of the South America pet nutraceutical market size in 2025; online channels are projected to record the fastest growth at a 9.1% CAGR through 2031.
- By geography, Brazil captured a 59.40% share in 2025, and Rest of South America exhibits the strongest 9.3% CAGR outlook to 2031.
Note: Market size and forecast figures in this report are generated using Mordor Intelligence’s proprietary estimation framework, updated with the latest available data and insights as of 2026.
South America Pet Nutraceuticals Market Trends and Insights
Drivers Impact Analysis*
| Driver | (~) % Impact on CAGR Forecast | Geographic Relevance | Impact Timeline |
|---|---|---|---|
| Humanization of pets spurring premium spending | +2.1% | Brazil core, Argentina emerging, spillover to Chile | Medium term (2-4 years) |
| Growing incidence of chronic diseases in pets | +1.8% | Urban centers across South America, concentrated in Brazil and Argentina | Long term (≥ 4 years) |
| Expansion of e-commerce pet-specialty channels | +1.4% | Brazil and Argentina are leading, with gradual adoption in smaller markets | Short term (≤ 2 years) |
| Regulatory approvals for functional ingredients | +1.2% | Brazil MAPA jurisdiction, Argentina SENASA framework | Medium term (2-4 years) |
| Soy protein hydrolysate demand for hypoallergenic formulas | +0.9% | Regional production hubs in Brazil and Argentina | Medium term (2-4 years) |
| Valorization of aquaculture by-products for cost-effective omega-3 | +0.7% | Coastal regions with aquaculture presence, primarily Chile and Brazil | Long term (≥ 4 years) |
| Source: Mordor Intelligence | |||
Humanization of Pets Spurring Premium Spending
Pet owners are increasingly treating dogs and cats like family, fueling their willingness to pay for clinically validated supplements. A 2024 BENEO survey found more than 50% of respondents ready to pay premium prices for ingredients with proven efficacy, while 75% linked gut health to overall well-being[2]Source: BENEO, “Pet Food Trends 2024,” beneo.com. Brazilian spending on companion-animal products hit BRL 75.4 billion (USD 12.7 billion) in 2024, with industrial pet food accounting for 54.1% of expenditures. Omega-3 oils and probiotic blends, therefore, enjoy rapid uptake as preventive solutions. Multinationals leverage in-house research to position functional blends as everyday health essentials rather than discretionary add-ons, driving repeat purchases across urban middle-income households.
Growing Incidence of Chronic Diseases in Pets
Longer lifespans and sedentary lifestyles in city settings have lifted obesity, diabetes, and degenerative joint conditions among pets. Veterinarians increasingly prescribe omega-3 fatty acids for cardiac support and glucosamine-chondroitin complexes for mobility. WSAVA notes that 90% of U.S. veterinarians already dispense nutraceuticals, setting a precedent that South America clinics are likely to emulate[3]Source: MAPA, “Ministério da Agricultura, Pecuária e Abastecimento,” mapa.gov.br. Rising chronic disease caseloads secure long-term demand for therapeutic supplements, especially in Brazil and Argentina where diagnostics are more advanced and pet insurance adoption is emerging.
Expansion of E-commerce Pet-Specialty Channels
Online marketplaces extend reach beyond major metros and enable direct education through videos, dosing calculators, and live veterinary chats. Mars Petcare’s USD 5.1 million distribution center, unveiled in January 2025, underpins nationwide next-day fulfillment and supports subscription programs for recurring supplement deliveries. Younger owners, accustomed to digital transactions, prefer detailed label scrutiny before purchase, favoring specialty supplements like probiotics that require thorough explanations. It forecasts online sales, therefore capturing both fresh-to-category buyers and migrating shoppers from brick-and-mortar outlets.
Regulatory Approvals for Functional Ingredients
MAPA and ANVISA co-review dossiers for novel additives, imposing stability data, clinical trial evidence, and manufacturing audits. Galam’s 2022 approval for sc-FOS established a transparent path, encouraging further innovation. Dual validation enhances consumer confidence and enables premium pricing while filtering out unsubstantiated products. Companies with in-house labs capitalize, translating scientific investments into early-mover advantage and stronger veterinary endorsements.
Restraints Impact Analysis*
| Restraint | (~) % Impact on CAGR Forecast | Geographic Relevance | Impact Timeline |
|---|---|---|---|
| High price sensitivity among mass consumers | -1.5% | Lower-income segments across South America, rural areas | Short term (≤ 2 years) |
| Limited veterinary endorsement due to scant clinical proof | -1.2% | Professional veterinary channels region-wide | Medium term (2-4 years) |
| Fragmented cold-chain logistics are hurting probiotic viability | -0.8% | Remote areas and smaller cities across South America | Long term (≥ 4 years) |
| Competition from home-made functional diets using local botanicals | -0.6% | Traditional communities, cost-conscious segments | Medium term (2-4 years) |
| Source: Mordor Intelligence | |||
High Price Sensitivity Among Mass Consumers
Economic pressures across South America create significant price sensitivity that limits nutraceutical adoption among mass-market pet owners, with BENEO's 2024 survey revealing that approximately 1 in 6 pet owners switched to lower-priced brands due to rising costs. This constraint particularly affects premium segments like specialized probiotics and omega-3 formulations, where manufacturing costs and clinical substantiation investments translate to higher retail prices. Mass consumers often prioritize basic nutrition over preventive healthcare supplements, limiting market penetration beyond affluent urban segments. The challenge intensifies in rural areas where veterinary access remains limited and traditional feeding practices dominate pet care decisions.
Limited Veterinary Endorsement Due to Scant Clinical Proof
Veterinary skepticism regarding the efficacy of nutraceuticals stems from inconsistent product quality and limited clinical evidence. Studies by the WSAVA (World Small Animal Veterinary Association) have revealed significant quality control issues across various supplement categories. Brazilian veterinary medicine labeling compliance studies found that the majority of products had regulatory issues, undermining professional confidence in supplement categories. Placebo effects in pain management studies have shown good response rates, complicating the clinical assessment of actual therapeutic benefits. These quality and efficacy concerns limit veterinary recommendations, reducing professional channel adoption that typically drives premium nutraceutical sales and consumer education.
*Our forecasts treat driver/restraint impacts as directional, not additive. The impact forecasts reflect baseline growth, mix effects, and variable interactions.
Segment Analysis
By Sub Product: Omega-3 Innovation Surges While Vitamins Anchor Volume
Vitamins and minerals retained a 26.40% share of the South America pet nutraceutical market in 2025, underscoring established veterinary acceptance and economies of scale. This foundational segment benefits from Brazil’s strong domestic manufacturing and standardized dosing protocols, ensuring steady reorder cycles. In contrast, omega-3 concentrates are projected to be the fastest-growing subcategory, with a 8.7% CAGR through 2031, driven by clinical evidence supporting cardiac care and cognitive support in aging pets. The South America pet nutraceutical market size for omega-3 products is forecast to expand significantly as aquaculture by-product valorization reduces input costs.
Second-generation omega-3 formulations with phospholipid delivery systems enhance bioavailability, differentiating premium brands. Probiotic blends trail due to cold-chain constraints, yet they enjoy rising gut health awareness, especially among urban dwellers managing stress-related digestive issues. Proteins and peptides, led by soy hydrolysates, address hypoallergenic diets and attract veterinarians treating atopic dermatitis. Milk bioactives and niche botanicals round out innovation pipelines but must overcome limited consumer familiarity and higher unit costs before scaling in the South America pet nutraceutical market.


By Pets: Feline Segment Accelerates Even as Canines Lead
The South America pet nutraceutical market size is primarily driven by dogs, accounting for a 53.90% share, rooted in decades-long ownership traditions and extensive veterinary service networks. Hip and joint formulas, dermal health chews, and dental sticks dominate canine supplement baskets, driven by demographic aging and mobility issues in large-breed dogs. Cats, though, are on a steeper 12.1% CAGR pathway as high-density apartment living reorients preferences toward smaller companion animals. Taurine fortification, urinary tract health powders, and anxiety-management treats are among the new feline-specific SKUs in the South America pet nutraceutical market.
Indoor lifestyles increase the risk of obesity among cats, thereby elevating demand for weight-control additives, such as L-carnitine. Proprietary hairball-reduction complexes built around omega-3 and fiber combinations also gain traction. Other pets, birds, rabbits, and exotics account for a small but growing share as specialty veterinarians expand across major metropolitan areas, highlighting micronutrient gaps unique to each species. This diversification offers white-space potential for agile manufacturers adept at micro-batch production.
By Distribution Channel: Specialty Stores Retain Leadership as Digital Surges
Specialty retailers held a 34.60% share of the South America pet nutraceutical market in 2025, leveraging trained staff and curated assortments to justify premium pricing. In-store veterinary kiosks and loyalty clinics foster credible consultation, anchoring the channel despite e-commerce disruption. Online sales are forecast to compound at a rate of 9.1% annually, fueled by Mars Petcare’s upgraded fulfillment infrastructure and smartphone penetration exceeding 80% in Brazil. The South America pet nutraceutical industry sees subscription models for monthly omega-3 refills and probiotic sachets lowering churn rates.
Supermarkets and hypermarkets maintain a broad reach but struggle to convey supplement differentiation amid fast-moving consumable goods, limiting basket penetration. Convenience stores capture impulse purchases, primarily vitamin chewables, which are often positioned near the checkout. Veterinary clinics remain critical for high-involvement items, such as prescription-grade joint supplements, although stock-keeping costs and reimbursement lags can deter deeper inventory. Collectively, channel evolution highlights the shift toward omnichannel strategies that integrate digital education with physical immediacy.
Geography Analysis
Brazil accounted for 59.40% of the South America pet nutraceutical market in 2025, supported by companion animals and a mature regulatory framework under MAPA oversight. Pet-food revenue growth is supported by industrialized products accounting for a significant percentage of spend, an indicator of deep trust in processed nutrition. Nestlé’s capital expenditures through 2025 earmark production upgrades and innovation labs to secure leadership in functional treats. São Paulo and Rio de Janeiro clinics routinely stock omega-3 and probiotic SKUs, and emerging middle-class cities such as Goiânia and Campinas are registering double-digit store openings, which widen retail access across the South America pet nutraceutical market.
Argentina is anticipated to represent impressive CAGR growth through 2030, driven by domestic feed demand. Modern pet boutiques are prevalent in Buenos Aires, while Rosario and Córdoba utilize e-commerce warehouses to shorten delivery times. SENASA works to align ingredient approvals with MERCOSUR standards; investors nonetheless monitor export tax bands that could pinch margins. Local firms pilot goat–milk–based bioactives targeting sensitive felines, carving out distinct niches within the South America pet nutraceutical industry.
The Rest of South America exhibits the strongest 9.3% CAGR outlook to 2031, including Chile, Colombia, Peru, and smaller markets, accounts for the remainder, but it also shows vibrant pockets of opportunity. Chile leverages its extensive salmon sector to commercialize EPA-rich oils, feeding value-added exports into Brazilian and U.S. pet food chains. Colombia’s rising middle class powers specialty store expansion in Bogotá and Medellín, while Peru experiments with native quinoa peptides for hypoallergenic dog treats. Infrastructure gaps most acute in Amazon-bordering regions still hinder the integrity of probiotic cold chains, yet government broadband grants promise to extend online reach and advance the South America pet nutraceutical market.
Competitive Landscape
The South America pet nutraceutical market exhibits a fragmented structure. Nestlé Purina holds a significant share of the pet care revenue and channels proprietary ingredients, such as FortiFlora probiotics, into regional SKUs. Mars Incorporated accelerates omnichannel growth with its Brazilian logistics hub, enabling two-day shipping to 14 states and supporting automated subscription refills. Kemin Nutrisurance inaugurated an innovation center in 2024 to localize functional ingredient blends, reinforcing supply-side agility and easing MAPA dossier submissions.
Regional specialists, such as Well Vet Supplements, cultivate veterinarian partnerships by offering white-label joint formulas co-branded with clinic logos to boost practitioner loyalty. Chilean processor BioOmega capitalizes on fish-oil expertise to supply concentrated DHA to premium feline lines. Meanwhile, Argentine upstart NutraPet targets export clients with soy hydrolysate-based products compliant with North American allergen standards. Intellectual property barriers remain modest, yet regulatory proficiency and cold-chain infrastructure differentiate top-tier players within the South America pet nutraceutical market.
Rising merger and acquisition activity underscores the need for strategic realignment. Multinationals pursue bolt-on deals to secure niche technologies, encapsulation, synbiotic stacks, or adaptogenic botanicals, thereby accelerating time-to-market. Counterpositioned, agile startups exploit direct-to-consumer channels to demonstrate concept traction before courting bigger suitors. The competitive equilibrium, therefore, tilts toward firms that pair scientific validation with scalable logistics and omnichannel reach.
South America Pet Nutraceuticals Industry Leaders
ADM
Alltech
Mars Incorporated
Nestle (Purina)
Vetoquinol
- *Disclaimer: Major Players sorted in no particular order


Recent Industry Developments
- April 2024: The Argentine pet food sector reported serving over 19 million pets with 1.05 million metric tons of domestic demand, while developing export capabilities that position the country as a regional production hub. This market development creates opportunities for the integration of nutraceuticals and the positioning of premium products.
- January 2023: Mars Incorporated partnered with the Broad Institute to create an open-access database of dog and cat genomes to advance preventive pet care. It is aimed at developing more effective precision medicines and diets that lead to scientific breakthroughs for the future of pet health.
- January 2023: Wellness Pet Company Inc., a subsidiary of Clearlake Capital Group LP, launched a fresh range of supplements designed for dogs, which prioritize providing daily health advantages to promote overall well-being. These products help meet the proactive approach of pet parents for long-term health and well-being.


South America Pet Nutraceuticals Market Report Scope
Milk Bioactives, Omega-3 Fatty Acids, Probiotics, Proteins and Peptides, Vitamins and Minerals are covered as segments by Sub Product. Cats, Dogs are covered as segments by Pets. Convenience Stores, Online Channel, Specialty Stores, Supermarkets/Hypermarkets are covered as segments by Distribution Channel. Argentina, Brazil are covered as segments by Country.Sub Product
| Milk Bioactives |
| Omega-3 Fatty Acids |
| Probiotics |
| Proteins and Peptides |
| Vitamins and Minerals |
| Other Nutraceuticals |
Pets
| Cats |
| Dogs |
| Other Pets |
Distribution Channel
| Convenience Stores |
| Online Channel |
| Specialty Stores |
| Supermarkets/Hypermarkets |
| Other Channels |
Geography
| Brazil |
| Argentina |
| Rest of South America |
| Sub Product | Milk Bioactives |
| Omega-3 Fatty Acids | |
| Probiotics | |
| Proteins and Peptides | |
| Vitamins and Minerals | |
| Other Nutraceuticals | |
| Pets | Cats |
| Dogs | |
| Other Pets | |
| Distribution Channel | Convenience Stores |
| Online Channel | |
| Specialty Stores | |
| Supermarkets/Hypermarkets | |
| Other Channels | |
| Geography | Brazil |
| Argentina | |
| Rest of South America |


Market Definition
- FUNCTIONS - Pet foods are usually intended to provide complete and balanced nutrition to the pet but are primarily used as functional products. The scope includes the food and supplements consumed by pets including veterinary diets. Supplements/nutraceuticals that are directly supplied to pets are considered within the scope.
- RESELLERS - Companies engaged in reselling of pet food without value addition have been excluded from the market scope, in order to avoid double counting.
- END CONSUMERS - Pet owners are considered to be the end-consumers in the market studied.
- DISTRIBUTION CHANNELS - Supermarkets/hypermarkets, specialty stores, convenience stores, online channels and other channels are considered within the scope. The stores which are exclusively providing pet related basic and custom products are considered within the scope of specialty stores.
| Keyword | Definition |
|---|---|
| Pet Food | The scope of pet food includes the food that is eatable by pets including food, treats, veterinary diets, and nutraceuticals/supplements. |
| Food | Food is animal feed intended for consumption by pets. It is formulated to provide essential nutrients and meet the dietary needs of various types of pets, including dogs, cats, and other animals. These are generally segmented into dry and wet pet foods. |
| Dry Pet Food | Dry pet foods may be extruded/baked (kibbles) or flaked. They have a lower moisture content, typically around 12-20%. |
| Wet Pet Food | Wet pet food, also known as canned pet food or moist pet food, generally has a higher moisture content compared to dry pet food, often ranging from 70-80%. |
| Kibbles | Kibbles are dry, processed pet food in small, bite-sized pieces or pellets. They are specifically formulated to provide balanced nutrition for various domestic animals, such as dogs, cats, and other animals. |
| Treats | Pet Treats are special food items or rewards given to pets, to show affection, and encourage good behavior. They are especially used during training. Pet treats are made from various combinations of meat or meat-derived materials with other ingredients. |
| Dental Treats | Pet dental treats are specialized treats that are formulated to promote good oral hygiene in pets. |
| Crunchy Treats | It is a type of pet treat that has a firm and crispy texture which can be a good source of nutrition for pets. |
| Soft and chewy treats | Soft and Chewy pet treats are a type of pet food product that is formulated to be easy to chewy and digest. They are usually made from soft and pliable ingredients, such as meat, poultry, or vegetables, that have been blended and formed into bite-sized pieces or strips. |
| Freeze-dried & Jerky Treats | Freeze-dried and jerky treats are snacks given to pets, that are prepared through a special preservation process, without damaging the nutritional content, resulting in long-lasting, nutrient-rich treats. |
| Urinary Tract Disease Diets | These are commercial diets that are specifically formulated to promote urinary health and reduce the risk of urinary tract infections and other urinary problems. |
| Renal Diets | These are specialized pet foods formulated to support the health of pets with kidney disease or renal insufficiency. |
| Digestive Sensitivity Diets | Digestive-sensitive diets are specially formulated to meet the nutritional needs of pets with digestive issues such as food intolerances, allergies, and sensitivities. These diets are designed to be easily digestible and to reduce the symptoms of digestive problems in pets. |
| Oral Care Diets | Oral care diets for pets are specially formulated diets produced to promote oral health and hygiene in pets. |
| Grain-Free Pet Food | Pet food that does not contain common grains like wheat, corn, or soy. Grain-free diets are often preferred by pet owners seeking alternative options or if their pets have specific dietary sensitivities. |
| Premium Pet Food | High-quality pet food formulated with superior ingredients often offers additional nutritional benefits compared to standard pet food. |
| Natural Pet Food | Pet food made from natural ingredients, with minimal processing and without artificial preservatives. |
| Organic Pet Food | Pet food is produced using organic ingredients, free from synthetic pesticides, hormones, and genetically modified organisms (GMOs). |
| Extrusion | A manufacturing process used to produce dry pet food, where ingredients are cooked, mixed, and shaped under high pressure and temperature. |
| Other Pets | Other pets include birds, fish, rabbits, hamsters, ferrets, and reptiles. |
| Palatability | The taste, texture, and aroma of pet food influence its appeal and acceptance by pets. |
| Complete and Balanced Pet Food | Pet food that provides all essential nutrients in appropriate proportions to meet the nutritional needs of pets without additional supplementation. |
| Preservatives | These are the substances that are added to pet food to extend its shelf life and prevent spoilage. |
| Nutraceuticals | Food products that offer health benefits beyond basic nutrition, often contain bioactive compounds with potential therapeutic effects. |
| Probiotics | Live beneficial bacteria that promote a healthy balance of gut flora, supporting digestive health and immune function in pets. |
| Antioxidants | Compounds that help neutralize harmful free radicals in the body, promoting cellular health and supporting the immune system in pets. |
| Shelf-Life | The duration of which pet food remains safe and nutritionally viable for consumption after its production date. |
| Prescription diet | Specialized pet food formulated to address specific medical conditions under veterinary supervision. |
| Allergen | A substance that can cause allergic reactions in some pets, leading to food allergies or sensitivities. |
| Canned food | Wet pet food that is packed in cans and contains higher moisture content than dry food. |
| Limited ingredient diet (LID) | Pet food formulated with a reduced number of ingredients to minimize potential allergens. |
| Guaranteed Analysis | The minimum or maximum levels of certain nutrients present in pet food. |
| Weight management | Pet food designed to help pets maintain a healthy weight or support weight loss efforts. |
| Other Nutraceuticals | It includes prebiotics, antioxidants, digestive fiber, enzymes, essential oils and herbs. |
| Other Veterinary Diets | It includes weight management diets, skin and coat health, cardiac care, and joint care. |
| Other Treats | It includes rawhides, mineral blocks, lickables, and catnips. |
| Other Dry Foods | It includes cereal flakes, mixers, meal toppers, freeze-dried foods, and air-dried foods. |
| Other Animals | It includes birds, fish, reptiles, and small animals (rabbits, ferrets, hamsters). |
| Other Distribution Channels | It includes veterinary clinics, local unregulated stores, and feed and farm stores. |
| Proteins and Peptides | Proteins are large molecules composed of basic units called amino acids which help in the growth and development of pets. Peptides are the short string of 2 to 50 amino acids. |
| Omega-3 fatty acids | Omega-3 fatty acids are essential polyunsaturated fats that play a crucial role in the overall health and well-being of Pets |
| Vitamins | Vitamins are the essential organic compounds that are essential for vital physiological functioning. |
| Minerals | Minerals are naturally occurring inorganic substances that are essential for various physiological functions in pets. |
| CKD | Chronic Kidney Disease |
| DHA | Docosahexaenoic Acid |
| EPA | Eicosapentaenoic Acid |
| ALA | Alpha-linolenic Acid |
| BHA | Butylated Hydroxyanisol |
| BHT | Butylated Hydroxytoluene |
| FLUTD | Feline Lower Urinary Tract Disease |


Research Methodology
Mordor Intelligence follows a four-step methodology in all our reports.
- Step-1: IDENTIFY KEY VARIABLES: In order to build a robust forecasting methodology, the variables and factors identified in Step-1 are tested against available historical market numbers. Through an iterative process, the variables required for market forecast are set and the model is built on the basis of these variables.
- Step-2: Build a Market Model: Market-size estimations for the forecast years are in nominal terms. Inflation is not a part of the pricing, and the average selling price (ASP) is kept constant throughout the forecast period.
- Step-3: Validate and Finalize: In this important step, all market numbers, variables and analyst calls are validated through an extensive network of primary research experts from the market studied. The respondents are selected across levels and functions to generate a holistic picture of the market studied.
- Step-4: Research Outputs: Syndicated Reports, Custom Consulting Assignments, Databases & Subscription Platforms


