
Market Overview
| Study Period | 2021 - 2031 |
|---|---|
| Forecast Data Period | 2026 - 2031 |
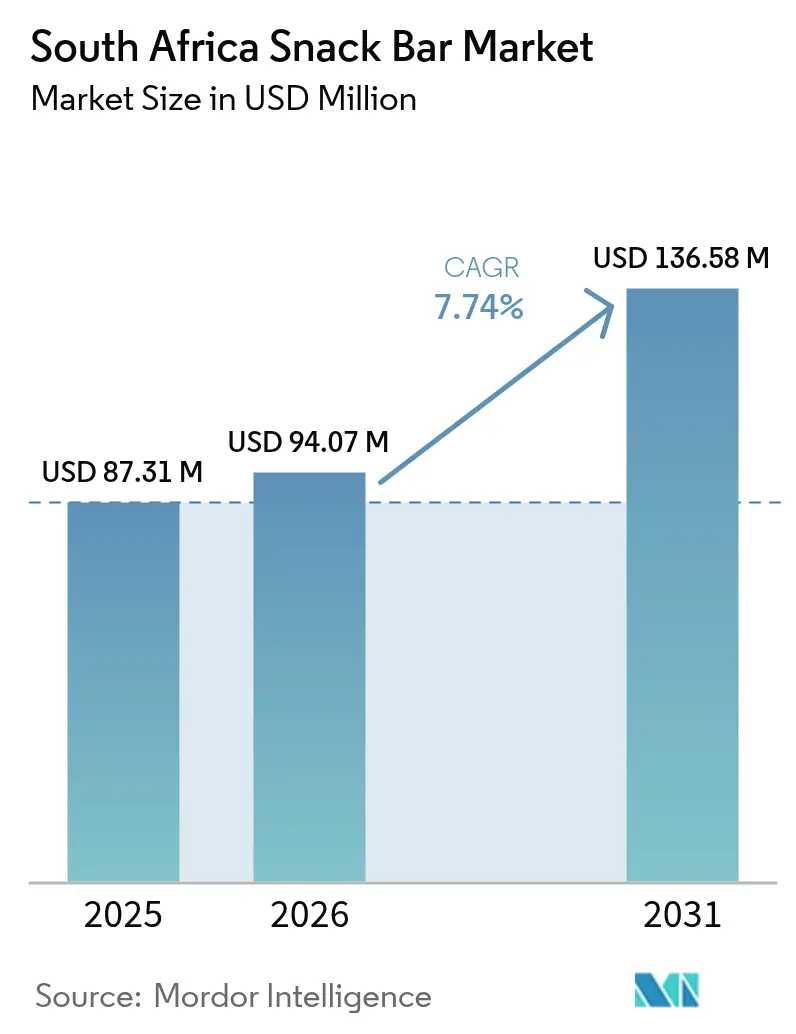
| Base Year Market Size (2025) | USD 87.31 Million |
| Market Size (2026) | USD 94.07 Million |
| Market Size (2031) | USD 136.58 Million |
| Growth Rate (2026 - 2031) | 7.74 % |
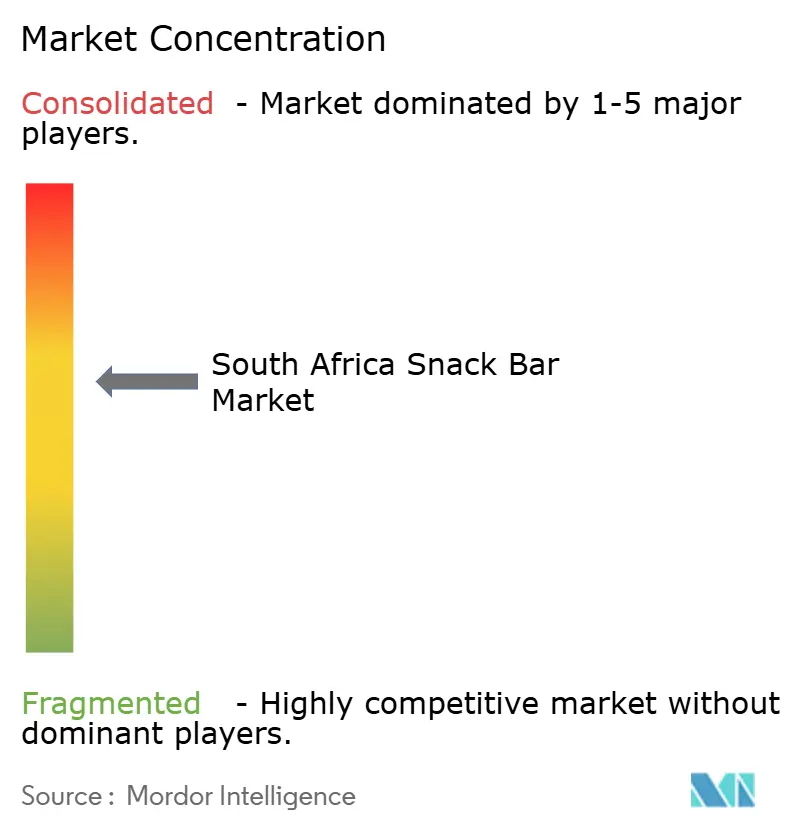
| Market Concentration | Medium |
Major Players
*Disclaimer: Major Players sorted in no particular order Image © Mordor Intelligence. Reuse requires attribution under CC BY 4.0. |
|
South Africa Snack Bar Market Analysis by Mordor Intelligence
The South African snack bar market size in 2026 is estimated at USD 94.07 million, growing from 2025 value of USD 87.31 million with 2031 projections showing USD 136.58 million, growing at 7.74% CAGR over 2026-2031. Urban consumers' demand for portable nutrition, swift e-commerce adoption, and government incentives favoring reduced-sugar formulations have allowed the market to navigate macro-economic pressures adeptly. The competitive landscape, featuring both multinationals and nimble home-grown brands, leans towards product localization, highlighting bars infused with baobab, marula, and other native superfoods. These indigenous ingredients not only cater to local tastes but also align with the growing global trend of incorporating superfoods into daily diets, enhancing the appeal of such products. Collectively, these dynamics position the South African snack bar market for both volume growth and value premiumization across all price tiers, as manufacturers continue to innovate and adapt to evolving consumer preferences.
Key Report Takeaways
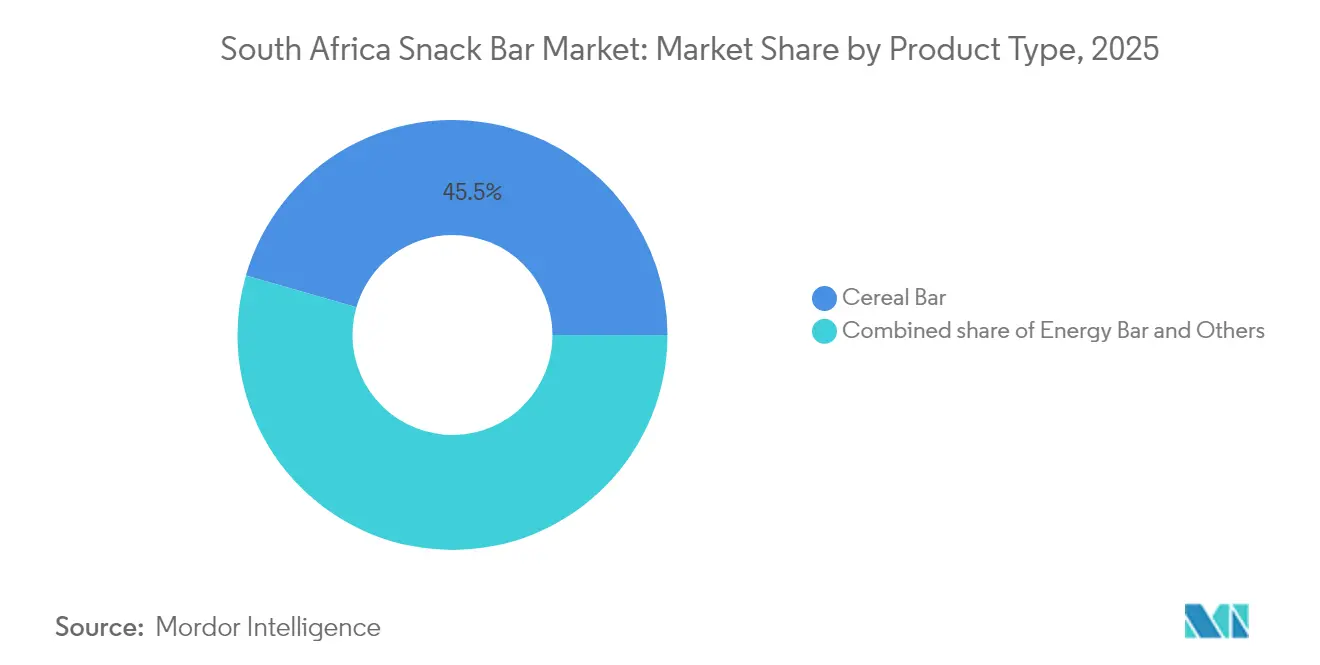
- By product type, cereal bars held 45.54% of South Africa snack bar market share in 2025, whereas energy bars are forecast to post the fastest 8.29% CAGR from 2026 to 2031.
- By category, conventional products accounted for 78.55% of South Africa snack bar market size in 2025, while free-from alternatives are expected to expand at an 8.55% CAGR through 2031 .
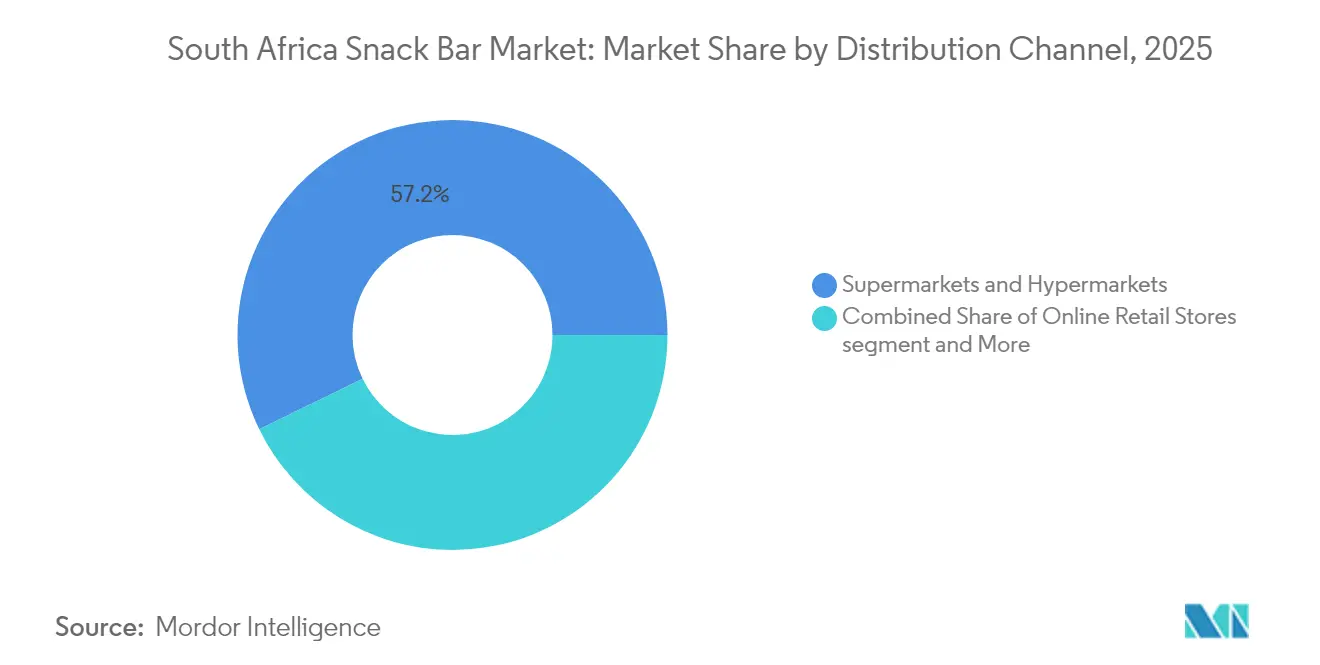
- By distribution channel, supermarkets and hypermarkets commanded 57.22% share of the South Africa snack bar market size in 2025, yet online retail is projected to advance at an 8.12% CAGR between 2026 and 2031.
Note: Market size and forecast figures in this report are generated using Mordor Intelligence’s proprietary estimation framework, updated with the latest available data and insights as of 2026.
South Africa Snack Bar Market Trends and Insights
Drivers Impact Analysis*
| Driver | (~)% Impact on CAGR Forecast | Geographic Relevance | Impact Timeline |
|---|---|---|---|
| Rising health-conscious consumers | +1.2% | Urban Gauteng, Western Cape | Medium term (2-4 years) |
| Urban lifestyles reshaping breakfast habits | +0.9% | Johannesburg, Cape Town, Durban | Short term (≤ 2 years) |
| Expansion of modern retail and e-commerce | +1.1% | Major metropolitan areas | Medium term (2-4 years) |
| Growing sports-nutrition culture | +0.8% | Gyms and township fitness hubs | Long term (≥ 4 years) |
| Sugar-tax-led low-sugar innovation | +0.7% | Nationwide | Short term (≤ 2 years) |
| Differentiation via local superfoods | +0.5% | National, with export upside | Long term (≥ 4 years) |
| Source: Mordor Intelligence | |||
Rising health-conscious consumers
In response to rising diabetes rates and the government's Health Promotion Levy, snack bar manufacturers are cutting back on sucrose and exploring fruit-based sweeteners. The levy, which amassed ZAR 5.8 billion in its initial two years, underscores its significant behavioral impact by encouraging healthier consumption patterns. Anticipating potential tax extensions, brands are proactively introducing low-sugar SKUs and prominently highlighting glycemic credentials on their packaging to appeal to health-conscious consumers. At the same time, 3.7 million households facing food access challenges are on the lookout for affordable, nutrient-rich snacks, making value-priced cereal bars a staple in their diets. By incorporating baobab and marula, brands not only infuse local micronutrients, which support immune health and energy levels, but also reduce ingredient transportation distances. This approach aligns health advantages with a resilient supply chain, ensuring sustainability and cost-effectiveness in production.
Urban lifestyles reshaping breakfast habits
In Johannesburg, where the average commute stretches beyond 45 minutes, breakfast routines are being reshaped, with a noticeable pivot towards grab-and-go cereal bars. This shift is driven by the need for convenience and time efficiency among commuters. Frequent power outages further deter residents from traditional stovetop cooking, prompting them to stock up on shelf-stable bars as a reliable source of morning sustenance, especially during load-shedding hours. Major grocers, through loyalty programs, are driving repeat purchases, particularly as points accumulate on healthier options, incentivizing consumers to make consistent choices. Additionally, the rise of smartphone-facilitated mobile commerce has made it possible for commuters to restock their snack supplies on the go, seamlessly integrating snack bar consumption into their daily routines and even extending it into new dayparts. This evolving behavior not only fuels consistent revenue streams but also equips brand owners to navigate fluctuations in commodity costs, ensuring sustained profitability in a dynamic market environment.
Expansion of modern retail and e-commerce
Snack bars have emerged as one of the top five items in online shopping carts, largely due to their favorable weight-to-value ratio, which optimizes courier service efficiency and reduces shipping costs. Shopper confidence is reinforced by secure payment systems, in line with the Protection of Personal Information Act, ensuring the safety of sensitive customer data. Meanwhile, nationwide Black Friday promotions have led to significant spikes in online sales of snack bars, with many retailers reporting double-digit growth during these events. In response, retailers are innovating with temperature-controlled last-mile solutions, ensuring chocolate-coated snack bars remain intact and maintain quality during South Africa's sweltering summers. This online channel not only boosts sales but also offers snack bar manufacturers a buffer against risks from sporadic store closures caused by power outages or civil unrest, ensuring business continuity and market reach.
Growing sports-nutrition culture
In 2024, urban centers witnessed an 11% surge in gym memberships, while township fitness programs gained traction, fueled by social media challenges. This growing focus on fitness and health has significantly influenced consumer preferences, driving demand for convenient and nutritious snack options. Energy bars, riding this lifestyle wave, boasted an impressive 8.63% CAGR, outpacing the broader South African snack bar market. Thanks to the country's status as Africa's largest maize producer, domestic maize supplies are now the backbone of cost-effective plant protein bases, diminishing the nation's reliance on imported whey and lowering production costs for manufacturers. Retail chains are strategically placing performance-oriented bars next to isotonic beverages, bolstering cross-category merchandising and encouraging impulse purchases. For many aspirational consumers, protein bars have evolved into symbols of self-improvement commitment, driving repeat purchases despite wider inflationary pressures. This trend highlights the growing alignment between consumer aspirations and product positioning in the South African market.
Restraints Impact Analysis*
| Restraint | (~)% Impact on CAGR Forecast | Geographic Relevance | Impact Timeline |
|---|---|---|---|
| Prices of nuts and cereals are volatile | -1.0% | National, with supply chain impacts from neighboring countries | Short term (≤ 2 years) |
| Healthy snacks face stiff competition | -0.8% | Urban markets with high brand density | Medium term (2-4 years) |
| Production disrupted by load-shedding | -1.2% | Manufacturing hubs: Gauteng, KwaZulu-Natal | Short term (≤ 2 years) |
| High inflation is curbing demand for premium products | -0.9% | National, with acute impact on lower-income households | Medium term (2-4 years) |
| Source: Mordor Intelligence | |||
Prices of nuts and cereals are volatile
In 2024, rotational blackouts stretched beyond 280 days, significantly disrupting bar lines that rely on continuous extrusion processes. To address these challenges, manufacturers began stockpiling both raw materials and finished goods, which resulted in a rise in warehousing overheads by as much as 12%. Larger players managed to mitigate the impact of outages by investing in solar arrays or deploying diesel generators, ensuring minimal disruption to their operations. However, smaller firms faced greater difficulties, often resorting to renting additional capacity or operating night shifts during off-peak hours to sustain production. The poultry sector's decision to cull 10 million day-old chicks highlights the cascading effects of a disrupted cold chain, which can severely impact various food categories, including meat, dairy, and frozen products. Although grid upgrades have been promised, the implementation timeline remains uncertain, making contingency plans essential for maintaining on-shelf product availability and minimizing supply chain disruptions.
High inflation is curbing demand for premium products
In June 2025, food inflation surged to a 15-month peak of 5.1%, elevating the average household's grocery bill to ZAR 5,466.59[1]Source: Statistics South Africa, "Inflation up on higher food prices," statssa.gov.za. This sharp rise in food prices placed a significant financial strain on consumers, as wage growth failed to keep pace with inflation. Consequently, households adjusted their spending habits, opting for budget-friendly cereal bars over more expensive, high-protein options to manage their constrained disposable income. Input costs also rose sharply: maize meal prices jumped by 10.1%, while beef experienced an even steeper increase of 21.2%, both of which directly impacted the cost of ingredients used in cereal bars. Retailers attempted to mitigate the impact on consumers by freezing prices on their house brands, but this strategy intensified margin pressures on branded suppliers, who faced rising production costs. Meanwhile, a proposed expansion of zero-rated foods could potentially ease these cost burdens for consumers and suppliers alike. However, until such measures are enacted, demand for premium products is expected to remain subdued, as shoppers continue to prioritize affordability over premium offerings.
*Our forecasts treat driver/restraint impacts as directional, not additive. The impact forecasts reflect baseline growth, mix effects, and variable interactions.
Segment Analysis
By Product Type: Energy Bars Drive Performance Nutrition
In 2025, cereal bars dominated South Africa's snack bar market, accounting for a 45.54% share. Their popularity is rooted in consumer habits, with many opting for cereal bars as a quick and affordable breakfast alternative. South Africa, being the continent's leading maize producer, offers manufacturers a cost-effective edge, especially with grain-based formulations. A projected 14.56 million tonne commercial maize crop in 2025, marking a 4.65% rise from prior levels, promises a steady supply for cereal bar production, bolstering consistent growth. Yet, these bars grapple with a 3.8% inflation in cereal product prices, squeezing manufacturing margins. Nonetheless, their affordability and resonance with mainstream breakfast needs fortify their market leadership, cementing cereal bars as the cornerstone of South Africa's snack bar scene.
Conversely, energy bars are the market's rising star, set to grow at an impressive 8.29% CAGR through 2031. This surge is fueled by a heightened consumer emphasis on functional nutrition and performance-oriented snacking. Unlike their cereal counterparts, energy bars tout a premium status, commanding higher prices by spotlighting benefits tied to sports performance and an active lifestyle. Notably, their appeal transcends the traditional gym-goer, as a broader swath of South Africans embraces wellness and health-centric routines. While currently holding a smaller market share, energy bars' unique positioning enables manufacturers to attract consumers prioritizing functionality and health benefits over cost. This premium stance, coupled with a widening consumer base, indicates energy bars are poised to significantly influence South Africa's snack bar competitive landscape.



By Category: Free-From Alternatives Gain Momentum
In 2025, conventional snack bars command a dominant 78.55% share of the South African market. Their stronghold is attributed to well-established supply chains and a consumer base that has long favored traditional ingredients such as oats and peanuts. These bars, easily accessible and competitively priced, resonate especially in rural and township areas where cost is a primary concern. However, they face challenges from commodity price fluctuations, which can squeeze margins during turbulent market conditions. Meanwhile, indigenous African crops, recognized for their potential as food sources, offer natural ingredient alternatives. These not only bolster a 'free-from' positioning but also diminish reliance on imports. Despite these challenges, conventional bars see strong unit sales through supermarkets and mass retailers, expanding their demographic appeal. As urbanization advances and retail channels evolve, the steadfast popularity of conventional snack bars highlights their essential role in the daily diets of South Africans.
Conversely, "free-from" snack bars—encompassing gluten-free, vegan, and low-sugar varieties, are on the brink of a rapid ascent, with projections indicating a robust CAGR of 8.55%. This momentum is largely driven by urban millennials becoming increasingly attuned to diet-specific choices. The growth of this segment is propelled by consumers gravitating towards products that align with evolving health and lifestyle paradigms, further endorsed by reputable entities like the Heart & Stroke Foundation. Emphasizing wellness and carving out a unique market position, these "free-from" offerings frequently come with a premium price tag and have successfully built trust, particularly in urban centers. Retailers are now dedicating "wellness corridors" in their spaces, amplifying the visibility and appeal of these alternative bars. While rising input costs challenge profitability, innovation and targeted niche marketing enable "free-from" bars to effectively engage a rapidly expanding health-conscious demographic. As the market landscape shifts, conventional bars might retain their lead in unit share, but the allure of alternative options is undeniably on the rise among South Africa's diverse snack bar enthusiasts.
By Distribution Channel: Digital Commerce Transforms Access
In 2025, South Africa's snack bar market saw supermarkets and hypermarkets commanding a significant 57.22% share of total sales. This dominance is largely fueled by impulse purchases, especially for products strategically positioned near checkout counters. Established retail chains, with their vast geographic reach and robust distribution networks, serve as the primary access point for mainstream brands. Their physical presence not only fosters trust but also enhances brand recognition, benefiting both established and new snack bar varieties. Even with the rising competition from digital platforms, supermarkets remain the preferred choice for many consumers, thanks to their convenience and ingrained shopping habits. This stronghold cements their role as the backbone of the distribution ecosystem, even as the market gradually leans towards online channels.
Online retail is on the fast track, with projections indicating a robust 8.12% CAGR growth rate through 2031. Driving this surge is the increasing trend of internet shopping, highlighted by the fact that 66% of South African internet users have turned to digital platforms for their FMCG purchases. Traditional retailers, by introducing click-and-collect services and same-day deliveries, have blurred the lines between online and offline shopping, crafting a hybrid shopping experience. Interestingly, e-commerce has found an unexpected ally in load-shedding; many households now prefer delivery times that sidestep power outages. Subscription-based snack box bundles, which come with discounts, not only boost customer loyalty but also help in reducing churn, ensuring a steady demand. Digital platforms are also leveling the playing field, allowing smaller brands, often priced out of expensive supermarket shelf spaces, to compete effectively. This evolving landscape suggests that while supermarkets may lead in sales volumes today, online channels are poised for significant growth in the future.
Geography Analysis
Gauteng, Western Cape, and KwaZulu-Natal provinces dominate South Africa's snack bar market, together accounting for over 60% of sales. These regions, characterized by high urban density, widespread supermarket presence, and higher disposable incomes, provide an ideal environment for premium snack bars, especially those emphasizing protein content or specialty ingredients. Additionally, the consistent rollout of fiber-optic networks in these areas has boosted online grocery shopping, contributing to an 8.12% CAGR in digital snack bar distribution.
Conversely, the Eastern Cape and Limpopo show a stronger inclination towards value. Due to lower income elasticities, conventional cereal bars dominate, and the penetration of specialty "free-from" bars is still in its infancy. However, these provinces are rich in agricultural assets like marula, sorghum, and baobab, which could serve as local supply bases for manufacturers aiming for cost advantages. As the South African snack bar market grows, this integration could lead to shared economic benefits.
There's also potential in cross-border trade. Thanks to South Africa's involvement in the African Continental Free Trade Area, exporters targeting Botswana and Namibia benefit from simplified tariff structures. Notably, these two nations already import 35% of their snack bars from South Africa. Furthermore, improved logistics through the N4 highway are shortening lead times, establishing Gauteng factories as key regional supply hubs. Over the coming years, disparities in provincial uptake are expected to narrow as infrastructure, income levels, and digital access become more uniformly distributed.
Regulatory Landscape
Snack bars in South Africa fall under the National Department of Health (NDoH), Directorate: Food Control, implemented through the Foodstuffs, Cosmetics and Disinfectants Act, 1972 (Act No. 54 of 1972). Core compliance areas include ingredient safety, additive use, hygiene controls, and labeling and advertising requirements, with labeling governed by Regulations relating to the labelling and advertising of foodstuffs (R146), which is referenced for pack claims and communication formats.
Municipal Health Services enforce food safety requirements at the premises level, including monitoring compliance documentation such as the Certificate of Acceptability. Beyond general retail, the Department of Basic Education issued updated Guidelines for Tuck Shop Operators, Service Providers and School Vendors (February 2025), restricting the sale of processed snacks high in sugar, fat, and sodium in school environments, which affects how manufacturers formulate and position snack bars for school-adjacent channels.
Competitive Landscape
In South Africa's snack bar market, competition remains moderate, with the top five players commanding just over 60% of the category's value, as indicated by a concentration score of 6. Multinational giants like Nestlé, Kellogg, and General Mills leverage global formulation expertise and established distribution contracts to secure prime shelf space. In contrast, domestic players such as Tiger Brands harness local ingredient sourcing and brand legacy. A case in point is Tiger's ZAR 300 million peanut butter facility, boasting a capacity of 1 million bottles monthly, allowing them to price competitively and cater to local flavor preferences.
Retailer private labels, like Pick'n Pay’s Smart Choice bars, are intensifying the competition. In 2025, Smart Choice introduced two gluten-free SKUs, undercutting branded counterparts by 18%. Additionally, firms that proactively invested in rooftop solar to combat load-shedding have gained a competitive edge, ensuring steady production and availability, which in turn fosters retailer loyalty. On another front, performance-nutrition brands are tapping into influencer marketing on platforms like Instagram and TikTok, cultivating community ties without the burden of substantial advertising costs, thus broadening market access.
The landscape is also witnessing a transformation through strategic mergers and acquisitions. The USD 35.9 billion Mars-Kellanova merger, poised for regulatory nods in early 2025, hints at potential supply-chain efficiencies and cross-promotional opportunities spanning both confectionery and snack bar domains. Once greenlit, the expanded entity might fast-track the introduction of energy-dense bars tailored for African climates, leveraging Kellanova’s established local operations. Furthermore, as major players eye incremental market share in South Africa's snack bar arena, they may turn their gaze towards smaller innovators as potential acquisition targets.
South Africa Snack Bar Industry Leaders
-
Nestle SA
-
Mondelez International Inc.
-
Ultimate Sports Nutrition (USN)
-
Kellonova
-
Tiger Brands Ltd.
- *Disclaimer: Major Players sorted in no particular order

Market Opportunities and Future Outlook
Product and pack strategies that fit affordability and high-frequency purchase behavior create white space in commuter, forecourt, and traditional trade routes, where small-format items can expand penetration. Mondelez International (Cadbury) expanding a low-price, small-format Dairy Milk unit in 2026 signals how major FMCG players are using value-point offerings to reach spaza shops and commuter corridors. Snack bar brands can draw from the same approach through price-marked packs, multipacks, and retailer-funded promotions.
Function-led innovation is also moving beyond specialist sports channels into more mainstream availability, supported by collaborations that combine brand equity with established cold-chain and distribution. Ultimate Sports Nutrition (USN) partnering with Clover during 2026 to launch and extend protein-focused ready-to-drink offerings shows an adjacent, scalable route for performance-nutrition propositions and cross-merchandising with bars in pharmacies, gyms, and modern retail. At the same time, regulatory pressure on sugar and broader labeling scrutiny sustain demand for low-sugar and free-from bars that can compete for shelf space in retailer wellness corridors, while staying aligned with R146 labeling and advertising requirements.
Recent Industry Developments
- July 2026: Cadbury (Mondelez International Inc.) expanded its 12g Cadbury Dairy Milk bar nationally in South Africa after a 2025 pilot, targeting traditional trade, spaza shops, and commuter routes. The expansion supports small-format, low price-point impulse strategies that can lift basket add-ons in high-traffic channels. It also raises the competitive bar for value-led snacking propositions that compete for the same checkout and on-the-go occasions as snack bars.
- May 2026: Ultimate Sports Nutrition (USN) announced a multi-product collaboration with Clover spanning new and co-branded performance nutrition offerings, including BlueLab 100% Whey (with Super M flavours) and IsoZero (Tropika flavour). The tie-up expands access to sports nutrition by pairing USN brand demand with Clover manufacturing and distribution reach. This extends adjacent-category ecosystems where protein bars and functional snacks can gain shared retail placement and bundled promotions.
- April 2024: FULFIL launched chocolate protein bars in four flavors (Salted Caramel, Peanut and Caramel, Hazelnut Whip, and Chocolate Brownie) and placed them in national retailers including SPAR and Clicks. The rollout increased competitive intensity in premium, low-sugar protein bars by combining indulgent taste cues with functional positioning. Wider availability in pharmacy and grocery formats also supported cross-channel trial beyond specialist sports outlets.


Research Methodology Framework and Report Scope
Market Definition and Coverage
This market covers packaged snack bars sold in South Africa and measured in value at the consumer-facing level across retail and online channels. Snack bars include bar-shaped products made from cereals, fruits, nuts, and similar ingredients, positioned for quick snacking, energy, or added protein.
Scope exclusions: We exclude unpackaged homemade bars and foodservice-only preparations that are not sold as packaged retail products.
Segmentation Overview
-
Product Type
- Cereal Bars
- Energy Bars
- Other Snack Bars
-
By Category
- Free From
- Conventional
-
By Distribution Channel
- Supermarkets/Hypermarkets
- Convenience Stores
- Online Retail Stores
- Other Distribution Channels
Data Sources, Market Sizing, and Validation
Desk Research
Desk research began by aligning the product boundary and demand context using public references, and then mapping how snack bars move through retail in South Africa. We typically review sources such as Statistics South Africa releases, South African Revenue Service trade statistics, South African Department of Health publications (for labeling and nutrition signals), and South African Bureau of Standards updates, along with peer-reviewed nutrition journals that discuss snack patterns.
To keep the model realistic, we also use manufacturer websites, annual reports, investor presentations, and reputed press coverage to understand launches, pack sizes, and channel expansion. Where needed, paid database subscriptions are used for company financials and news screening, and an import/export shipment-level dataset is used to sense cross-border flows for relevant packaged foods. These sources are not exhaustive, and we also used other public references to collect data, validate assumptions, and clarify open questions.
Primary Interviews and Surveys
Primary work focused on validating what sells, where it sells, and how price and promotions shift the value pool through the year for South African snack bars. We spoke with a mix of manufacturers, distributors, retailers, and category specialists across key provinces, and then used their inputs to close gaps around channel splits, price ladders, and the pace of premium and better-for-you claims.
Distribution of primary research fieldwork respondents
| Company type | Respondent position |
|---|---|
| Top tier: 28% | CXOs: 14% |
| Mid tier: 58% | Functional/Unit leaders: 33% |
| Smaller Players: 14% | Managers: 53% |
Market-Sizing & Forecasting
Sizing is built using a top-down and bottom-up approach, where national consumption and retail sell-through signals are reconstructed for South Africa, and then translated into value using realistic price points by bar type and channel. To keep results grounded, totals are corroborated with selective bottom-up approximations such as sampled shelf prices multiplied by reasonable velocity ranges, followed by distributor and retailer sense checks on how volumes split by channel.
Key model inputs include average selling price movement by pack size and bar positioning, the share of sales through supermarkets/hypermarkets and convenience stores versus online retail, promotional depth during peak shopping periods, shifts in demand for energy and protein-led bars, and the pace of new launches and reformulations linked to nutrition labeling discussions. Where an input cannot be observed directly, the gap is handled through bounded assumptions agreed during interviews and then re-tested against alternative price and volume ranges.
For forecasting, scenario analysis is applied around pricing and channel mix, then supported by a simple multivariate regression layer that links category growth to household spending signals and modern trade expansion indicators. The final forecast is reviewed against what respondents expect for price progression and distribution gains over the next few years.
Data Validation & Update Cycle
Outputs are checked against independent signals such as observed shelf prices, promotion calendars, and the implied per-capita spend range that would result from the calculated totals. When numbers look out of line, we re-check unit conversions, category inclusions, and channel splits, and then re-contact selected respondents to confirm what changed and why.
Before sign-off, the work goes through multi-step analyst review so arithmetic, currency handling, and assumptions stay consistent across the time series. Reports refresh annually, with interim updates when material events occur such as sharp currency swings or major distribution resets. Right before delivery, a fresh pass is completed so clients receive the latest updated view.
Mordor Intelligence's South Africa Snack Bar Market Size Compared With Other Published Estimates
It is common to see different published market sizes for snack bars in South Africa because the category can be defined narrowly or broadly, and pricing can be treated in several reasonable ways. Differences also show up when some studies use a single-year average exchange rate, or when promotion-heavy months are blended with regular months without adjustments.
A refresh-led gap is frequent in this market because pack sizes, promotional intensity, and input cost pressure can shift quickly, which then changes realized average selling prices even if volumes move slowly. When currency timing and in-year ASP checks are re-validated during updates, the value line can move, and this is one practical reason figures from Mordor Intelligence may diverge from estimates built on older pricing snapshots or wider snack definitions.
Benchmark comparison
| Source | Market Size | Gaps in Research Methodology |
|---|---|---|
| Mordor Intelligence | USD 87.31 M (2025) | |
| Global Consultancy A | USD 300.00 M (2024) | The estimate appears to use a broader definition and an earlier base year, and the total may be influenced by different exchange-rate timing and a less detailed adjustment for promotional pricing effects on ASPs. |
| Industry Publisher B | USD 187.40 M (2026) | The value is anchored to a later year and a different growth path, and it likely reflects alternate inclusion rules across bar formats plus a separate method for applying price escalation through the forecast window. |
Across the three figures, the spread mainly comes from scope inclusions, how promotions and pack sizes are translated into ASPs, and which currency conversion timing is applied. By keeping the sizing steps traceable to channel behavior and repeatable price assumptions, the final number is easier to explain and refresh when conditions change.


Key Questions Answered in the Report
What is the current value of the South Africa snack bar market?
The market is valued at USD 94.07 million in 2026 and is forecast to reach USD 136.58 million by 2031.
Which product segment is growing fastest?
Energy bars are projected to grow at an 8.29% CAGR between 2026 and 2031, the quickest pace among all segments.
How dominant are supermarkets in distribution?
Supermarkets and hypermarkets held 57.22% of 2025 sales, but online channels are closing the gap with an 8.12% forecast CAGR.
Are free-from snack bars gaining traction?
Yes, free-from products are advancing at an 8.55% CAGR, significantly outpacing conventional variants as health awareness climbs.
Page last updated on:


 Your data is secure and never sold or shared.



