Market Overview
| Study Period | 2021 - 2031 |
|---|---|
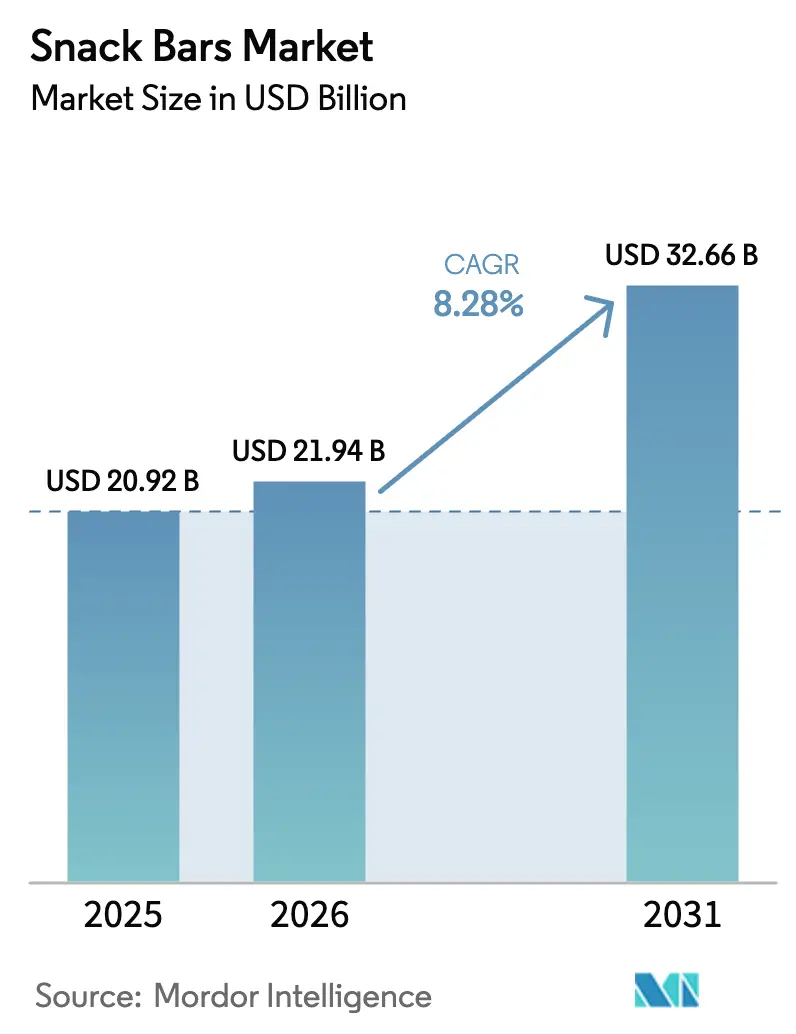
| Market Size (2026) | USD 21.94 Billion |
| Market Size (2031) | USD 32.66 Billion |
| Growth Rate (2026 - 2031) | 8.28% CAGR |
| Fastest Growing Market | Asia Pacific |
| Largest Market | North America |
| Market Concentration | Medium |
Major Players*Disclaimer: Major Players sorted in no particular order Image © Mordor Intelligence. Reuse requires attribution under CC BY 4.0. | |
Snack Bars Market Analysis by Mordor Intelligence
The snack bars market size is expected to grow from USD 20.92 billion in 2025 to USD 21.94 billion in 2026 and is forecast to reach USD 32.66 billion by 2031 at 8.28% CAGR over 2026-2031. As consumers increasingly prioritize convenience and nutrition, portable snack formats are overtaking traditional packaged options, seamlessly fitting into commutes, school routines, and workout schedules. Highlighting the industry's potential, Mars made headlines with its USD 35.9 billion acquisition of Kellanova in 2025, signaling a strategic pivot as major players hedge against waning sales in confectionery and biscuits. With the U.S. Food and Drug Administration tightening its “Healthy” claim standards, set to kick in April 2025, and Europe's Nutri-Score labeling gaining traction, there's a notable shift. Brands are investing heavily in reformulating recipes, leaning towards lower-sugar and higher-protein compositions. However, challenges loom. Rising supply pressures on pea, whey, and rice protein isolates are squeezing gross margins. In response, manufacturers are either locking in long-term contracts or diversifying their protein sources.
Key Report Takeaways
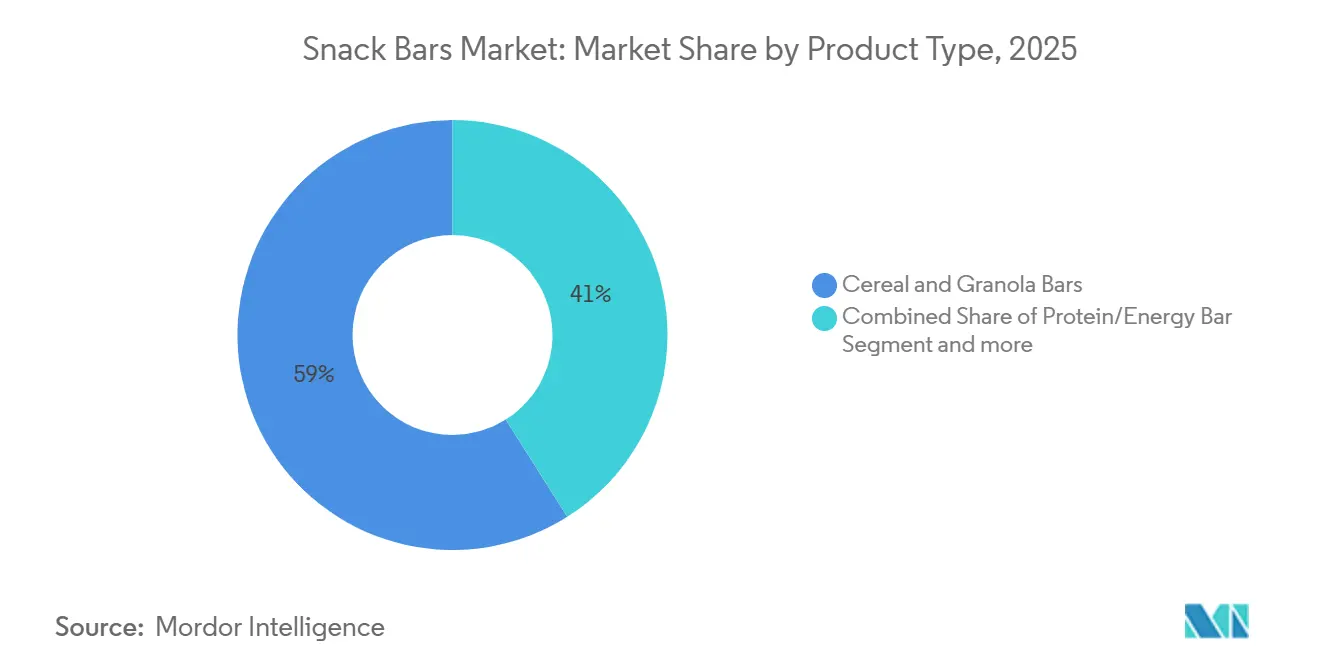
- By product type, cereal and granola bars led with 58.96% of snack bars market share in 2025, while protein and energy bars are advancing at a 9.80% CAGR through 2031.
- By nature, conventional formulations accounted for 82.74% of the snack bars market size in 2025, but organic variants are expanding at a 10.93% CAGR through 2031.
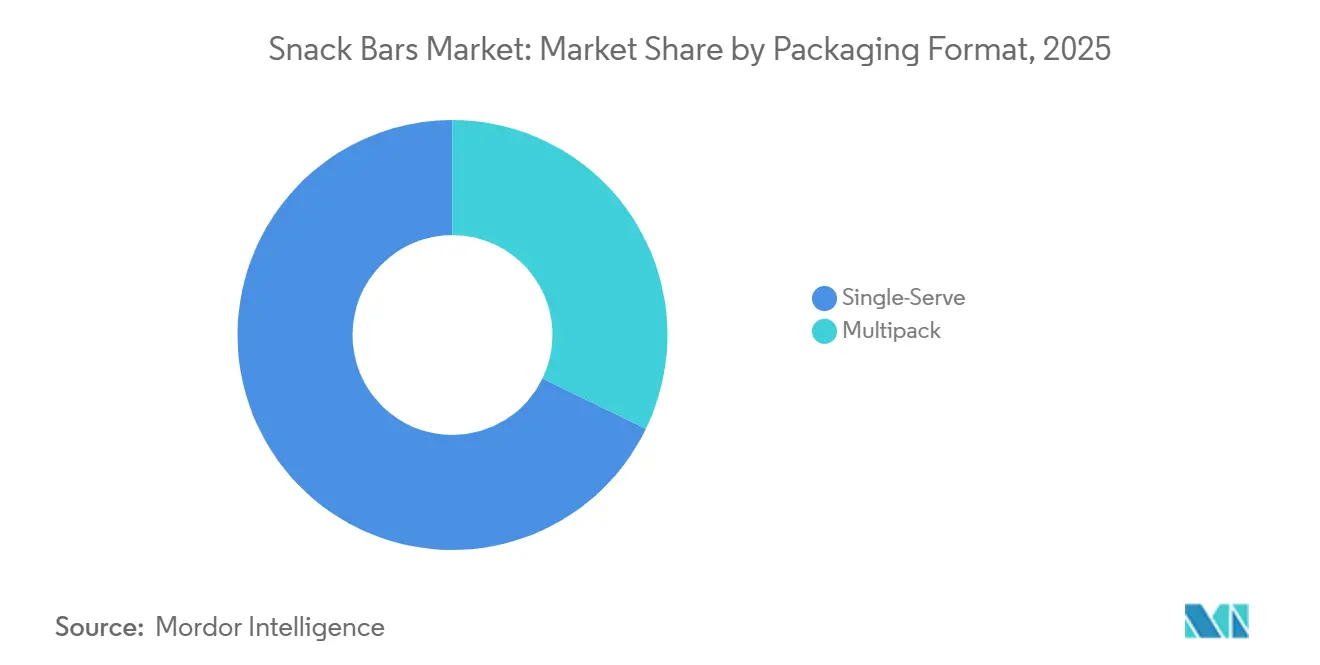
- By packaging format, single-serve SKUs captured 67.82% revenue in 2025, whereas multipacks are projected to grow at a 9.78% CAGR to 2031.
- By distribution channel, supermarkets and hypermarkets commanded 57.57% revenue in 2025; online retail is registering the fastest 11.01% CAGR through 2031.
- By geography, North America represented 45.43% of 2025 sales, while Asia-Pacific is forecast to accelerate at a 9.56% CAGR up to 2031.
Note: Market size and forecast figures in this report are generated using Mordor Intelligence’s proprietary estimation framework, updated with the latest available data and insights as of January 2026.
Global Snack Bars Market Trends and Insights
Drivers Impact Analysis*
| Driver | (~) % Impact on CAGR Forecast | Geographic Relevance | Impact Timeline |
|---|---|---|---|
| Growing demand for convenient on-the-go nutrition | +1.8% | Global, with peak intensity in North America, Europe, and urban Asia-Pacific | Medium term (2-4 years) |
| Rising health and wellness consciousness | +1.5% | Global, strongest in North America and Europe, accelerating in Asia-Pacific | Long term (≥ 4 years) |
| Product innovation in flavors and functional ingredients | +1.3% | Global, led by North America and Europe, will spill over to the Asia-Pacific | Medium term (2-4 years) |
| Expansion in emerging economies' modern retail | +1.2% | Asia-Pacific core, Latin America, Middle East and Africa | Long term (≥ 4 years) |
| Upcycling of food waste into snack-bar ingredients | +0.7% | North America and Europe, early adoption in select Asia-Pacific markets | Long term (≥ 4 years) |
| Corporate wellness programs distribute snack bars | +0.5% | North America and Europe, nascent in the Asia-Pacific | Medium term (2-4 years) |
| Source: Mordor Intelligence | |||


Growing demand for convenient on-the-go nutrition
As urbanization accelerates and commutes lengthen, consumers are gravitating towards portable meal formats that provide satiety without the need for cutlery or refrigeration. In 2024, General Mills introduced Nature Valley PACKED Sustained Energy Bars, crafted with slow-digesting carbohydrates and plant-based protein, specifically targeting morning commuters and afternoon office workers. This product, a blend of oats, nuts, and seeds with minimal added sugars, meets the Food and Drug Administration's revised "Healthy" claim standards, strategically positioning the brand for prime shelf space in health-focused retailers. This move also addresses the declining consumption of breakfast cereals, with households increasingly opting for grab-and-go bars that deliver similar fiber and protein benefits.
Rising health and wellness consciousness
With unprecedented rigor, consumers are now scrutinizing ingredient lists and macronutrient profiles. They increasingly favor bars that offer functional benefits, such as protein for muscle recovery, fiber for digestive health, and adaptogens for stress management, over those that merely indulge with empty calories. In January 2025, Kellanova rolled out Special K Protein Bars in the UK. Each bar boasts 10 grams of protein per serving and is free from artificial sweeteners, catering to both post-workout snacking and mid-afternoon energy slumps. This launch highlights a significant trend: legacy brands, once focused solely on taste and convenience, are now reformulating their products to align with the nutritional standards demanded by a younger, health-conscious audience. This shift is particularly pronounced in Europe, where front-of-pack Nutri-Score labels penalize high sugar and saturated fat content. As a result, manufacturers are compelled to optimize their formulations or face the risk of being delisted from retail shelves.
Product innovation in flavors and functional ingredients
To stand out in crowded retail aisles, manufacturers are turning to exotic fruits, botanical extracts, and functional add-ins, driven by flavor fatigue and ingredient monotony. In 2024, PepsiCo's RXBAR Plant debuted a fully plant-based bar, blending pea protein with almond butter. This move targets flexitarian consumers desiring animal-free protein without compromising on taste or texture. The innovation signals a strategic wager: plant-based claims could fetch a premium price and resonate with younger shoppers who value environmental sustainability. In a parallel trend, smaller brands are infusing adaptogens, such as ashwagandha, reishi, and lion's mane, into their bars, positioning them as tools for stress relief and blurring the lines between snacks and supplements.
Expansion in emerging economies' modern retail
Across Asia-Pacific, Latin America, and the Middle East, modern retail formats, like supermarkets, hypermarkets, and convenience stores, are on the rise. This expansion is opening new distribution channels for branded snack bars, which were once limited to specialty health-food outlets. In India, while organized retail penetration hovers below 15%, chains like Reliance Retail and DMart are rapidly expanding. They're introducing packaged nutrition bars to middle-class households, who traditionally favored sweets and fried snacks. This trend is especially evident in Tier 2 and Tier 3 cities. Here, rising disposable incomes and a growing awareness of Western wellness trends are sparking interest in protein bars, granola bars, and fruit-nut blends. Meanwhile, in Latin America, countries like Brazil, Mexico, and Colombia are seeing a surge in modern retail space, bolstered by foreign direct investments from global retailers.
Restraints Impact Analysis*
| Restraint | (~) % Impact on CAGR Forecast | Geographic Relevance | Impact Timeline |
|---|---|---|---|
| Sugar-content concerns and tightening regulations | -0.9% | Global, most acute in Europe and North America | Short term (≤ 2 years) |
| Price pressure from intense brand competition | -0.6% | Global, particularly in mature markets with high SKU proliferation | Medium term (2-4 years) |
| Supply chain strain for specialty protein isolates | -0.5% | Global, with acute shortages in pea and whey protein | Short term (≤ 2 years) |
| Shelf-space saturation in mature markets | -0.4% | North America and Europe | Medium term (2-4 years) |
| Source: Mordor Intelligence | |||
Sugar-content concerns and tightening regulations
Public health advocates and regulators are ramping up their scrutiny of added sugars in packaged foods. They're pressuring manufacturers to reformulate their products or risk facing consumer backlash and potential delisting from retail shelves. The Food and Drug Administration's updated "Healthy" claim, set to take effect on April 28, 2025, imposes a cap of 2.5 grams of added sugars per serving for snack bars[1]Source: U.S. FDA, “Definition and Labeling of ‘Healthy’ Claim,” fda.gov. This new limit disqualifies many legacy products that traditionally use honey, cane sugar, or chocolate coatings to offset the bitterness of protein isolates and fiber. As a result of this regulatory shift, brands are now compelled to invest in alternative sweetening systems like allulose, monk fruit, and stevia. These alternatives promise a similar taste profile without causing glycemic spikes. Meanwhile, Europe's Nutri-Score labeling system, which assigns color-coded grades based on sugar, saturated fat, and sodium content, is already penalizing high-sugar bars. These bars are receiving "D" or "E" ratings, diminishing their allure to health-conscious consumers.
Price pressure from intense brand competition
In North America and Europe, where retailers hold substantial bargaining power, the proliferation of shelf space and the rise of private-label competitors are squeezing gross margins. Supermarkets and hypermarkets are broadening their own-brand snack-bar offerings, using advantages in sourcing and marketing to price their products 20% to 30% lower than national brands. This trend is especially evident in the UK and Germany, where discount chains like Aldi and Lidl have secured double-digit shares of the grocery market by providing quality bars at entry-level prices. In response, national brands are ramping up promotional efforts, like buy-one-get-one-free deals and coupon campaigns, strategies that not only diminish their profitability but also condition consumers to expect discounts instead of paying full price.
*Our forecasts treat driver/restraint impacts as directional, not additive. The impact forecasts reflect baseline growth, mix effects, and variable interactions.
Segment Analysis
By Product Type: Protein Bars Reshape Nutrition Expectations
Forecasts indicate that Protein and Energy Bars will see an annual growth rate of 9.80% through 2031, surpassing the 58.96% market share held by Cereal and Granola Bars in 2025. This trend underscores a significant shift in consumer perceptions: bars are evolving from mere carbohydrate sources to multifunctional tools aiding muscle recovery, appetite control, and sustained energy. In 2024, General Mills debuted Wheaties Protein and Cheerios Protein bars, showcasing how traditional cereal brands are tapping into their nostalgic appeal. They're targeting aging Millennials and Gen Xers, who fondly remember these breakfast staples. Meanwhile, Fruit and Nut or Seed Bars strike a balance, catering to those who value whole-food ingredients and minimal processing over strict macronutrient goals.
While Cereal and Granola Bars enjoy dominance thanks to established distribution channels, competitive pricing, and widespread age appeal, their growth is slowing. This deceleration is attributed to younger consumers gravitating towards protein-centric options. In a bid to adapt, Kellanova introduced Nutri-Grain Power-Fulls Soft Baked Oat Bites in 2024, infusing protein and cutting sugar, all while preserving the signature soft-baked texture that has long defined the Nutri-Grain brand. This move highlights a strategic pivot: rather than launching new protein brands that could overshadow their existing lineup, established players are reformulating core products to safeguard their market share.


By Nature: Organic Premiumization Gains Traction
Organic snack bars are set to grow at a rate of 10.93% through 2031, nearly doubling the pace of their conventional counterparts, which commanded a dominant 82.74% share of the 2025 revenue. This surge is largely fueled by consumers in Europe and North America, who equate organic certification with top-tier ingredient quality, eco-friendliness, and a lack of synthetic pesticides. In response, retailers are not only broadening their organic offerings but are also strategically placing these items at eye level, targeting health-conscious shoppers. These consumers are often ready to shell out a 30% to 50% premium over traditional products. Regulatory seals like the United States Department of Agriculture Organic and EU Organic play a pivotal role, offering consumers a safety net against unverified "natural" claims.
While conventional bars continue to lead, thanks to their affordability, extensive distribution, and mainstream appeal, where taste and convenience often overshadow certification, this dominance is being challenged. As production scales up, costs for organic ingredients like oats, nuts, and dried fruits are on the decline. Furthermore, manufacturers are now securing organic certifications for entire production lines, moving away from the previous model of small batch runs. Clif Bar, a trailblazer in the organic realm, has upheld its certification since day one, proving that with the right supply chain design for traceability and compliance, organic branding can thrive even in mass-market arenas.
By Packaging Format: Multipacks Capture Household Bulk Buyers
In 2025, single-serve packaging dominated sales with a 67.82% share, highlighting the impulse-buying behavior at convenience stores, vending machines, and checkout lanes, where consumers often grab a bar for on-the-spot consumption. Meanwhile, multipack formats are witnessing a robust growth rate of 9.78%. This surge is largely attributed to e-commerce subscriptions, memberships at warehouse clubs, and the trend of stocking household pantries. Programs like Amazon's Subscribe and Save, which provide discounts ranging from 5% to 15% on regular deliveries, have conditioned consumers to buy snack bars in bulk. This not only cuts down on per-unit costs but also ensures a steady supply at home, in car glove compartments, and even in gym bags. Notably, this trend is especially evident among families with school-age children and fitness enthusiasts who consume multiple bars weekly.
The growing popularity of multipacks also serves as a strategic maneuver against escalating distribution costs. For instance, shipping a box of 12 bars yields higher revenue per transaction compared to sending out individual bars. This not only boosts logistics efficiency but also minimizes the carbon footprint for each unit sold. In response to consumer cravings for variety, brands are rolling out variety packs that combine multiple flavors in one box. This approach satisfies the demand for novelty while sparing retailers from the hassle of stocking numerous individual SKUs. A case in point is KIND LLC's variety packs, featuring a blend of dark chocolate, almond butter, and fruit-nut mixes. These have emerged as bestsellers on platforms like Amazon and in warehouse clubs, underscoring the potential of flavor assortment in driving both trial and repeat purchases.
By Distribution Channel: E-Commerce Disrupts Traditional Retail
Online retail is set to outpace all distribution channels, projected to grow at an impressive rate of 11.01% through 2031. This surge is largely attributed to the evolving landscape of consumer purchasing, driven by direct-to-consumer models, subscription services, and dynamic marketplace platforms. In 2025, supermarkets and hypermarkets commanded a dominant 57.57% share of sales. However, their growth faces hurdles: shelf-space saturation, the burden of slotting fees, and the necessity to share margins with wholesalers and retailers. In contrast, e-commerce sidesteps these intermediaries. This not only empowers brands to retain full retail margins but also grants them access to invaluable first-party data. Insights into purchase frequency, flavor preferences, and price sensitivity pave the way for personalized marketing, targeted promotions, and product development, all attuned to real-time consumer feedback.
Convenience stores play a pivotal role in catering to impulse purchases and immediate consumption, especially in urban locales and transit corridors where speed trumps selection. Specialty stores, encompassing health-food retailers, supplement shops, and fitness studios, target niche audiences. These consumers are often willing to pay a premium for curated selections and expert advice. Yet, as e-commerce emerges with similar selections and the allure of home delivery, the collective footprint of these specialty stores is dwindling. The COVID-19 pandemic acted as a catalyst in this transition. Many consumers, introduced to online snack bar purchases during lockdowns, have since continued the trend, drawn by convenience, competitive pricing, and the luxury of comparing nutritional information across brands without the usual time constraints.
Geography Analysis
In 2025, North America secured 45.43% of global revenues, buoyed by its established retail infrastructure and affluent consumers who prioritize functional snacking. The Food and Drug Administration's updated "Healthy" claim, effective in 2025, is hastening reformulations, benefiting brands that already champion low-sugar standards. While Canada aligns with this guidance, Mexico's burgeoning convenience store network is introducing branded bars to a fresh audience. As U.S. private labels start to mirror national-brand nutrition profiles, competitive intensity surges, exerting downward pressure on prices. Despite saturation concerns, heightened regional consumer education on protein intake fortifies premium positioning, bolstering the snack bars market.
Europe prioritizes organic and clean labels, with Nutri-Score influencing buying decisions. The UK, Germany, France, and the Netherlands, driven by heightened health consciousness and meticulous ingredient scrutiny, lead in per-capita consumption[2]Source: European Commission, “Nutri-Score and Front-of-Pack Labeling,” europa.eu. Kellanova's Special K Protein Bars, aligning with front-of-pack standards, resonate with health-conscious shoppers. While Southern European markets, starting from a modest base, are buoyed by retail chain expansions and cross-border e-commerce, European manufacturers are investing in recyclable wrappers. This move, while adding costs, aligns with Green Deal packaging directives and bolsters sustainability credentials in the snack bars arena.
Asia-Pacific is set to chart a robust 9.56% CAGR through 2031, marking it as the fastest-growing region. Factors like urbanization, increasing disposable incomes, and the proliferation of convenience stores in China, India, and Southeast Asia are enhancing bar accessibility. In Japan and South Korea, the aging demographic is gravitating towards protein-rich snacks for muscle upkeep. Meanwhile, in India's Tier-2 and Tier-3 cities, snack bars are gaining traction as coveted Western commodities. Chinese social commerce, leveraging influencers for livestreamed bar tastings, is driving spontaneous purchases. Local brands are also tapping into indigenous flavors like matcha, black sesame, and jackfruit, further broadening their appeal. These trends are significantly amplifying the snack bars market in these burgeoning economies.
Competitive Landscape
In the snack bars market, a handful of players dominate, with General Mills, Mars-Kellanova, Mondelēz, PepsiCo, and Nestlé commanding a significant share of the revenue. In 2025, Mars made headlines with its USD 35.9 billion acquisition of Kellanova, merging expertise in confectionery and cereal bars. This move not only scales up manufacturing but also boosts leverage with retailers. Meanwhile, PepsiCo's strategic USD 1.2 billion acquisition of Siete Foods marks its foray into the realm of grain-free, plant-based snacks, underscoring a preference for authentic niche offerings over building from scratch. Such consolidations bolster their bargaining power with ingredient suppliers, providing a buffer against rising protein-isolate costs.
Emerging disruptors carve out niches, championing allergen-free, keto, or upcycled ingredients, and resonating with a discerning consumer base. Brands selling directly to consumers harness first-party data, fine-tuning flavors and personalizing subscription timings. Clif Bar’s initiative allows customers to build custom variety packs, offering insights into flavor preferences that influence decisions in physical stores[3]Source: Clif Bar, “Custom Variety Pack E-Commerce,” clifbar.com . Embracing technologies like blockchain for traceability, brands bolster supply-chain transparency, appealing to environmentally-conscious shoppers. The competitive landscape also spans marketing avenues; campaigns on TikTok, spotlighting eye-catching ingredients, spark viral interest, posing a challenge to established players.
Ingredient shortages drive competitors and suppliers to collaborate on research and development. In a bid to stabilize yields, pea protein processors are co-investing in crop resilience initiatives in Canada. Industry coalitions engage with regulators, advocating for unified fortification standards to simplify formulations across regions. Retailers are streamlining their SKU offerings, favoring brands that demonstrate quick turnover and consistent supply. As private-label products gain traction, national brands are turning to cause marketing and eco-friendly packaging as strategies to validate their premium pricing. The snack bars market, while dominated by major players, still offers a platform for specialists, as long as they stay attuned to evolving nutrition and sustainability standards.
Snack Bars Industry Leaders
General Mills Inc.
Kellogg Company
Mars Incorporated
Mondelēz International Inc.
Nestlé SA
- *Disclaimer: Major Players sorted in no particular order


Recent Industry Developments
- January 2025: Kellanova launched Special K Protein Bars in the United Kingdom, featuring 10 grams of protein per serving and no artificial sweeteners, targeting post-workout snacking and mid-afternoon energy needs. The launch extends the Special K franchise into the high-growth protein segment, addressing consumer demand for functional nutrition in a familiar brand format.
- October 2024: PepsiCo completed the acquisition of Siete Foods for USD 1.2 billion, adding a portfolio of grain-free, plant-based snacks to its better-for-you offerings. Siete's tortilla chips, salsas, and snack bars resonate with Hispanic and health-conscious consumers, providing PepsiCo with a foothold in the allergen-friendly and clean-label segments.
- August 2024: Mars announced the acquisition of Kellanova for USD 35.9 billion, combining Mars' confectionery and pet-food expertise with Kellanova's cereal-bar franchises, including Nutri-Grain, Rice Krispies Treats, and Special K. The transaction, expected to close in the first half of 2025, creates a snacking powerhouse with enhanced procurement leverage and global distribution reach.


Global Snack Bars Market Report Scope
A snack bar is a ready-to-eat food made from grains, dried fruits, nuts, seeds, or protein, offering quick energy or nutrients as a convenient snack. The Snack Bars Market is Segmented by Product Type, Nature, Packaging Format, Distribution Channel, and Geography. By Product Type, the market is segmented into Cereal and Granola Bars, Protein/Energy Bars, and Fruit and Nut/Seed Bars. By Nature, the market is segmented into Conventional and Organic. By Packaging Format, the market is segmented into Single-Serve and Multipack. By Distribution Channel, the market is segmented into Supermarkets and Hypermarkets, Convenience Stores, Online Retail, Specialty Stores, and More. By geography, the market is segmented into North America, Europe, Asia-Pacific, South America, and the Middle East and Africa. The Market Forecasts are Provided in Terms of Value (USD) and Volume (Tons).
Product Type
| Cereal and Granola Bars |
| Protein/Energy Bar |
| Fruit and Nut/Seed Bar |
Nature
| Conventional |
| Organic |
Packaging Format
| Single-Serve |
| Multipack |
Distribution Channel
| Supermarkets and Hypermarkets |
| Convenience Stores |
| Online Retail |
| Specialty Stores |
| Other Distribution Channels |
Geography
| North America | United States |
| Canada | |
| Mexico | |
| Rest of North America | |
| Europe | United Kingdom |
| Germany | |
| France | |
| Italy | |
| Spain | |
| Sweden | |
| Belgium | |
| Poland | |
| Netherlands | |
| Rest of Europe | |
| Asia-Pacific | China |
| Japan | |
| India | |
| Thailand | |
| Singapore | |
| Indonesia | |
| South Korea | |
| Australia | |
| New Zealand | |
| Rest of Asia Pacific | |
| South America | Brazil |
| Argentina | |
| Peru | |
| Colombia | |
| Chile | |
| Rest of South America | |
| Middle East and Africa | South Africa |
| Nigeria | |
| Egypt | |
| Morocco | |
| Turkey | |
| Rest of Middle East and Africa |
| Product Type | Cereal and Granola Bars | |
| Protein/Energy Bar | ||
| Fruit and Nut/Seed Bar | ||
| Nature | Conventional | |
| Organic | ||
| Packaging Format | Single-Serve | |
| Multipack | ||
| Distribution Channel | Supermarkets and Hypermarkets | |
| Convenience Stores | ||
| Online Retail | ||
| Specialty Stores | ||
| Other Distribution Channels | ||
| Geography | North America | United States |
| Canada | ||
| Mexico | ||
| Rest of North America | ||
| Europe | United Kingdom | |
| Germany | ||
| France | ||
| Italy | ||
| Spain | ||
| Sweden | ||
| Belgium | ||
| Poland | ||
| Netherlands | ||
| Rest of Europe | ||
| Asia-Pacific | China | |
| Japan | ||
| India | ||
| Thailand | ||
| Singapore | ||
| Indonesia | ||
| South Korea | ||
| Australia | ||
| New Zealand | ||
| Rest of Asia Pacific | ||
| South America | Brazil | |
| Argentina | ||
| Peru | ||
| Colombia | ||
| Chile | ||
| Rest of South America | ||
| Middle East and Africa | South Africa | |
| Nigeria | ||
| Egypt | ||
| Morocco | ||
| Turkey | ||
| Rest of Middle East and Africa | ||


Market Definition
- Milk and White Chocolate - Milk chocolates is a solid chocolate made with milk (in the form of either milk powder, liquid milk, or condensed milk) and cocoa solids. White chocolate is made from cocoa butter and milk and contains no cocoa solids whatsoever. The scope includes regular chocolates, low-sugar, and sugar-free variants
- Toffees & Nougats - Toffees include hard, chewy, and small or one-bite candies marketed with labels as toffee or toffee-like confectionery. Nougat is a chewy confection with almond, sugar, and egg white as a basic ingredient; and it originated in Europe and Middle East countries.
- Cereals Bars - A snack composed of breakfast cereal that has been compressed into a bar shape and is held together with a form of edible adhesive. The scope includes snack bars made with cereals such as rice, oats, corn, etc. mixed with a binding syrup. These also include products labeled as cereal bars, cereal treat bars, or grain bars.
- Chewing Gum - This is a preparation for chewing, usually made of flavored and sweetened chicle or such substitutes as polyvinyl acetate. The types of chewing gums included in the scope are sugar-chewing gums and sugar-free chewing gums
| Keyword | Definition |
|---|---|
| Dark Chocolate | Dark chocolate is a form of chocolate containing cocoa solids and cocoa butter without the milk. |
| White Chocolate | White chocolate is the type of chocolate containing the highest percentage of milk solids, typically around or over 30 percent. |
| Milk Chocolate | Milk chocolate is made from dark chocolate that has a low cocoa solid content and higher sugar content, plus a milk product. |
| Hard Candy | A candy made of sugar and corn syrup boiled without crystallizing. |
| Toffees | A hard, chewy, often brown sweet that is made from sugar boiled with butter. |
| Nougats | A chewy or brittle candy containing almonds or other nuts and sometimes fruit. |
| Cereal bar | A cereal bar is a bar-shaped food product, made by pressing cereals and usually dried fruit or berries, which are in most cases held together by glucose syrup. |
| Protein bar | Protein bars are nutrition bars that contain a high proportion of protein to carbohydrates/fats. |
| Fruit & Nut bar | These are often based on dates with other dried fruit and nut additions and, in some cases, flavorings. |
| NCA | The National Confectioners Association is an American trade organization that promotes chocolate, candy, gum and mints, and the companies that make these treats. |
| CGMP | Current good manufacturing practices are those conforming to the guidelines recommended by relevant agencies. |
| Unstandardized foods | Unstandardized foods are those that do not have a standard of identity or that deviate from a prescribed standard in any manner. |
| GI | The glycemic index (GI) is a way of ranking carbohydrate-containing foods based on how slowly or quickly they are digested and increase blood glucose levels over a period of time |
| Skimmed milk powder | Skimmed milk powder is obtained by removing water from pasteurized skim milk by spray-drying. |
| Flavanols | Flavanols are a group of compounds found in cocoa, tea, apples, and many other plant-based foods and beverages. |
| WPC | Whey protein concentrate- the substance obtained by the removal of sufficient nonprotein constituents from pasteurized whey so that the finished dry product contains greater than 25% protein. |
| LDL | Low density Lipoprotein- the bad cholesterol |
| HDL | High density Lipoprotein- the good cholesterol |
| BHT | butylated Hydroxytoluene is a lab-made chemical that is added to foods as a preservative. |
| Carrageenan | Carrageenan is an additive used to thicken, emulsify, and preserve foods and drinks. |
| Free form | Not containing certain ingredients, such as gluten, dairy, or sugar. |
| Cocoa butter | It is a fatty substance obtained from cocoa beans, used in the manufacture of confectionery. |
| Pastellies | A type of of Brazilian candy made from sugar, eggs, and milk. |
| Draggees | Small, round candies that are coated with a hard sugar shell |
| CHOPRABISCO | Royal Belgian Association of the chocolate, pralines, biscuit, and confectionery industry- A trade association that represents the Belgian chocolate industry. |
| European Directive 2000/13 | A European Union directive that regulates the labeling of food products |
| Kakao-Verordnung | The German chocolate ordinance, a set of regulations that define what can be labeled as "chocolate" in Germany. |
| FASFC | Federal Agency for the Safety of the Food Chain |
| Pectin | A natural substance that is derived from fruits and vegetables. It is used in confectionery to create a gel-like texture. |
| Invert sugars | A type of sugar that is made up of glucose and fructose. |
| Emulsifier | A substance that helps to mix to liquids that does not mix together. |
| Anthocyanins | A type of flavonoid that is responsible for the red, purple, and blue colors of confectionery. |
| Functional Foods | Foods that have been modified to provide additional health benefits beyond basic nutrition. |
| Kosher certificate | This certification verifies that the ingredients, production process including all machinery, and/or food-service process complies with the standards of Jewish dietary law |
| Chicory root extract | A natural extract from the chicory root that is a good source of fiber, calcium, phosphorous, and folate |
| RDD | Recommended daily dose |
| Gummies | A chewy gelatin-based candy that is often flavored with fruit. |
| Nutraceuticals | Food or dietary supplements that are claimed to have health benefits. |
| Energy bars | Snack bars that are high in carbohydrates and calories are designed to provide energy on the go. |
| BFSO | Belgian Food Safety Organization for the food chain. |


Research Methodology
Mordor Intelligence follows a four-step methodology in all our reports.
- Step-1: Identify Key Variables: In order to build a robust forecasting methodology, the variables and factors identified in Step 1 are tested against available historical market numbers. Through an iterative process, the variables required for market forecast are set, and the model is built on the basis of these variables.
- Step-2: Build a Market Model: Market-size estimations for the forecast years are in nominal terms. Inflation is not a part of the pricing, and the average selling price (ASP) is kept constant throughout the forecast period for each country.
- Step-3: Validate and Finalize: In this important step, all market numbers, variables, and analyst calls are validated through an extensive network of primary research experts from the market studied. The respondents are selected across levels and functions to generate a holistic picture of the market studied.
- Step-4: Research Outputs: Syndicated Reports, Custom Consulting Assignments, Databases & Subscription Platforms


