Field Service Management (FSM) Market Size and Share
Market Overview
| Study Period | 2020 - 2031 |
|---|---|
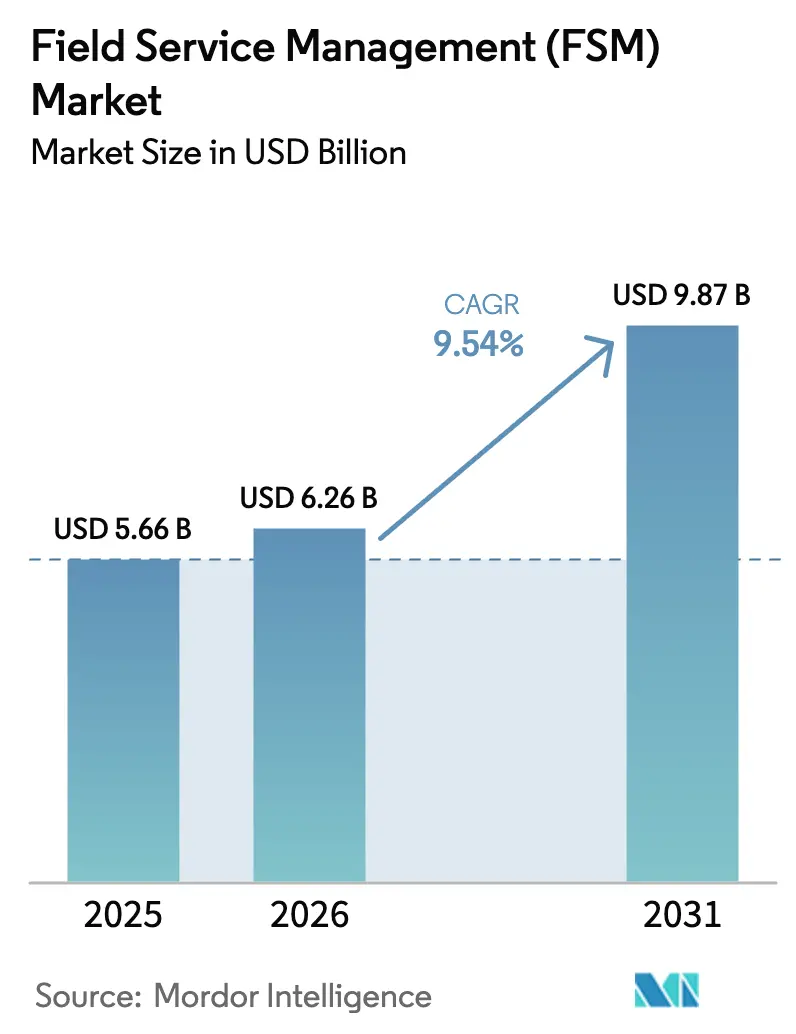
| Market Size (2026) | USD 6.26 Billion |
| Market Size (2031) | USD 9.87 Billion |
| Growth Rate (2026 - 2031) | 9.54% CAGR |
| Fastest Growing Market | Asia Pacific |
| Largest Market | North America |
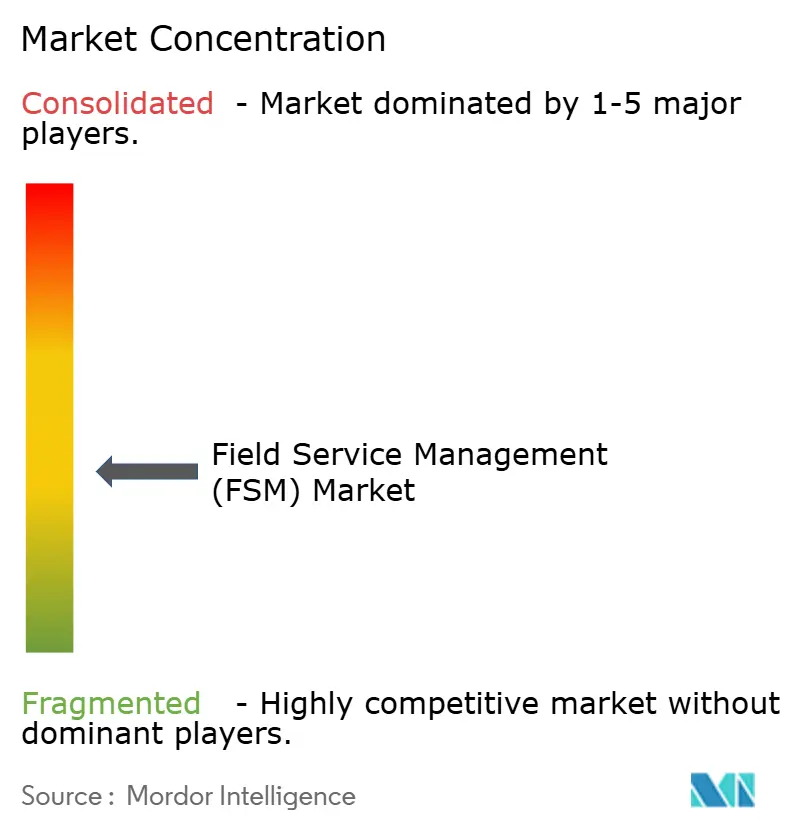
| Market Concentration | Medium |
Major Players *Disclaimer: Major Players sorted in no particular order Image © Mordor Intelligence. Reuse requires attribution under CC BY 4.0. | |
Field Service Management (FSM) Market Analysis by Mordor Intelligence
The Field Service Management Market size is expected to grow from USD 5.66 billion in 2025 to USD 6.26 billion in 2026 and is forecast to reach USD 9.87 billion by 2031 at 9.54% CAGR over 2026-2031.
This growth outlook reflects enterprises’ pivot toward real-time asset visibility, technician automation, and cloud-native architectures that harmonize front-office and operational-technology data flows. Demand is reinforced by grid-modernization mandates in utilities, 5G roll-outs in telecom, and servitization models in manufacturing, each widening the addressable pool of connected assets and elevating expectations for first-time-fix performance. Incumbent ERP providers are cross-selling field modules into their installed bases, prompting standalone vendors to emphasize vertical templates, mobile usability, and AI-assisted scheduling. Meanwhile, rising cybersecurity and data-sovereignty standards in the public sector temper adoption velocity, especially where on-premise or sovereign-cloud deployments are mandatory.
Key Report Takeaways
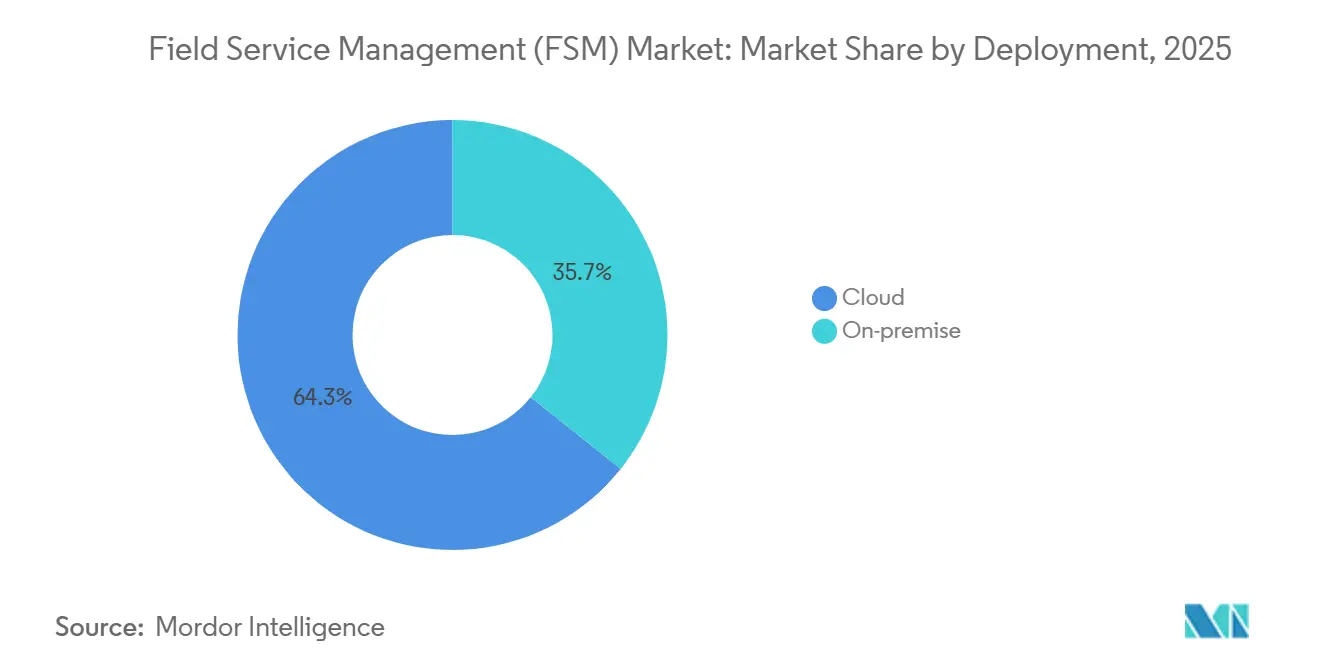
- By deployment type, cloud solutions captured 64.29% revenue share in 2025 and are forecast to expand at a 10.58% CAGR through 2031.
- By organization size, large enterprises held 57.55% of 2025 revenue, while small and medium enterprises are advancing at a 10.12% CAGR to 2031.
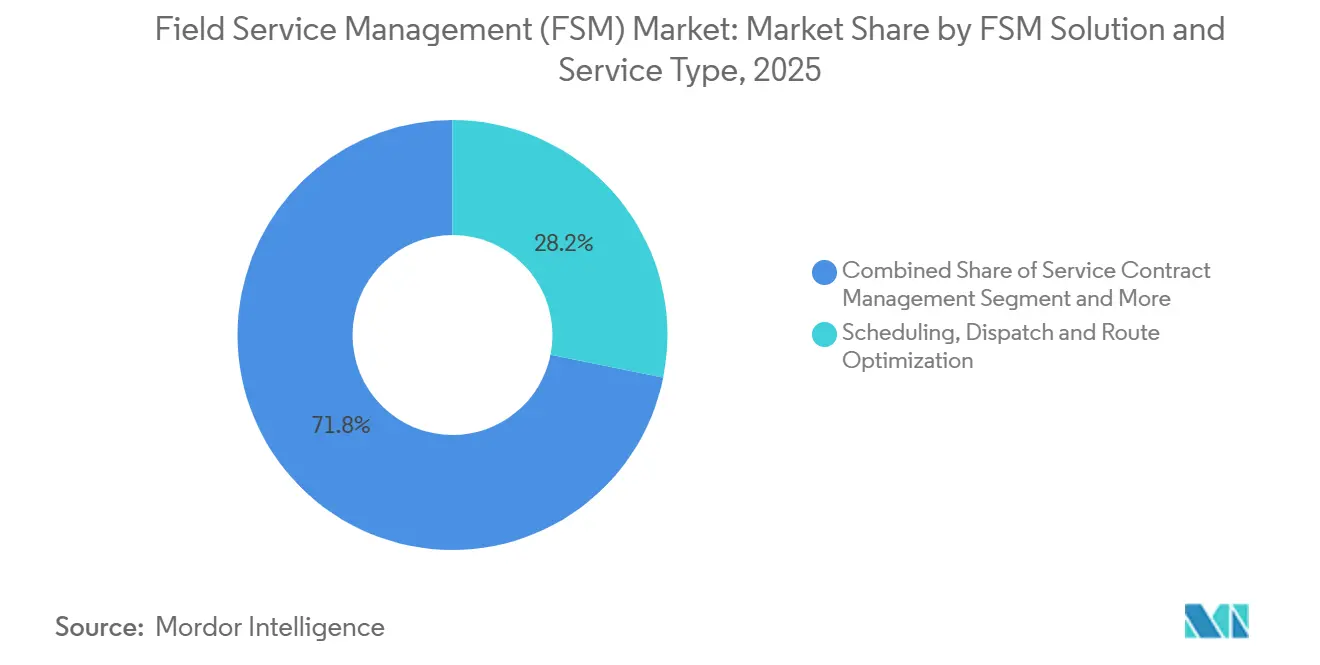
- By solution type, scheduling-dispatch and route-optimization led with 28.16% of 2025 revenue, and AI-driven scheduling tools are set to grow at a 9.89% CAGR to 2031.
- By end-user vertical, energy and utilities led with 21.65% share in 2025, whereas healthcare and life sciences are projected to expand at a 10.71% CAGR to 2031.
- By geography, North America contributed 37.89% of 2025 revenue, and Asia-Pacific is expected to post a 9.93% CAGR through 2031.
Note: Market size and forecast figures in this report are generated using Mordor Intelligence’s proprietary estimation framework, updated with the latest available data and insights as of January 2026.
Global Field Service Management (FSM) Market Trends and Insights
Drivers Impact Analysis*
| Driver | (~) % Impact on CAGR Forecast | Geographic Relevance | Impact Timeline |
|---|---|---|---|
| Real-time Technician Visibility Needs | +1.8% | North America and Europe, expanding to Asia-Pacific utilities | Medium term (2-4 years) |
| Large-scale 5G Roll-outs Raising Complexity | +1.5% | Global, early focus on South Korea, United States, China | Medium term (2-4 years) |
| OEM Servitization Models | +1.6% | Germany, United States, Japan industrial hubs | Long term (≥ 4 years) |
| Ageing Workforce Accelerating AI Scheduling | +1.4% | North America and Europe, spillover to Australia and New Zealand | Short term (≤ 2 years) |
| Edge-AI Device Diagnostics | +1.2% | Industrial sectors across Europe and North America | Medium term (2-4 years) |
| LEO-Satellite Connectivity | +0.9% | Remote areas in South America, Middle East and Africa, rural APAC | Long term (≥ 4 years) |
| Source: Mordor Intelligence | |||
Real-time Technician Visibility Needs across Utilities And Telecom
Utilities and telecom carriers are embedding GPS sensors, mobile apps, and geofencing into daily workflows to track location, arrival times, and job status in real time, enabling faster restoration and higher SLA compliance.[1]U.S. Energy Information Administration, “Utility Infrastructure Investment,” eia.gov Smart-grid investments translate anomaly alerts directly into work orders, shortening outage duration and trimming penalty costs. Integration between IoT devices on transformers or cell sites and field service platforms auto-generates tickets, eliminating phone dispatch delays. Cloud dashboards now merge asset-health data with workforce availability so supervisors can reroute crews mid-shift when storm damage escalates. European regulators that levy fines for prolonged outages further motivate the adoption of predictive dispatch tools. As a result, utilities are replacing paper boards with unified cloud platforms that synchronize asset telemetry, workforce calendars, and customer messaging.
Large-scale 5G Roll-outs Raising Field Complexity
Global 5G expansion is multiplying small-cell sites and edge nodes, each requiring precision alignment and frequent maintenance.[2]Ericsson, “Mobility Report 2024,” ericsson.com Unlike macro towers, these assets are dispersed on poles and rooftops, stressing legacy dispatch models. Field service routing algorithms now cluster proximate sites so a single technician can complete multiple jobs per trip, cutting truck rolls up to 20%. Private 5G networks in factories add round-the-clock uptime guarantees, making predictive scheduling indispensable for maintaining sub-hour MTTR benchmarks. Edge data centers co-located with 5G equipment raise the stakes further, as cooling or power failures jeopardize multiple tenants simultaneously. Consequently, operators adopt AI-driven scheduling and AR-assisted repair guides to meet tighter service windows and control maintenance costs.
OEM Servitization Models Creating Recurring Revenue Streams
Industrial and medical-device OEMs are shifting from one-time equipment sales to subscription contracts that bundle usage-based billing and guaranteed uptime. This model demands field service platforms capable of tracking asset utilization, scheduling preventive tasks, and invoicing against performance KPIs. Remote monitoring embedded in MRI scanners or HVAC chillers feeds diagnostic data to cloud analytics, triggering component replacement before a breakdown. Predictive upkeep enhances contract renewal rates and opens cross-sell paths for software updates or energy-performance services. As servitization spreads, vendors with deep asset-lifecycle management features gain an edge in capturing the expanding aftermarket value pool.
Ageing Workforce Accelerating AI-assisted Scheduling
Technician demographics are skewing older, with pending retirements shrinking the skilled labor pool.[3]Restraint (~) % Impact on CAGR Forecast Geographic Relevance Impact Timeline Cyber-security and Data-sovereignty Barriers -1.1% Europe, North America, Middle East and Africa public utilities Medium term (2-4 years) Legacy ERP and OT Integration Complexity -0.9% Global brownfield plants, notably Europe and North America Short term (≤ 2 years) High Contract-Technician Churn -0.7% Gig-economy hubs in North America, Europe, Australia Short term (≤ 2 years) Escalating ESG Audit Requirements -0.6% Europe, North America, select Asia-Pacific Medium term (2-4 years) AI scheduling alleviates this shortfall by matching tasks to available skills, factoring in real-time traffic, parts availability, and historical job duration. Early adopters report double-digit gains in first-time-fix rates and lower overtime spend. Machine-learning models also map training curricula for junior staff by mining service-history data to identify skill gaps. As veterans retire, AI preserves institutional knowledge within algorithms, sustaining service quality despite workforce turnover. Enterprises therefore view AI scheduling not merely as an efficiency tool but as core to long-term labor-risk mitigation.
Restraints Impact Analysis*
| Restraint | (~) % Impact on CAGR Forecast | Geographic Relevance | Impact Timeline |
|---|---|---|---|
| Cyber-security and Data-sovereignty Barriers in Public Sector | -1.3% | Global, with higher impact in EU and APAC | Medium term (2-4 years) |
| Legacy ERP/OT Integration Complexity in Brownfield Plants | -1.2% | Global, with higher impact in mature industrial markets | Short term (≤ 2 years) |
| Up-front Subscription and Change-management Costs for SMEs | -0.9% | Global, with higher impact in emerging markets | Short term (≤ 2 years) |
| Cross-border Regulatory Fragmentation Hindering AI Dispatch | -1.1% | Global, with higher impact in regions with strict data regulations | Medium term (2-4 years) |
| Source: Mordor Intelligence | |||
Cyber-security and Data-sovereignty Barriers in the Public Sector
Government buyers impose strict data-residency rules and zero-trust mandates that lengthen procurement cycles.[4]Cybersecurity and Infrastructure Security Agency, “Critical Infrastructure Security and Resilience,” cisa.gov Vendors must demonstrate encryption, identity management, and incident-response playbooks compliant with frameworks such as NIST CSF, extending sales cycles up to nine months. In the European Union, the Data Act obliges cloud providers to localize operational data, inflating infrastructure costs and limiting multi-country rollouts. Smaller vendors lacking certified sovereign-cloud regions face exclusion from tenders, concentrating share among a few hyperscale players. These barriers particularly slow adoption in utilities and transit agencies that handle critical infrastructure data.
Legacy ERP and OT Integration Complexity in Brownfield Plants
Industrial facilities often rely on ERP packages installed before 2015 and proprietary PLC networks that do not expose open APIs. Synchronizing work orders, inventory, and asset hierarchies requires middleware bridges and, frequently, data-cleansing projects to reconcile inconsistent tag IDs and maintenance logs. OT networks in refineries or chemical plants remain air-gapped for safety, forcing technicians to capture data offline and sync later, undermining real-time visibility. Integration roadblocks can extend implementation timelines beyond one year, eroding ROI and delaying transformation roadmaps. Consequently, some manufacturers defer field service upgrades until broader ERP modernization aligns legacy systems with cloud interfaces.
*Our forecasts treat driver/restraint impacts as directional, not additive. The impact forecasts reflect baseline growth, mix effects, and variable interactions.
Segment Analysis
By Deployment Type – Cloud Gains Momentum through Scalability and Integration
Cloud solutions generated 64.29% of 2025 revenue and are projected to grow at a 10.58% CAGR, outpacing on-premise alternatives. This dominance positions cloud at the heart of the field service management market size forecast. Utilities benefit from elastic licensing during storm-response surges, avoiding server procurement delays. Quarterly feature releases deliver AI route optimization, walk-through video guides, and mobile UI upgrades faster than traditional upgrade cycles. Integration APIs streamline linking with CRM and ERP suites, unifying customer, financial, and asset data in a single workflow. On-premise deployments persist in defense and highly regulated public-sector contexts where sovereign networks are mandatory. Hybrid models are emerging as a compromise, hosting sensitive logic behind the firewall while leveraging cloud analytics for pattern recognition. Vendors that offer granular deployment options enhance win rates, particularly in multi-national groups needing flexibility across jurisdictions. As data-sovereignty laws tighten, region-specific cloud nodes are becoming table stakes rather than a differentiation.
Cloud expansion reinforces vendor opportunities to upsell value-added modules such as predictive-maintenance analytics and augmented-reality guidance. Marketplace ecosystems around leading platforms now list hundreds of certified connectors, ranging from spare-parts catalogs to weather-alert feeds. This openness lowers custom-integration costs for mid-market adopters, accelerating time to value. Additionally, subscription pricing aligns cash outflows with value realized, appealing to CFOs focused on capex optimization. In aggregate, these factors sustain the cloud segment’s lead in both field service management market share and growth velocity through the forecast horizon.


By Organization Size – SMEs Accelerate Adoption with Subscription Pricing
Large enterprises accounted for 57.55% of 2025 revenue on the strength of complex, multi-site deployments deeply integrated with ERP and supply-chain systems. Their scale amplifies the field service management market size at the top end, with projects spanning thousands of technicians in multiple languages. Conversely, small and medium enterprises are expanding at a 10.12% CAGR, narrowing the penetration gap. Entry-level plans priced near USD 50 per technician per month remove capital hurdles and include mobile apps intuitive enough to deploy without lengthy change-management programs. Regional contractors in HVAC, plumbing, and facilities services adopt these tiers to eliminate clipboards and spreadsheets, realizing immediate wins in dispatch efficiency. Vendors increasingly segment product lines into “enterprise” and “growth” editions, bundling AI analytics and sandbox environments for the former, while offering templatized workflows and self-service setup for the latter. Channel partners such as MSPs and accounting-software resellers play a pivotal role in SME outreach, embedding field service features into broader digital-transformation bundles.
From an innovation standpoint, the SME cohort often serves as a proving ground for low-code workflow builders and voice-to-text work-order entry, as agility trumps bureaucracy. These agile deployments create reference logos that vendors use to penetrate adjacent regional markets, compounding growth. As SME usage scales, data volumes train AI models, benefiting the entire customer base via pooled learning. Consequently, SME momentum constitutes a structural tailwind for the overall field service management market.
By FSM Solution and Service Type: Services Outpace Software Growth
Scheduling-dispatch and route-optimization software captured 28.16% of 2025 revenue, anchoring the operational backbone of the field service management market. Machine-learning upgrades that forecast job duration and traffic patterns are progressing at a 9.89% CAGR. Service-contract management modules gain relevance as OEMs monetize uptime guarantees, automating entitlement checks and KPI billing. Work-order management now connects directly to IoT sensors on machinery, enabling condition-triggered tickets that minimize unplanned downtime. Customer management portals enhance transparency by displaying technician GPS locations and offering instant rescheduling, lifting net-promoter scores, and reducing inbound call volumes. Inventory-management features balance van stock with depot levels, cutting part-related repeat visits. Implementation and managed-service engagements represent a sizable adjunct revenue stream, as enterprises outsource configuration to system integrators familiar with legacy ERP landscapes.
The rise of generative AI in 2026 marks the next leap, automatically drafting work-order summaries and spare-part recommendations from technician voice notes. Augmented-reality overlays guide less experienced staff through complex diagnostics, offsetting labor shortages. In parallel, low-code platforms empower business analysts to adapt forms and workflows without costly vendor professional-services engagements. Taken together, solution-level innovation underpins robust expansion in the field service management market while broadening the addressable buyer spectrum.

By End-User Vertical: Transportation and Logistics Lead Growth
Manufacturing accounted for 22% of the field service management market share in 2025, reflecting extensive preventive maintenance across shop-floor assets and strict uptime goals. Predictive insights cut unplanned downtime, making FSM integral to Industry 4.0 roadmaps.
Transportation and logistics are accelerating at 15.6% CAGR. Route optimisation, driver mobile apps, and predictive maintenance for fleets deliver up to 25% cost savings, spurring rapid platform uptake. The field service management market size generated by this sector will therefore climb sharply as e-commerce volumes drive tighter delivery SLAs.
Geography Analysis
North America generated 37.89% of global revenue in 2025, positioned at the intersection of advanced telecom infrastructure, widespread smart-grid roll-outs, and a mature ERP installed base that bundles field modules. Investor-owned utilities invested USD 28.4 billion in transmission and distribution upgrades during 2025, feeding steady demand for outage-management dispatch tools (eia.gov). Augmented-reality remote-assistance adoption is accelerating in aerospace and manufacturing, allowing experts to guide on-site technicians without travel. Canada’s utilities pilot FSM integrations with electric-vehicle charging networks to boost charger uptime, while Mexico’s fiber expansion in underserved regions relies on mobile apps capable of offline operation.
Asia-Pacific is projected to grow at a 9.93% CAGR through 2031, buoyed by China’s smart-manufacturing ambitions, India’s Digital India initiative, and Japan’s Society 5.0 framework. Massive smart-meter roll-outs in China generate installation and maintenance volumes that feed directly into FSM platforms. India’s government grants for cloud software adoption lower barriers for micro-enterprises, fostering grassroots digitization among HVAC and electrical contractors. Japan combats labor shortages with AI scheduling and robotics integration, coordinating human and drone inspections across infrastructure assets. Australia and New Zealand leverage low-Earth-orbit satellite connectivity to manage maintenance in remote mining and utility networks.
Europe, South America, and the Middle East and Africa account for the remaining share of the field service management market. Europe’s stringent reliability standards under the Clean Energy Package prompt utilities to adopt predictive dispatch and edge analytics. Germany’s brownfield plants retrofit equipment with edge gateways that trigger field tickets on vibration anomalies, cutting downtime. South American telecom operators deploy FSM to coordinate large-scale fiber builds in Brazil and Argentina, while Middle Eastern oil producers use satellite-enabled platforms to service offshore rigs. South Africa’s mines experiment with predictive maintenance for autonomous haul trucks, indicating rising regional sophistication.
Mordor Intelligence provides coverage of the field service management (fsm) market across other key regional markets, including Asia, each with their regulatory frameworks and demand patterns.


Competitive Landscape
The market remains moderately fragmented, with the top five vendors - Oracle, Salesforce, Microsoft, SAP, and IFS - commanding an estimated 45% combined share. ERP incumbents bundle field modules with finance and supply-chain suites, creating switching costs and cross-selling leverage. Pure-play providers such as ServiceMax, Zinier, and simPRO position on configurability, mobile UI agility, and vertical-specific templates, appealing to customers wary of complex ERP lock-ins. Product roadmaps heavily emphasize AI scheduling, AR guidance, and IoT integration, with vendors acquiring niche algorithms or partnering with sensor manufacturers to build end-to-end asset-performance stacks.
Low-code platforms are emerging disruptors, enabling rapid customization without deep coding expertise and shrinking implementation timelines. New entrants target micro-verticals like residential HVAC or landscaping with simplified features and sub-USD 30 monthly pricing, expanding the total addressable field service management market. Offline-first mobile architectures gain importance for technicians operating in low-connectivity zones, differentiating vendors that handle data synchronization gracefully. Patent filings in 2024-2026 center on dynamic routing AI, voice-activated work-order updates, and blockchain audit trails, indicating an IP race among top players. Private-equity-backed roll-ups continue, consolidating regional vendors to achieve R&D and support economies of scale.
Field Service Management (FSM) Industry Leaders
Oracle Corp. (Oracle Field Service)
Salesforce Inc. (Field Service)
Microsoft Corp. (Dynamics 365 Field Service)
SAP SE (Coresystems)
IFS AB
- *Disclaimer: Major Players sorted in no particular order

Recent Industry Developments
- November 2025: Salesforce released Field Service Mobile 3.0, featuring offline-first architecture and AR overlays for intermittent-connectivity scenarios.
- September 2025: IFS acquired a minority stake in an edge-AI diagnostics startup, integrating anomaly detection into its FSM platform.
- July 2025: Oracle invested USD 150 million to add sovereign-cloud regions in Singapore and Sydney for public-sector buyers.
- May 2025: SAP partnered with Siemens to embed industrial-edge gateways into SAP Field Service Management for brownfield plants.


Research Methodology Framework and Report Scope
Market Definitions and Key Coverage
Our study defines the field service management market as the annual revenues generated by purpose-built software platforms (and associated integration or support services) that plan, dispatch, track, and analyze mobile technicians who install, repair, or maintain customer assets. Solutions span scheduling, work-order orchestration, route optimization, contract and inventory control, plus real-time mobile apps that feed operational analytics.
Scope exclusion: Hardware such as rugged devices, vehicle telematics boxes, and standalone GPS trackers is not counted.
Segmentation Overview
- By Deployment Type
- On-premise
- Cloud
- By Organization Size
- Large Enterprises
- Small and Medium Enterprises
- By FSM Solution and Service Type
- Solutions
- Scheduling, Dispatch and Route Optimization
- Service Contract Management
- Work-order Management
- Customer Management
- Inventory Management
- Other Software (Billing, Invoicing, Warranty)
- Services (Integration, Implementation, Support)
- Solutions
- By End-User Vertical
- Facilities Management (Hard-FM and Soft-FM)
- IT and Telecom
- Healthcare and Life Sciences
- Energy and Utilities
- Oil and Gas
- Manufacturing
- Transportation and Logistics
- Real Estate and Others
- By Geography
- North America
- United States
- Canada
- Mexico
- South America
- Brazil
- Argentina
- Chile
- Peru
- Rest of South America
- Europe
- Germany
- United Kingdom
- France
- Italy
- Spain
- Rest of Europe
- Asia-Pacific
- China
- Japan
- South Korea
- India
- Australia
- New Zealand
- Rest of Asia-Pacific
- Middle East and Africa
- United Arab Emirates
- Saudi Arabia
- Turkey
- South Africa
- Rest of Middle East and Africa
- North America
Detailed Research Methodology and Data Validation
Primary Research
Mordor analysts interviewed product managers at major FSM vendors, digital transformation leads in utilities, and fleet supervisors across North America, Europe, and Asia Pacific. These dialogs clarified license fee bands, cloud migration pacing, and real-world churn, filling the gaps left by desk work and sharpening model assumptions.
Desk Research
We began with public datasets from bodies such as the US Bureau of Labor Statistics, Eurostat, India's MeitY digital index, and OECD ICT spending tables, which reveal technician head-count trends and enterprise software outlay. Trade associations, for example, CompTIA and the International Facility Management Association, provide adoption rates for mobility tools, while patent query snapshots from Questel highlight innovation velocity in AI-driven scheduling. Company 10-Ks, investor decks, and credible press releases then anchor vendor revenue splits. Paid screens from D&B Hoovers and Dow Jones Factiva let us verify corporate disclosures. This source list is illustrative; many additional references were reviewed for validation.
Market-Sizing & Forecasting
A top-down rebuild starts with regional technician pools, enterprise software budget ratios, and cloud penetration rates; results are corroborated with selective bottom-up checks such as sampled average selling price multiplied by live user counts reported during interviews. Key inputs include: 1) number of field workers per sector, 2) share of technicians on mobile apps, 3) average annual license plus support fee per user, 4) cloud share progression, 5) regional GDP outlook, and 6) regulatory pushes for digital work orders. Multivariate regression blends these variables, and scenario analysis captures macro shocks. Where supplier roll-ups miss micro-segment detail, interpolation rules guided by contract size distribution smooth the gaps.
Data Validation & Update Cycle
Outputs pass variance tests against spend benchmarks, with anomalies escalated to a senior reviewer before sign-off. Reports refresh each year; interim updates occur when sizable policy, merger, or pricing events surface, and a rapid client-ready sweep is completed prior to delivery.
Why Mordor's Field Service Management Baseline Merits Confidence
Published figures often diverge because firms disagree on whether to include implementation services, how quickly cloud displaces on-premise, and the speed at which SMEs adopt.
Our disciplined scope, live ASP verification, and yearly refresh cadence temper extremes and keep currency conversions consistent.
Benchmark comparison
| Market Size | Anonymized source | Primary gap driver |
|---|---|---|
| USD 5.64 B (2025) | Mordor Intelligence | - |
| USD 4.00 B (2023) | Global Consultancy A | Uses historic base, excludes support services, assumes slower cloud shift |
| USD 4.72 B (2024) | Industry Association B | Counts license revenue only, no inflation normalization |
| USD 4.91 B (2023) | Regional Consultancy C | Limited geographic coverage, single-scenario forecast |
These comparisons show that when scope breadth, variable rigor, and refresh frequency vary, market values move materially; Mordor's balanced, traceable approach supplies decision-makers with a dependable starting point.


Key Questions Answered in the Report
What is the projected value of the field service management market in 2031?
The market is forecast to reach USD 9.87 billion by 2031, supported by a 9.54% CAGR.
Which deployment model is growing fastest within field service management?
Cloud deployments are expanding at a 10.58% CAGR, benefiting from elastic scaling and rapid feature updates.
Why is healthcare adoption of field service software accelerating?
Biomedical equipment uptime mandates and service-based contracts are driving a 10.71% CAGR in the healthcare segment.
How are AI tools improving technician productivity?
AI-assisted scheduling reduces dispatch time, boosts first-time-fix rates, and recommends training paths based on skill gaps.
What regional factors support growth in Asia-Pacific?
Government digitalization programs in China and India and Japan’s Society 5.0 initiatives are accelerating uptake across industries.
How concentrated is vendor competition today?
The top five vendors control roughly 45% share, indicating moderate concentration with room for specialist disruptors.
Page last updated on:


