
Soft Tissue Repair Market Size and Share
Market Overview
| Study Period | 2020 - 2031 |
|---|---|
| Market Size (2026) | USD 16.23 Billion |
| Market Size (2031) | USD 20.33 Billion |
| Growth Rate (2026 - 2031) | 4.62 % |
| Fastest Growing Market | Asia-Pacific |
| Largest Market | North America |
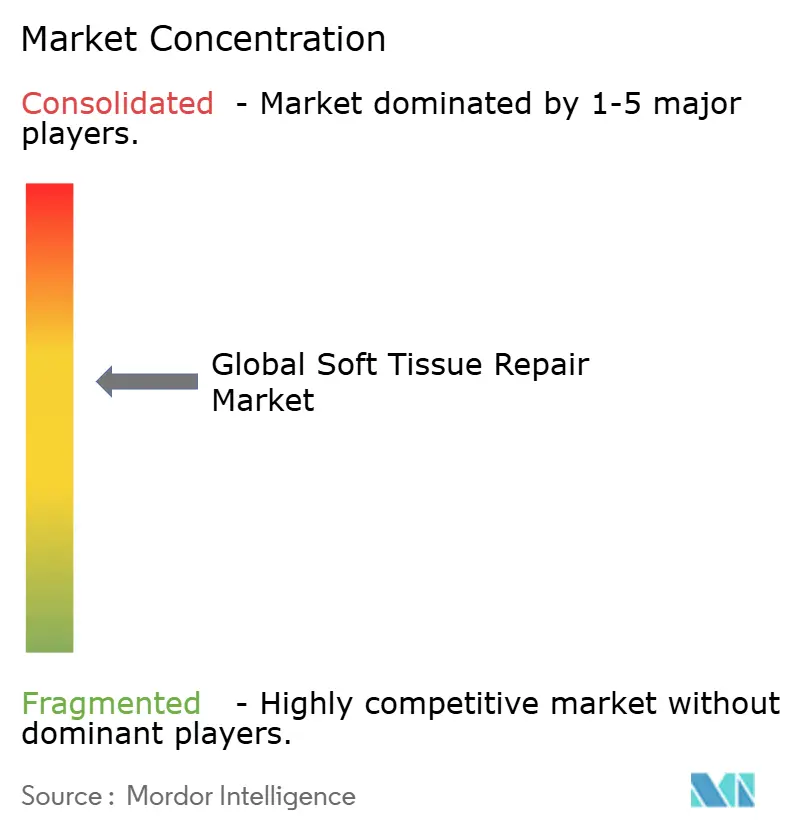
| Market Concentration | Medium |
Major Players *Disclaimer: Major Players sorted in no particular order Image © Mordor Intelligence. Reuse requires attribution under CC BY 4.0. | |
Soft Tissue Repair Market Analysis by Mordor Intelligence
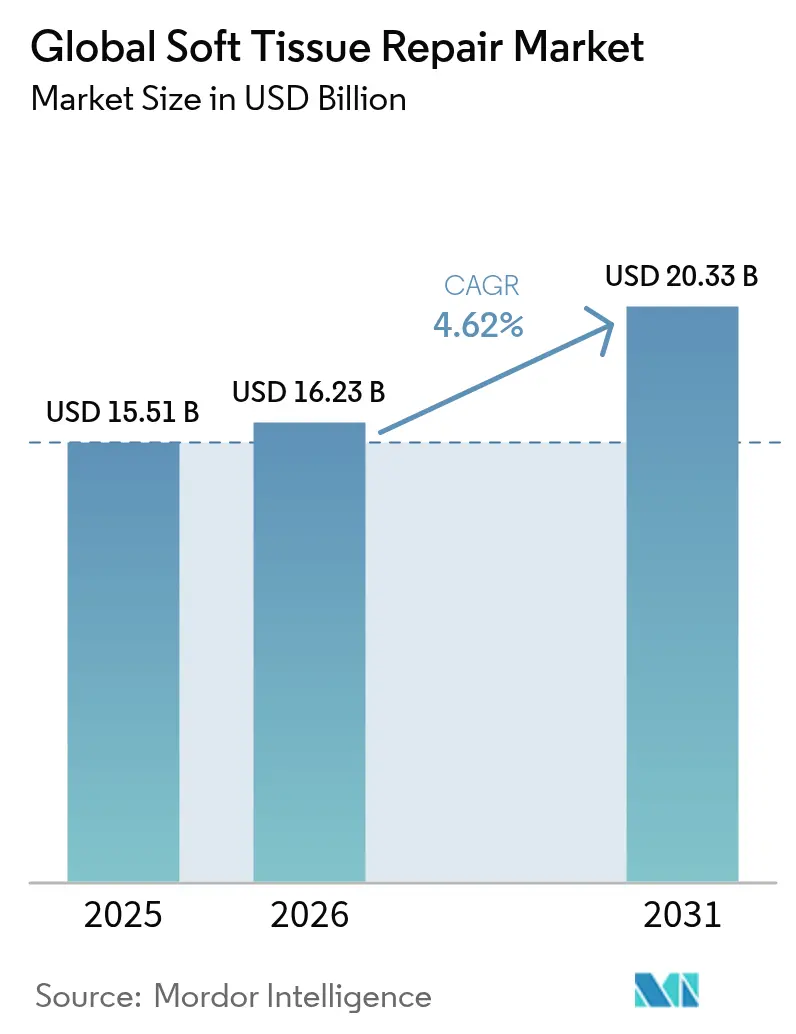
The global soft tissue repair market size was valued at USD 15.51 billion in 2025 and estimated to grow from USD 16.23 billion in 2026 to reach USD 20.33 billion by 2031, at a CAGR of 4.62% during the forecast period (2026-2031). Demand is underpinned by aging demographics, a steady rise in sports injuries, and the accelerating shift of procedures to ambulatory surgical centers (ASCs). Rapid product innovation—spanning bio-engineered meshes, 3D-printed scaffolds, and suture-less fixation systems—continues to refresh the competitive landscape. Intensifying regulatory scrutiny of legacy synthetic meshes is steering surgeons toward biologic and hybrid alternatives that promise better biocompatibility. At the same time, payer cost-containment policies are amplifying the need for devices optimized for outpatient settings without sacrificing clinical outcomes.
Key Report Takeaways
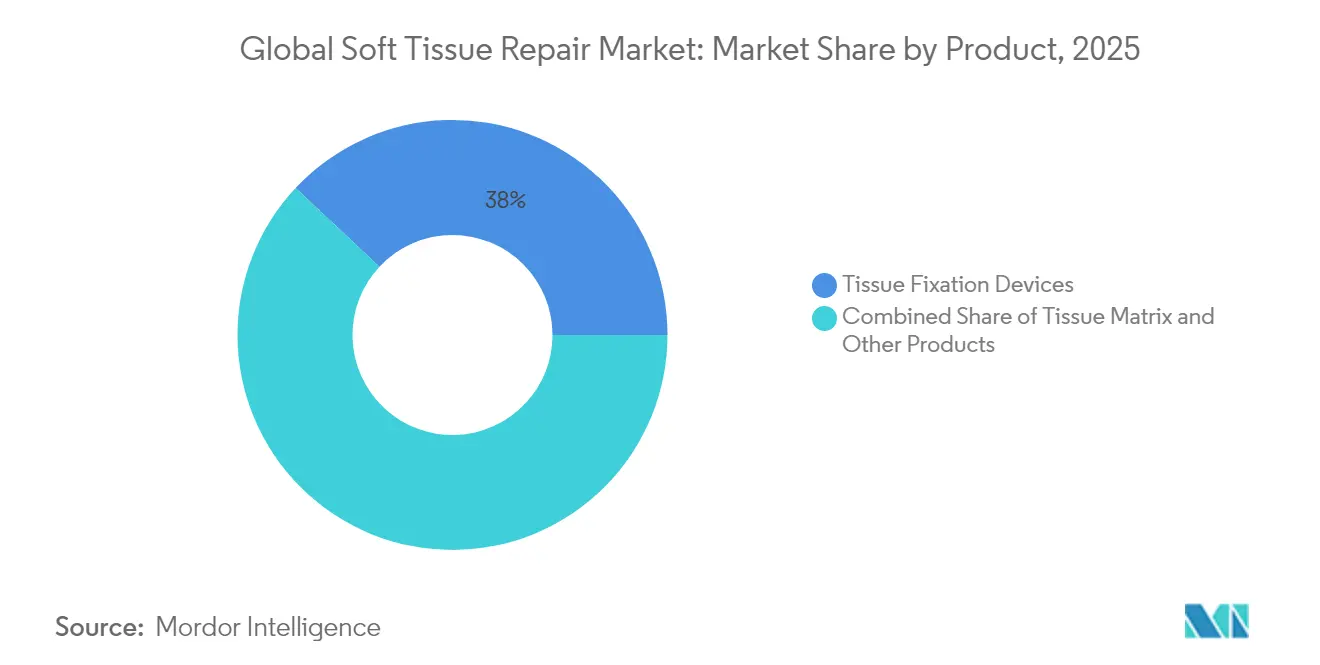
- By product, tissue fixation devices led with a 38.02% revenue share of the soft tissue repair market in 2025; tissue matrices are forecast to expand at a 5.15% CAGR through 2031.
- By application, hernia repair accounted for 28.05% of the soft tissue repair market share in 2025, while orthopedics & sports medicine is projected to grow at 5.55% CAGR between 2026 and 2031.
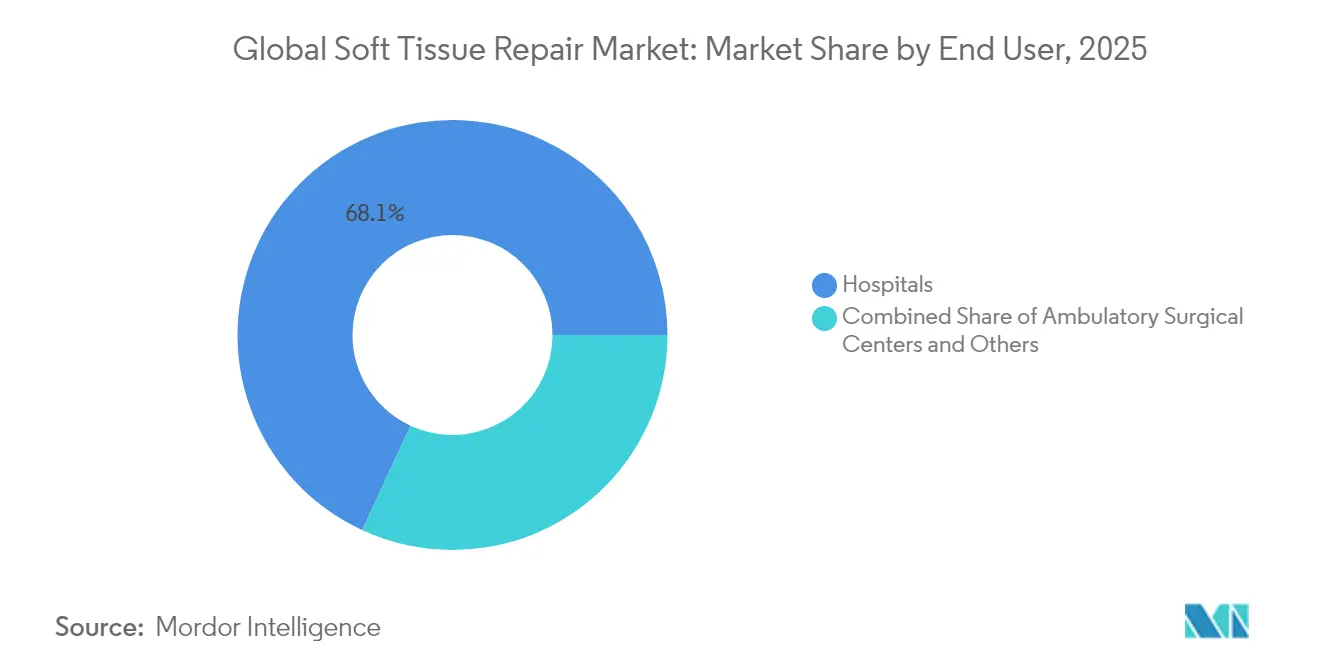
- By end user, hospitals retained 68.10% of the soft tissue repair market in 2025; ASCs are expected to record the fastest growth at 5.65% CAGR over the forecast period.
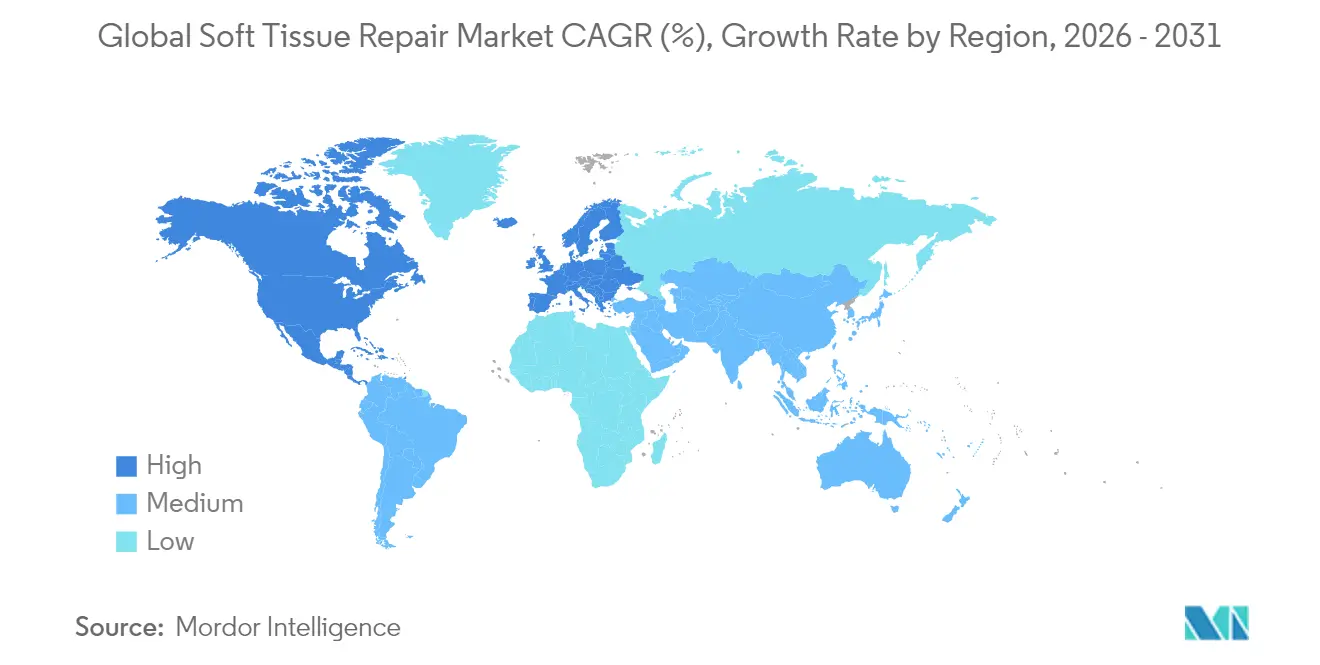
- By geography, North America commanded 42.55% of the soft tissue repair market in 2025; Asia-Pacific is set to register the highest regional CAGR of 5.90% during 2026-2031.
Note: Market size and forecast figures in this report are generated using Mordor Intelligence’s proprietary estimation framework, updated with the latest available data and insights as of 2026.
Market Trends and Insights
Drivers Impact Analysis of Soft Tissue Repair Market*
| Driver | (~) % Impact on CAGR Forecast | Geographic Relevance | Impact Timeline |
|---|---|---|---|
| Rising sports-related injuries | +0.8% | North America & Europe | Medium term (2-4 years) |
| Increasing trauma & road-accident cases | +0.6% | Global, highest in emerging markets | Short term (≤ 2 years) |
| Growing geriatric population | +1.2% | Global, amplified in developed economies | Long term (≥ 4 years) |
| Technological advances in bio-engineered meshes & fixation devices | +0.9% | North America & Europe; adoption spreading worldwide | Medium term (2-4 years) |
| Outpatient ASC expansion | +1.1% | North America, moving into Europe | Short term (≤ 2 years) |
| 3D-printed patient-specific scaffolds | +0.7% | North America & Europe | Long term (≥ 4 years) |
| Source: Mordor Intelligence | |||
Rising Sports-Related Injuries
A steady uptick in athletic participation across age groups keeps the soft tissue repair market on a growth trajectory. Incidence of surgically treated hamstring injuries climbed more than threefold in Sweden between 2001 and 2023. Similar trends appear in upper-extremity trauma, where hand injury cases rose 2% annually from 2007 to 2022. Older recreational athletes often present diminished tissue quality, fueling demand for advanced biologic grafts and load-sharing fixation systems that shorten rehabilitation timelines. Device makers able to document quicker functional recovery in this cohort gain a clear competitive edge.
Increasing Trauma & Road-Accident Cases
Road traffic accidents remain a major global health burden, markedly in emerging economies. Complex extremity injuries often involve multiple soft tissue layers, prompting surgeons to favor integrated repair platforms combining fixation, scaffold, and hemostatic functions. Regional disparities in trauma patterns compel manufacturers to tailor training and inventory models to local needs. As governments in Asia and Latin America roll out trauma system upgrades, procedure volumes are expected to lift the soft tissue repair market further.
Growing Geriatric Population
Nearly half of postmenopausal women are projected to suffer musculoskeletal disorders by 2045. Age-linked hernia prevalence is also on the rise, with 6.75 million existing adult cases tallied in 2021. Older patients exhibit slower healing and a higher risk of recurrence, heightening interest in collagen-based and bio-inductive implants that support tissue regeneration. Suppliers with long-term clinical data in geriatric cohorts are poised to capture share.
Technological Advances in Bio-Engineered Meshes & Fixation Devices
Extracellular-matrix (ECM) hydrogel coatings significantly dampen chronic inflammation around polypropylene mesh. Light-activated polymers eliminate sutures in peripheral nerve repair, underscoring a wider push toward less invasive, time-saving techniques. Continuous product improvements help manufacturers meet the dual challenge of ASC cost constraints and hospital performance metrics, strengthening the overall soft tissue repair market.
Outpatient ASC Expansion Driving Procedure Volumes
ASCs performed 72% of all U.S. surgeries in 2024 and are on track for 21% volume growth by 2034 [1]. Same-day discharge protocols compel device makers to prove shorter setup and operating times. Companies able to bundle implants with disposable instruments tailored for ASCs can grow revenue streams even as per-unit prices face downward pressure.
3D-Printed Patient-Specific Scaffolds
Additive manufacturing now generates anatomically matched patches and conduits that fit complex defects with minimal trimming. Early studies on coral-inspired grafts show full integration within 6-12 months, compared with longer timelines for conventional allografts. As printer access broadens beyond academic hubs, patient-specific constructs are expected to form a meaningful revenue segment within the soft tissue repair market.
Restraints Impact Analysis of Soft Tissue Repair Market*
| Restraint | (~) % Impact on CAGR Forecast | Geographic Relevance | Impact Timeline |
|---|---|---|---|
| High procedure & device costs | -0.9% | Global, sharper impact in emerging economies | Medium term (2-4 years) |
| Infection litigation & stringent mesh regulations | -1.2% | North America & Europe | Short term (≤ 2 years) |
| Reimbursement pushback on novel biologic meshes | -0.8% | North America & Europe | Medium term (2-4 years) |
| Limited surgeon training in emerging markets | -0.6% | Asia-Pacific, Latin America, MEA | Long term (≥ 4 years) |
| Source: Mordor Intelligence | |||
High Procedure & Device Costs
Premium biologic matrices can cost multiples of standard polypropylene mesh. U.S. payers now cap the number of applications for certain skin substitutes and demand comparative evidence of superiority [2]. Similar scrutiny by private insurers has tagged many novel grafts as investigational. Without sustained outcome data, adoption in cost-sensitive settings stalls, slowing the pace at which the soft tissue repair market converts to newer materials.
Infection Litigation & Stringent Mesh Regulations
Mesh-related litigation has surpassed USD 1 billion in settlements for a single manufacturer. The FDA’s reclassification of transvaginal mesh to Class III heightened premarket approval requirements, and its ongoing hernia mesh reviews weigh on surgeon confidence. Resulting risk aversion can curb first-time implantations and dampen replacement demand.
Reimbursement Pushback on Novel Biologic Meshes
U.S. carriers increasingly label high-priced dermal matrices as experimental when randomized data are sparse. European agencies exhibit similar caution, urging value-based procurement. These moves compel vendors to embark on lengthier, costlier trials, tempering near-term revenue expansion within the soft tissue repair market.
Limited Surgeon Training in Emerging Markets
In Asia-Pacific and Latin America, deficits in advanced laparoscopic and arthroscopic training slow uptake of next-generation implants. Government efforts to enforce marketing codes and device laws, while enhancing safety, prolong approval timelines. Vendors must invest in proctoring programs and local evidence to unlock growth potential.
*Our forecasts treat driver/restraint impacts as directional, not additive. The impact forecasts reflect baseline growth, mix effects, and variable interactions.
Soft Tissue Repair Market Segment Analysis
By Product:
Fixation Devices Remain Cornerstone, Matrices AccelerateFixation devices held a 38.02% share of the soft tissue repair market in 2025, underpinned by surgeon familiarity with suture anchors, interference screws, and medical adhesives. FDA clearance for CONMED’s expanded BioBrace indications in 2025 adds over 50 orthopedic procedures to its label . TELA Bio’s liquid adhesive, launched in 2024, offers a suture-less option for hernia closure. Continuous innovation secures this segment’s revenue stream and supports continued demand across orthopedic soft tissue repair procedures.
Tissue matrices are forecast to outpace all other categories at a 5.15% CAGR. Collagen-elastin hybrids and ECM-coated polypropylene meshes are demonstrating reduced recurrence and lower inflammatory profiles in pre-clinical models. As payers warm to the long-term cost savings of fewer re-operations, this fast-growing segment is poised to enlarge its slice of the soft tissue repair market size.

By Application:
Hernia Repair Dominates, Orthopedics & Sports Medicine SurgesHernia repair accounted for 28.05% of the soft tissue repair market size in 2025, bolstered by more than 1.2 million annual procedures in the United States alone. Standardized coding keeps reimbursement predictable, sustaining high volumes.
Orthopedics & sports medicine is projected to expand at 5.55% CAGR, the quickest among applications. FDA clearance for the first regenerative meniscus implant in 2024 opened a new therapeutic frontier. Bio-inductive shoulder patches have delivered up to 86% reductions in rotator cuff re-tear rates in multicenter trials. These successes are raising surgeon confidence and funneling R&D investment.
By End User:
Hospitals Hold Sway, ASCs Capture MomentumHospitals generated 68.10% of 2025 revenue thanks to infrastructure suited for complex, high-acuity cases. However, the pronounced migration to outpatient settings is starting to tilt case mix. Medicare reported 3.4 million ASC procedures for its beneficiaries in 2023, reflecting a 5.7% rise year-on-year. ASCs, benefiting from 45-60% lower costs and shorter wait times, are projected to grow fastest at 5.65% CAGR, making them a critical battleground within the soft tissue repair market.
Geography Analysis
North America Soft Tissue Repair Market
North America commanded 42.55% of the soft tissue repair market in 2025 and is expected to maintain leadership through 2031. A mature ASC network now delivers 72% of U.S. surgeries, enhancing throughput while containing costs. The FDA continues to clear breakthrough devices such as Humacyte’s acellular vessel for trauma repair, reinforcing the region’s innovation ecosystem.
Europe Soft Tissue Repair Market
Europe retains solid positioning thanks to universal health systems and CE-mark harmonization. Nevertheless, fiscal pressures are prompting stricter health-technology assessments, which slow reimbursement for premium biologic matrices. Ongoing investments in robotics and additive manufacturing keep local suppliers competitive, sustaining the region’s role in shaping next-generation solutions for the soft tissue repair market.
APAC Soft Tissue Repair Market
Asia-Pacific is the fastest-growing region, forecast at 5.90% CAGR. Regulatory modernization in China and India is clarifying approval pathways, while an aging population widens the candidate pool for hernia and rotator cuff procedures. Japan’s adoption of bio-inductive implants underscores the region’s appetite for advanced yet clinically validated technologies.
Regulatory Landscape
Soft tissue repair products generally fall under medical-device regulatory frameworks. Drug-device combinations and certain regenerative constructs require additional coordination under combination-product rules. In the United States, the FDA Office of Combination Products routes submissions based on primary mode of action, and FDA issued draft guidance in June 2025 on Unique Device Identifier (UDI) requirements for combination products, tightening expectations for labeling and database submissions for the device constituent part.
In Europe, implementation of Medical Devices Regulation (EU) 2017/745 continues to raise expectations for clinical evidence and conformity assessment demands for higher-risk implants such as meshes and fixation systems. The EMA supports alignment for products that combine a medicinal product with a device through its Combination Products Operational Group (COMBO) and maintains MDR-focused Q&A guidance (updated through December 2025), which affects how manufacturers structure technical documentation and coordinate notified-body reviews for drug-device combinations relevant to soft tissue repair.
Value Chain Analysis
The value chain spans raw-material production (medical-grade polymers such as polypropylene, PTFE, and absorbables like PLA/PGA/PLGA, plus collagen and other ECM inputs), conversion and sterilization (mesh extrusion/knitting, anchor and screw machining or molding, scaffold fabrication, decellularization and purification for biologic matrices), and downstream kitting for procedure-specific delivery in orthopedics, hernia, and reconstruction. Biologic matrices and hybrid meshes depend on tightly controlled sourcing and processing, with decellularized-tissue workflows often anchored in AATB-accredited tissue-bank infrastructure. Synthetic feedstock economics remain tied to petrochemical inputs.
Channel dynamics increasingly reflect procurement consolidation and procedure migration to outpatient settings, with more direct manufacturer engagement alongside ASC purchasing groups rather than classic distributor-only models in major US markets. Key bottlenecks include certified tissue-bank capacity for biologic mesh and risk controls around animal-derived inputs. This raises the operational value of validated processing, traceability, and standardized biocompatibility testing (including alignment to updated ISO 10993-1:2025 for biological evaluation).
Competitive Landscape
Market concentration remains moderate. Johnson & Johnson leads with 13% revenue share via Ethicon and DePuy Synthes portfolios, underpinned by sizeable R&D budgets. Stryker fortified its fixation lineup by acquiring Artelon in 2024 and closed a USD 4.9 billion deal for Inari Medical in 2025 to enter the vascular-trauma space.
Smith+Nephew, active across orthopedics and wound care, released 16 new products in 2024 and is leveraging its REGENETEN platform to deepen ties with sports-medicine surgeons.
Innovation pipelines concentrate on three avenues: biologic or hybrid meshes that lower re-operation risk, personalized 3D-printed scaffolds for complex defects, and liquid or light-activated fixation systems that shorten operative time—key for high-turnover ASCs. Companies delivering evidence of faster recovery and lower complication rates are expected to consolidate their positions within the soft tissue repair market.
Soft Tissue Repair Industry Leaders
-
Arthrex, Inc.
-
Boston Scientific Corporation
-
Stryker
-
Medtronic
-
Baxter International Inc.
- *Disclaimer: Major Players sorted in no particular order
Soft Tissue Repair Market Companies Covered in this Report
- Arthrex
- Medtronic
- Smith+Nephew plc
- Stryker
- Ethicon & DePuy Synthes (Johnson & Johnson)
- Baxter
- Integra LifeSciences Holdings
- Zimmer Biomet
- B. Braun
- Beckton Dickinson
- Conmed
- Organogenesis
- RTI Surgical
- Teleflex
- TELA Bio, Inc.
- Artivion, Inc. (CryoLife)
- Allergan Aesthetics (AbbVie)
- Wright Medical Group (Stryker)
Market Opportunities and Future Outlook
Product whitespace centers on technologies that reduce OR time and variability while supporting tissue integration, in line with the shift of procedures to ambulatory surgical centers and the need for reproducible outcomes under cost containment. This shows up in the move toward ready-to-use constructs and simplified fixation workflows, including pre-sutured tendon configurations and fixation platforms that extend labels across multiple joints and indications. Recent US clearances and launches in 2026, such as Inovedis expanded indications for SINEFIX and AlloSource ReConnex pre-sutured tendon for all-inside ACL procedures, illustrate commercialization paths that broaden adoption without requiring a fully new procedural infrastructure.
Another opportunity track involves combination approaches that pair regenerative matrices with established wound management modalities for complex soft tissue defects. ClinicalTrials.gov activity in 2026 includes a randomized prospective evaluation of ovine forestomach matrix used with negative pressure wound therapy for traumatic wounds (Aroa Biosurgery), and a TELA Bio study evaluating OviTex PRS in implant-based breast reconstruction. These programs reflect ongoing efforts to build indication-specific evidence packages for biologic and hybrid solutions, which supports adoption where synthetic mesh scrutiny and reimbursement documentation demands are most pronounced.
Recent Industry Developments in Soft Tissue Repair Market
- March 2026: Boston Scientific received FDA clearance for the Asurys Fluid Management System. While positioned in fluid management, the clearance expands Boston Scientifics procedural-enablement footprint, supporting operating-room workflow and adjacent surgical device pull-through in high-throughput settings.
- December 2024: Arthrex shared findings indicating its InternalBrace technique in ACL reconstruction reduced graft retears by up to 80% in young athletes. The data reinforces demand for augmentation and fixation approaches that target re-injury reduction, influencing surgeon preference and product selection in sports-medicine soft tissue repair.
- June 2024: Stryker announced a definitive agreement to acquire Artelon, adding synthetic soft tissue fixation solutions for sports medicine and foot and ankle procedures. The move broadened Strykers soft tissue repair portfolio depth in materials and indications, strengthening its ability to bundle implants and instruments across high-volume orthopedic repairs.
Soft Tissue Repair Market Report Scope and Research Methodology
Market Definition and Coverage
This market is defined as the revenue generated from products used to repair or reinforce soft tissues in surgical settings, including fixation devices and repair matrices used across common clinical procedures, and measured at selling price levels across major regions.
Scope exclusions: Purely pharmaceutical wound care therapies and general surgical instruments that do not remain dedicated to soft tissue repair outcomes are excluded from this sizing.
Segments Covered in This Report
- By Product
- Tissue Fixation Devices
- Suture Anchors
- Sutures & Staples
- Interference Screws
- Cyanoacrylate & Fibrin Glues
- Tissue Matrix
- Synthetic Mesh
- Biologic / Hybrid Mesh
- Other Products
- Tissue Fixation Devices
- By Application
- Orthopedics & Sports Medicine
- Dental Repair
- Hernia Repair
- Breast Reconstruction
- Skin & Burn Repair
- Other Applications
- By End User
- Hospitals
- Ambulatory Surgical Centers (ASCs)
- Others
- By Geography
- North America
- United States
- Canada
- Mexico
- Europe
- Germany
- United Kingdom
- France
- Italy
- Spain
- Rest of Europe
- Asia-Pacific
- China
- Japan
- India
- Australia
- South Korea
- Rest of Asia-Pacific
- Middle East & Africa
- GCC
- South Africa
- Rest of Middle East & Africa
- South America
- Brazil
- Argentina
- Rest of South America
- North America
Data Sources, Market Sizing, and Validation
Desk Research
Desk research was used to build the starting map of procedures, product categories, and demand signals that influence soft tissue repair spend. We reviewed public sources such as the US FDA device databases, US CDC injury and procedure statistics, OECD health expenditure indicators, and payer and provider coding references to understand procedure volumes and care settings.
To keep pricing and adoption assumptions realistic, we also checked inputs from company annual reports, investor presentations, and hospital procurement notes shared in public tenders, alongside peer-reviewed clinical and outcomes literature that reports re-tear rates and revision risks. When needed, our analysts used paid subscriptions for company financials and intelligence, patent databases, and global contracts and tenders to verify product activity and procurement patterns. These examples are not exhaustive, and other public sources were also reviewed for data collection, cross-checking, and clarification.
Primary Interviews and Surveys
Primary interviews and structured surveys were completed with a mix of device and matrix suppliers, distributors, surgeons, and hospital and ASC procurement contacts so real world usage and realized pricing could be checked. Coverage was balanced across key regions, and the discussions were used to confirm procedure mix shifts, the move toward outpatient care for eligible repairs, and how biologic versus synthetic matrices are selected in practice.
Distribution of primary research fieldwork respondents
| Company type | Respondent position | Region |
|---|---|---|
| Top tier: 39% | CXOs: 13% | APAC: 42% |
| Mid tier: 43% | Functional/Unit leaders: 33% | EMEA: 33% |
| Smaller Players: 18% | Managers: 54% | Americas: 25% |
Market-Sizing & Forecasting
The core model uses a top-down approach where procedure volumes and treatment settings are reconstructed by region, and then converted into product demand using utilization rates for fixation devices and repair matrices. Those totals are stress-tested with selective bottom-up approximations, such as sampled ASP times volume checks for key product groups and channel checks on hospital versus ASC purchasing patterns, and the final numbers are adjusted only when the two views do not reconcile.
Inputs were chosen to match how demand forms in this market, so we leaned on indicators like sports and trauma injury incidence, aging population exposure to tendon and ligament degeneration, hernia repair procedure volumes, outpatient shift for eligible repairs, and mix movement between biologic and synthetic meshes. Pricing was handled through observed ASP ranges and expected price progression by product type, and it was rechecked during interviews because list prices often differ from realized procurement prices. For forecasting, we used scenario analysis supported by short trend lines on the key drivers, which works better here than a single straight-line CAGR when procedure backlogs, reimbursement tightness, or regulation changes can move adoption in steps. Where bottom-up checks had gaps, we used proxy penetration rates anchored to comparable procedures, and then validated those proxies with practitioner feedback.
Data Validation & Update Cycle
Outputs are validated by triangulating independent signals, including procedure growth, category mix shifts, and supplier activity levels reflected in public filings and tenders. We run variance checks by region and product group, and outliers are reviewed by a second analyst before sign-off, with follow-up calls triggered when the data suggests a large pricing or utilization change.
The study is refreshed annually, and interim updates are made when material events occur, such as major regulatory actions, reimbursement changes, or meaningful technology introductions. Before delivery, the full model is re-opened for a final pass so clients receive an updated view based on the latest available inputs.
Mordor Intelligence's Soft Tissue Repair Market Size Versus Other Published Estimates
Published market values for soft tissue repair do not always line up, even when the topic appears the same, because the scope and counting logic can differ in small but important ways. Differences usually come from what is included as a product, the year used for sizing, how procedure volumes are translated into device and matrix demand, and how pricing is treated across regions.
Laparoscopic instruments and general closure supplies are a common add-on in some estimates, but they sit outside Mordor Intelligence's scope for this market, which keeps the total focused on repair-specific fixation devices and tissue matrices. Gaps can also show up when one model assumes an aggressive outpatient adoption curve or applies a single global ASP trend without separating biologic versus synthetic matrices, which can change the value even if procedure volumes are similar. Exchange-rate timing and update cadence matter as well, because a one-year difference in refresh timing can shift the current-year base for categories with steady price movement.
Benchmark comparison
| Source | Market Size | Gaps in Research Methodology |
|---|---|---|
| Mordor Intelligence | USD 16.23 B (2026) | |
| Industry Publisher A | USD 15.96 B (2025) | Uses a different base year and forecast window, and the page-level description suggests broader country groupings that can change currency timing and realized pricing assumptions versus a procedure-to-product conversion. |
| Healthcare Publisher B | USD 15.65 B (2024) | Anchors sizing to an earlier base year and a higher-growth forecast lens, which can embed faster ASP progression and quicker adoption assumptions before those inputs are rechecked with current procedure mix and care-setting shifts. |
The table indicates that most of the spread is explained by year alignment and what gets counted as part of soft tissue repair spend, rather than disagreement on the overall clinical need. By keeping the model tied to procedure-driven demand, separating matrix mix and pricing, and rechecking assumptions during interviews, we can present a number that is easier to trace and replicate.
Key Questions Answered in the Report
How big is the Global Soft Tissue Repair Market?
The Global Soft Tissue Repair Market size is expected to reach USD 16.23 billion in 2026 and grow at a CAGR of 4.62% to reach USD 20.33 billion by 2031.
Which product segment is expanding most rapidly?
Tissue matrices, encompassing biologic and hybrid meshes, are projected to grow at a 5.15% CAGR through 2031.
Who are the key players in Global Soft Tissue Repair Market?
Arthrex, Inc., Boston Scientific Corporation, Stryker, Medtronic and Baxter International Inc. are the major companies operating in the Global Soft Tissue Repair Market.
Why are ASCs important for market growth?
ASCs now perform the majority of U.S. surgeries and offer lower costs and faster turnarounds, driving device adoption optimized for outpatient use.
Which region has the biggest share in Global Soft Tissue Repair Market?
In 2025, the North America accounts for the largest market share in Global Soft Tissue Repair Market.