Social Gaming Market Size and Share
Market Overview
| Study Period | 2020 - 2031 |
|---|---|
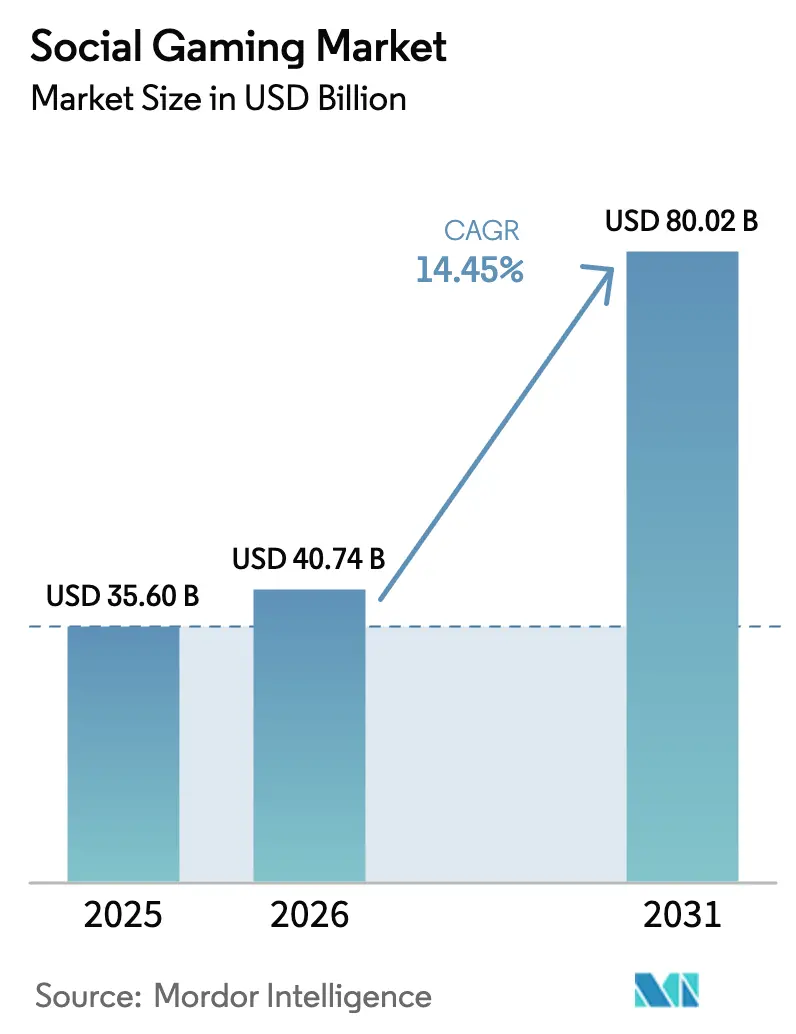
| Market Size (2026) | USD 40.74 Billion |
| Market Size (2031) | USD 80.02 Billion |
| Growth Rate (2026 - 2031) | 14.45% CAGR |
| Fastest Growing Market | Asia Pacific |
| Largest Market | Asia Pacific |
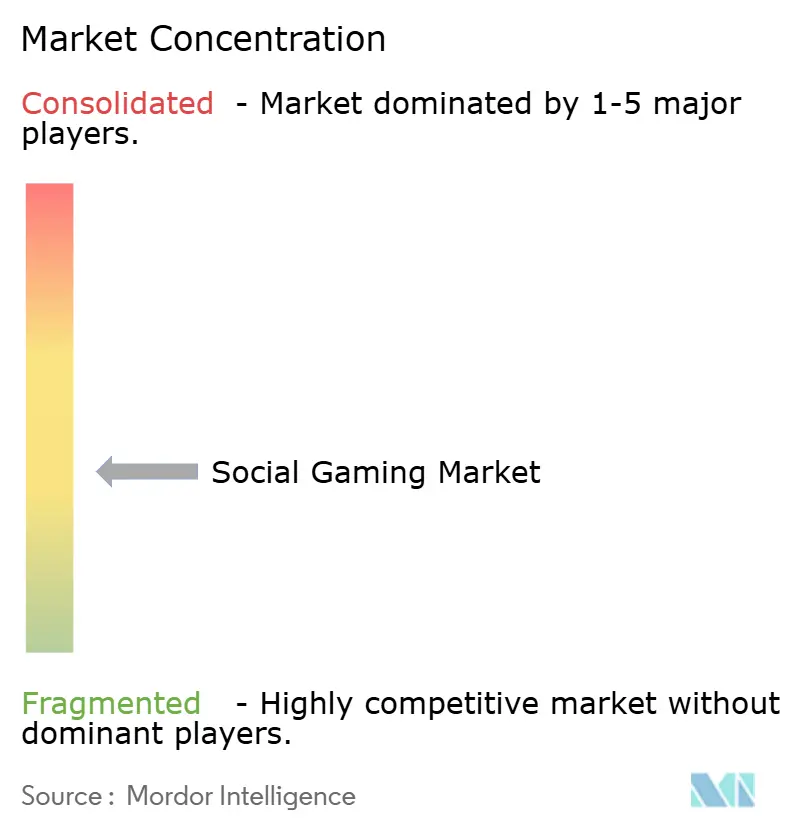
| Market Concentration | Medium |
Major Players*Disclaimer: Major Players sorted in no particular order Image © Mordor Intelligence. Reuse requires attribution under CC BY 4.0. | |
Social Gaming Market Analysis by Mordor Intelligence
The Social Gaming Market size was valued at USD 35.60 billion in 2025 and estimated to grow from USD 40.74 billion in 2026 to reach USD 80.02 billion by 2031, at a CAGR of 14.45% during the forecast period (2026-2031).[1]European Commission, “Key Principles on In-Game Virtual Currencies,” commission.europa.euRobust 5G roll-outs are removing latency barriers, blockchain-enabled play-to-earn models are opening fresh income streams for players, and built-in live-streaming tools are allowing creators to monetise in-game activity. Evolving guidelines on virtual currencies in the European Union are forcing publishers to rethink pricing transparency, while China’s stricter minor-protection rules are nudging local leaders toward overseas markets. Intensifying competition centres on technology stacks: AI-driven content tools, cross-platform cloud services, and creator-economy revenue sharing are becoming decisive factors in user acquisition and retention. Asia-Pacific keeps its leadership, yet North America and Europe are closing the gap as cloud infrastructure and alternative app-store policies lift barriers for new entrants.
Key Report Takeaways
- By game type, casual titles led with 37.55% of social gaming market share in 2025, while role-playing games are forecast to expand at a 16.05% CAGR to 2031.
- By platform, mobile devices commanded 71.55% of the social gaming market share in 2025; console gaming is advancing at a 16.6% CAGR through 2031.
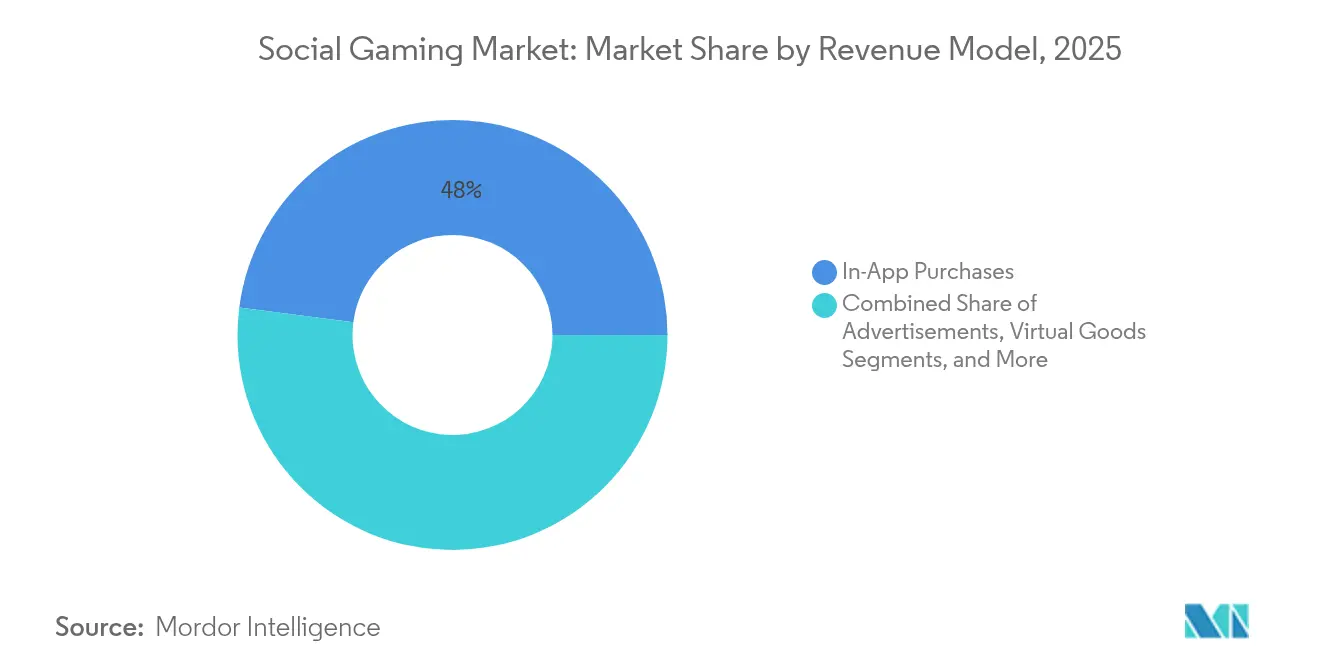
- By revenue model, in-app purchases accounted for 47.95% of 2025 revenue, whereas subscriptions are climbing at a 18.3% CAGR to 2031.
- By age group, the 19-25 cohort held 39.65% share in 2025, while the 26-35 segment is rising fastest at a 15.55% CAGR.
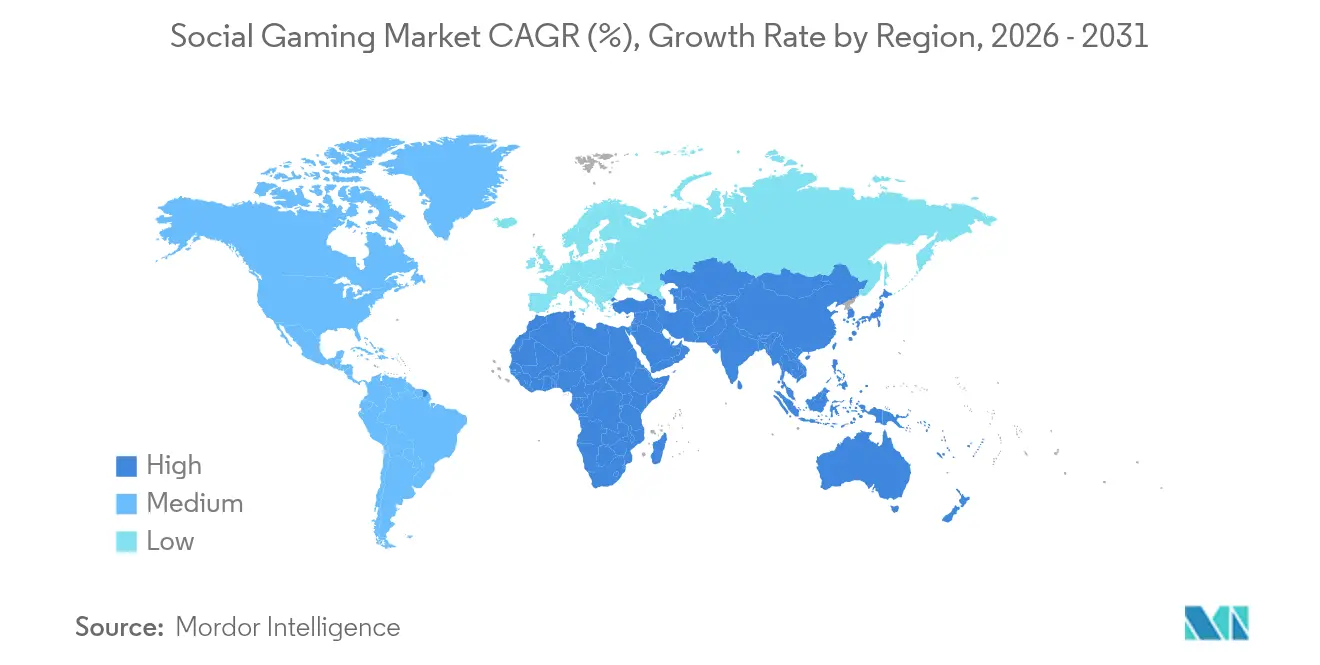
- By geography, Asia-Pacific retained 46.40% share and is projected to post a 17.1% CAGR to 2031.
Note: Market size and forecast figures in this report are generated using Mordor Intelligence’s proprietary estimation framework, updated with the latest available data and insights as of 2026.
Global Social Gaming Market Trends and Insights
Drivers Impact Analysis*
| Driver | (~) % Impact on CAGR Forecast | Geographic Relevance | Impact Timeline |
|---|---|---|---|
| Accelerated 5G roll-outs boosting latency-free multiplayer | +2.80% | Global, early gains in North America and Europe | Medium term (2-4 years) |
| Live-streaming and influencer-led game rooms | +2.10% | Asia-Pacific and North America | Short term (≤ 2 years) |
| Social features in hyper-casual titles | +1.90% | Asia-Pacific, global spill-over | Short term (≤ 2 years) |
| Cross-platform cloud gaming expansion | +1.70% | North America and Europe | Medium term (2-4 years) |
| Blockchain-based play-to-earn adoption | +1.40% | Latin America, rising in Asia-Pacific | Long term (≥ 4 years) |
| Brand-led in-game events and sponsorships | +1.20% | Middle East and North Africa, global reach | Medium term (2-4 years) |
| Source: Mordor Intelligence | |||
Accelerated 5G roll-outs boosting latency-free multiplayer
Sub-10 millisecond mobile latency is erasing the historic advantage of wired platforms, enabling console-grade experiences on smartphones. [2]Andrew Kernahan, “Vodafone Push 5G Broadband Speeds to 5Gbps via Upper 6GHz Band,” ispreview.co.uk Battle-royale and MMO formats that rely on split-second reactions are now flourishing on mobile, prompting console makers to rethink hardware-centric strategies. In markets with early 5G availability such as South Korea, user migration to mobile-first social platforms has been rapid, pushing publishers to prioritise cloud-optimised code bases. Device makers are responding with gaming-focused smartphones that integrate cooling systems and trigger buttons, amplifying the trend.
Live-streaming and influencer-led game rooms
The convergence of play and broadcast has unlocked creator-economy revenues far exceeding one-time purchases. Twitch’s USD 46 billion valuation highlights the scale investors ascribe to interactive entertainment that fuses content and commerce. Developers embedding “go-live” buttons directly in menus shorten the path from gameplay to monetisation, allowing popular players to secure donations and sponsorships without leaving the title. The feedback loop attracts aspirational newcomers, fuelling viral adoption and boosting average revenue per paying user. Asia’s mobile-first audiences are particularly receptive to streamer-driven in-game events that combine celebrity culture with social status.
Social features in hyper-casual titles
Simple tap-and-swipe mechanics historically suffered from two-day churn, yet adding guild chat, leaderboards, and cooperative challenges raises user lifetime value by 40-60%. In markets such as Indonesia and Vietnam, where peer recognition carries cultural weight, publishers report session lengths tripling after integrating lightweight social loops. Lower installation sizes keep acquisition costs modest, while multiplayer content creates an anchor that reduces switching. Monetisation shifts from aggressive ad placements to cosmetic items that signal group affiliation, improving user sentiment and retention simultaneously.
Cross-platform cloud gaming expansion
Unified account progression is dissolving the old silos between mobile, PC, and console. Microsoft’s renewed pact with NetEase reintroduces Blizzard franchises to China and showcases how cloud delivery bypasses physical distribution constraints. The strategy compresses launch windows, cuts development duplication, and multiplies addressable audiences. In North America and Europe, subscription bundles that package cloud access with community perks are driving attachment rates, steering the social gaming market toward ecosystem competition rather than single-title showdowns.
Restraints Impact Analysis*
| Restraint | (~) % Impact on CAGR Forecast | Geographic Relevance | Impact Timeline |
|---|---|---|---|
| Loot-box scrutiny by EU regulators | -1.80% | Europe with global spill-over | Short term (≤ 2 years) |
| Teen online-safety play-time limits | -1.50% | U.S. and China, expanding | Medium term (2-4 years) |
| App-store ad-tracking restrictions | -1.10% | Global, iOS-heavy markets | Short term (≤ 2 years) |
| Infrastructure gaps in Sub-Saharan Africa | -0.90% | Sub-Saharan Africa | Long term (≥ 4 years) |
| Source: Mordor Intelligence | |||
Loot-box scrutiny by EU regulators
March 2025 guidelines outlaw pricing obfuscation and mandate clear real-money equivalents for virtual items. Compliance costs are squeezing smaller studios, while larger publishers are steering users toward battle-pass systems that yield 20-30% less per capita spend. Parallel enforcement in the United States, exemplified by the FTC’s USD 20 million HoYoverse settlement, signals a global shift. Monetisation redesigns are therefore imminent, lifting barriers for new entrants that build without legacy loot-box revenue dependence.
Teen online-safety play-time limits
China’s 15-hour monthly cap for minors cut the most engaged demographic sharply, with Tencent logging a 96% drop in under-18 playtime. Similar proposals in parts of the United States and Australia are accelerating investment in robust age-verification platforms that raise acquisition costs. Publishers are pivoting toward adult-oriented narratives and competitive events to offset youth spend declines, yet these user groups exhibit lower frequency and shorter sessions, tempering growth.
*Our forecasts treat driver/restraint impacts as directional, not additive. The impact forecasts reflect baseline growth, mix effects, and variable interactions.
Segment Analysis
By Game Type: Casual Dominance with Role-Playing Acceleration
Casual titles represented 37.55% of the social gaming market in 2025, translating into revenue of nearly USD 13.4 billion and securing the largest audience footprint. Their one-tap mechanics and meme-driven marketing lower the barrier to entry, allowing rapid virality across social timelines. Despite scale, growth is moderating as saturation builds. Conversely, role-playing games (RPGs) are projected to post a 16.05% CAGR through 2031, lifted by co-operative raids, episodic narratives, and expansive cosmetic catalogues. Cross-media partnerships such as NetEase’s Marvel Rivals, which drew 10 million sign-ups within weeks, demonstrate the pull of recognisable IP for user acquisition. Strategy and simulation genres are adopting live-service updates and user-generated content to capture community momentum once restricted to RPGs, blurring rigid category boundaries.
RPGs benefit from social loot runs and shared hubs that extend sessions far beyond story completion, anchoring players inside monetisable ecosystems. Casual and puzzle creators increasingly graft clan races and asynchronous duels onto their lightweight loops, echoing RPG retention tactics. As development toolkits democratise network coding, indie studios can integrate guild chat without heavy servers, intensifying competition. The social gaming market therefore sees convergence, where hit franchises mix mechanics from multiple genres to maintain fresh content cadences and stave off churn.


By Platform: Mobile Lead Meets Console Resurgence
Mobile devices accounted for 71.55% of revenue in 2025, enabled by near-ubiquitous smartphones and app-store payment rails. The social gaming market size attributed to mobile platforms stood around USD 25.5 billion in the base year, reflecting both advertising and in-app micro-transactions. Yet handheld-hybrid consoles such as Nintendo Switch and Steam Deck are fuelling a 16.6% CAGR for console-linked experiences through 2031. Their portability marries living-room quality with on-the-go sessions, redefining how and where players connect socially. PC remains the anchor for hard-core e-sports yet faces competition from browser-based streaming that delivers comparable frame rates without costly GPU upgrades.
Platform convergence is reshaping release pipelines: studios now target simultaneous mobile, console, and PC launches, using cloud saves to let players switch screens mid-session. Sony’s equity stake in Carry1st underlines console makers’ shift toward service-centric expansion in emerging economies. Payment localisation, lower-priced hardware bundles, and flexible financing are designed to unlock middle-class demand where disposable incomes are rising. As data caps fall and 5G widens, multiplayer fidelity on mobile further narrows the experiential gap, making ecosystem perks rather than raw graphics the decisive factor in platform choice.
By Revenue Model: Subscription Momentum Challenges One-Off Spend
In-app purchases retained 47.95% revenue share in 2025, yet the subscription cohort is climbing at a 18.3% CAGR as publishers court predictable cash flows. The social gaming market size derived from subscriptions is projected to surpass USD 17.6 billion by 2031, mirroring the success of battle-pass tiers that bundle cosmetics, season tickets, and currency stipends. Electronic Arts reported that live services made up 73% of fiscal 2024 net sales, highlighting investor preference for steadier earnings. Regulatory headwinds against loot boxes are nudging designers toward transparent cosmetic shops, while ad-tracked lead-generation formats emerge cautiously in markets where privacy laws permit granular profiling.
Publisher economics are increasingly tied to churn management rather than upfront unit sales. Monthly passes encourage habitual log-ins through daily quests, ensuring advertising impressions and community vitality. Smaller studios often partner with white-label subscription platforms to share infrastructure costs, accelerating consolidation as ecosystem holders gain bargaining power. Hybrid monetisation—offering free tiers, optional passes, and premium cosmetic vaults—has become common, letting users scale spending to commitment levels while keeping the barrier to trial low.
By Age Group: Working Professionals Extend Lifetime Value
The 19-25 age band retained 39.65% of the active base in 2025, buoyed by campus broadband and high social-media penetration. However, the 26-35 cohort is expanding at 15.55% CAGR as millennial professionals weave gaming into after-work routines and weekend hangouts. Rising disposable income allows this segment to subscribe to multiple passes and purchase high-value skins, elevating ARPU. Above-35 players represent the fastest numerical addition, often drawn in by family-friendly co-op titles and wellness-themed social spaces.
Roblox’s 97.8 million daily active users in Q1 2025, with 20.2 million paying, illustrate cross-generational stickiness when user-generated content tools let creators monetise imagination. Developers are thus adding sandbox editors and tipping systems to appeal to entrepreneurial users, multiplying content supply at low marginal cost. Age-verification requirements, while adding onboarding friction, also reassure parents and regulators, making all-ages platforms more sustainable over the long haul.
Geography Analysis
Asia-Pacific contributed 46.40% of global revenue in 2025, translating into close to USD 16.5 billion. The region is forecast to expand at 17.1% CAGR, led by rising 5G coverage, affordable Android handsets, and a culture that embraces game-centric socialising. Chinese publishers, despite stricter domestic youth-protection laws, recorded double-digit overseas growth by pairing popular IP with local payment skins. India’s low-price data plans and Southeast Asia’s esports fandom add further momentum, compensating for plateauing spend in mature Japan and South Korea.
North America and Europe together account for roughly one-third of 2025 turnover, yet cloud distribution and alternative app-store schemes are accelerating uptake. The Digital Markets Act allows third-party payment storefronts on iOS, trimming platform fees and boosting publisher margins. United States gamers benefit from early 5G and high console ownership, supporting cross-platform loyalty programs. European regulators, while tough on loot boxes, have encouraged transparent pricing that strengthens customer trust, fostering higher adoption of season passes and subscriptions.
Latin America and the Middle East are emerging hot-spots. Volatile local currencies have inspired play-to-earn experiments, turning gaming into supplemental income in Brazil and Argentina. The Middle East’s youthful demographics and expanding fibre footprints are luring international tournaments and studio outposts. Sub-Saharan Africa, although still hampered by inconsistent connectivity, is projected to unlock substantial multiplayer communities once the USD 10 billion operator investment in 5G infrastructure materialises. Localised micro-transaction pricing and carrier billing will be key to capturing first-time gamers in these high-growth regions.

Competitive Landscape
The social gaming market shows moderate fragmentation, with no single player controlling more than one-tenth of revenue. Legacy console majors such as Sony and Microsoft are moving beyond hardware, bundling cloud access, creator hubs, and cross-save support to keep users inside walled gardens. Mobile-native powerhouses Tencent and NetEase leverage AI matchmaking and targeted advertising to sustain engagement, while Roblox exemplifies the rise of user-generated content ecosystems that pay developers USD 280-300 million per quarter.
AI is emerging as the competitive fulcrum. Procedural level design cuts production timelines, while automated moderation keeps chat rooms safe without ballooning head-count. Companies with proprietary data and compute resources enjoy a widening moat. Strategic alliances are gathering pace: Microsoft’s cloud tie-up with NetEase reopens the Chinese market for Blizzard titles, demonstrating how access to regional IP and regulatory expertise can outweigh proprietary engines.
White-space remains in infrastructure-light regions and non-entertainment verticals. Education and enterprise collaboration are testing gamified social layers that borrow reward mechanics from consumer titles. Start-ups that specialise in low-bandwidth netcode or localised payment gateways are attractive acquisition targets for big platforms seeking last-mile reach. The competitive outlook therefore centres on ecosystem depth, compliance agility, and the ability to turn players into creators.
Social Gaming Industry Leaders
Zynga Inc.
Activision Blizzard, Inc.
Supercell Oy
GREE, Inc.
Electronic Arts Inc.
- *Disclaimer: Major Players sorted in no particular order

Recent Industry Developments
- May 2025: Tencent reported Q1 2025 gaming revenue of RMB 59.5 billion (USD 8.2 billion), up 23.7% year over year, driven by AI-enabled advertising optimisation.
- May 2025: Electronic Arts guided fiscal 2026 bookings to USD 7.6-8 billion on the back of a new Battlefield release and strong EA Sports momentum.
- March 2025: The EU Consumer Protection Cooperation Network issued binding guidelines that require real-currency price disclosure for virtual items.
- February 2025: Roblox closed Q4 2024 with USD 988.2 million in revenue and 85.3 million daily users, projecting sustained engagement for early 2025.


Global Social Gaming Market Report Scope
The social gaming market is experiencing rapid growth, driven by the widespread adoption of mobile devices and the increasing integration of social media platforms within games. With the growing influence of mobile devices and social media integration, the market is expected to expand globally, catering to diverse user demographics. Key opportunities lie in advertising revenue, in-app purchases, and partnerships with social media platforms, all of which fuel further market development and player engagement.
The Social Gaming Market is segmented by game type (casual games, strategy games, simulation games, role-playing games (RPGs), other game types), platform (mobile devices (smartphones, tablets), PCs/laptops, consoles), revenue model (advertisements, virtual goods, lead generation, subscription services, in-app purchases), age group (13 to 18 years. 19 to 25 years, 26 to 35 years, above 35 years), and geography (North America, Europe, Asia Pacific, Latin America, Middle East and Africa). The market sizes and forecasts are provided in terms of value (USD) for all the above segments.
| Casual Games |
| Strategy Games |
| Simulation Games |
| Role-Playing Games (RPG) |
| Other Game Types |
| Mobile Devices (Smartphones, Tablets) |
| PCs / Laptops |
| Consoles |
| In-App Purchases |
| Advertisements |
| Virtual Goods |
| Subscription Services |
| Lead Generation |
| 13-18 Years |
| 19-25 Years |
| 26-35 Years |
| Above 35 Years |
| North America | United States |
| Canada | |
| Mexico | |
| South America | Brazil |
| Argentina | |
| Rest of South America | |
| Europe | Germany |
| United Kingdom | |
| France | |
| Italy | |
| Spain | |
| Rest of Europe | |
| Asia-Pacific | China |
| Japan | |
| South Korea | |
| India | |
| Australia | |
| New Zealand | |
| Rest of Asia-Pacific | |
| Middle East and Africa | United Arab Emirates |
| Saudi Arabia | |
| South Africa | |
| Rest of Middle East and Africa |
| By Game Type | Casual Games | |
| Strategy Games | ||
| Simulation Games | ||
| Role-Playing Games (RPG) | ||
| Other Game Types | ||
| By Platform | Mobile Devices (Smartphones, Tablets) | |
| PCs / Laptops | ||
| Consoles | ||
| By Revenue Model | In-App Purchases | |
| Advertisements | ||
| Virtual Goods | ||
| Subscription Services | ||
| Lead Generation | ||
| By Age Group | 13-18 Years | |
| 19-25 Years | ||
| 26-35 Years | ||
| Above 35 Years | ||
| Geography | North America | United States |
| Canada | ||
| Mexico | ||
| South America | Brazil | |
| Argentina | ||
| Rest of South America | ||
| Europe | Germany | |
| United Kingdom | ||
| France | ||
| Italy | ||
| Spain | ||
| Rest of Europe | ||
| Asia-Pacific | China | |
| Japan | ||
| South Korea | ||
| India | ||
| Australia | ||
| New Zealand | ||
| Rest of Asia-Pacific | ||
| Middle East and Africa | United Arab Emirates | |
| Saudi Arabia | ||
| South Africa | ||
| Rest of Middle East and Africa | ||


Key Questions Answered in the Report
What is the current size of the social gaming market?
The social gaming market size reached USD 40.74 billion in 2026 and is projected to grow to USD 80.02 billion by 2031.
Which segment is expanding fastest within the social gaming market?
Role-playing games are expected to record the quickest gains with a 16.05% CAGR between 2026-2031.
Why are subscriptions gaining ground as a revenue model?
Subscriptions provide predictable cash flows and comply more easily with new transparency rules, supporting a 18.3% CAGR through 2031.
How will 5G influence future growth?
Widespread 5G enables latency below 10 milliseconds, allowing console-grade multiplayer experiences on mobile and adding approximately 2.8 percentage points to forecast CAGR.
Which region leads the social gaming market?
Asia-Pacific held a 46.40% revenue share in 2025 and is set to grow at a 17.1% CAGR to 2031, maintaining its lead despite regulatory headwinds.
What regulatory changes should publishers monitor most closely?
The European Union’s virtual currency guidelines and China’s minor play-time limits are the most consequential, both reshaping monetisation and player-time strategies globally.
Page last updated on:


