Social Media Listening Market Size and Share
Market Overview
| Study Period | 2020 - 2031 |
|---|---|
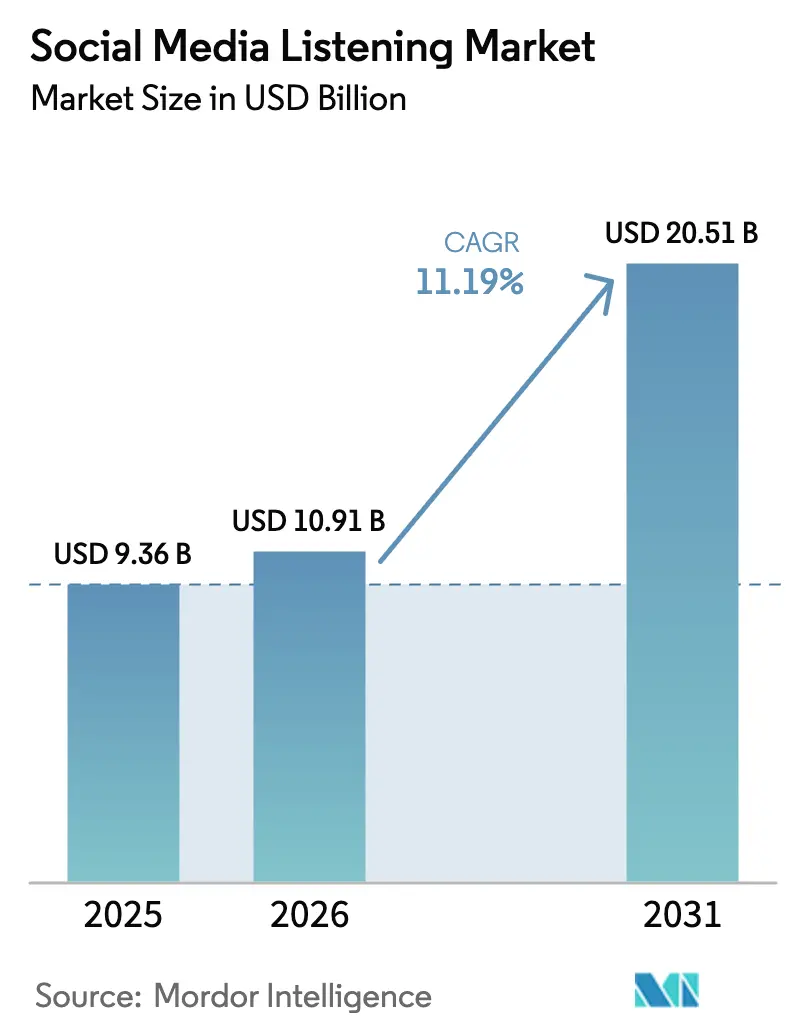
| Market Size (2026) | USD 10.91 Billion |
| Market Size (2031) | USD 20.51 Billion |
| Growth Rate (2026 - 2031) | 11.19% CAGR |
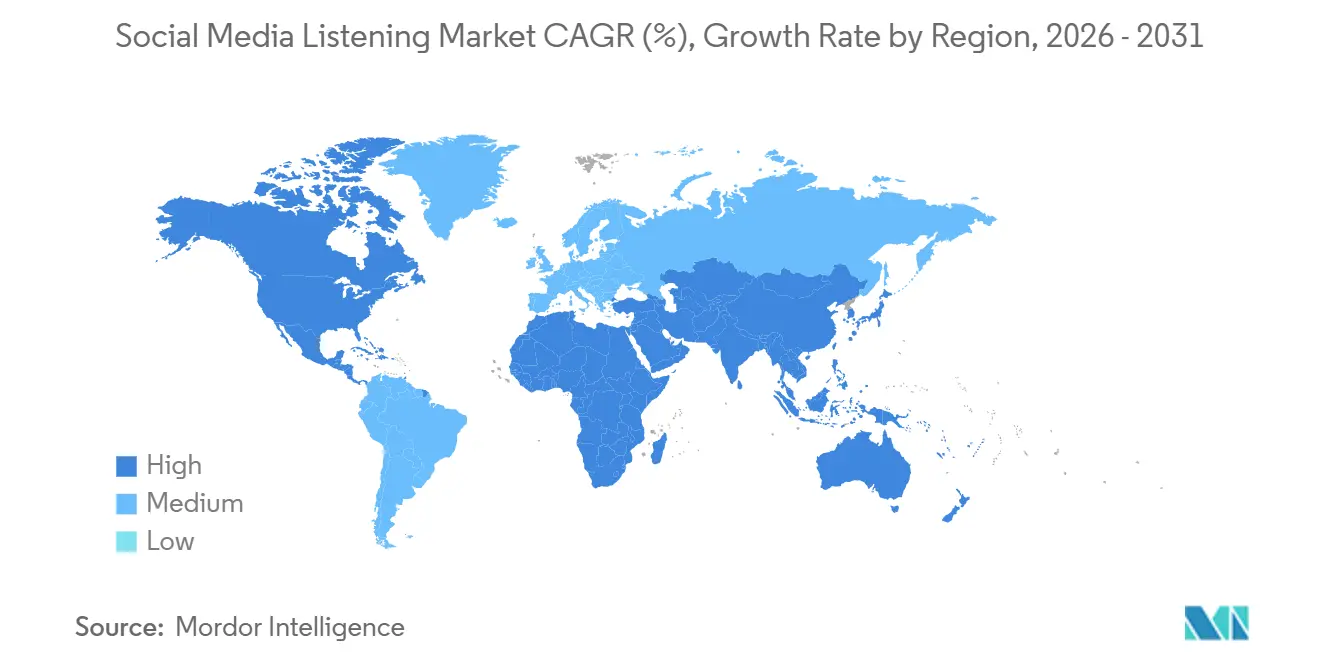
| Fastest Growing Market | Asia-Pacific |
| Largest Market | North America |
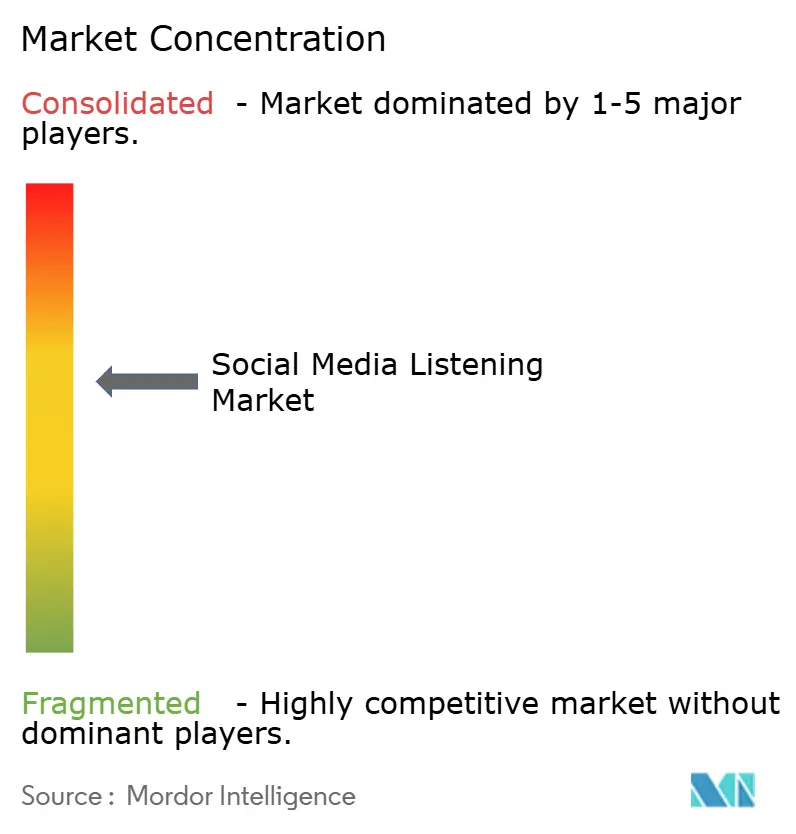
| Market Concentration | Medium |
Major Players *Disclaimer: Major Players sorted in no particular order Image © Mordor Intelligence. Reuse requires attribution under CC BY 4.0. | |
Social Media Listening Market Analysis by Mordor Intelligence
The social media analytics market size was valued at USD 9.36 billion in 2025 and estimated to grow from USD 10.91 billion in 2026 to reach USD 20.51 billion by 2031, at a CAGR of 11.19% during the forecast period (2026-2031). The growth reflects enterprises’ transition from vanity metrics to predictive intelligence that guides product, crisis, and competitive decisions. Advertisers are funneling larger budgets into short-form video, forcing analytics platforms to process rich multimedia signals rather than text alone. At the same time, usage-based API pricing on major networks is concentrating demand around vendors that bundle listening, publishing, and data-platform integrations. Generative AI now classifies nuance across languages and formats, raising the bar for accuracy while boosting return on ad spend. Compliance frameworks such as GDPR and CCPA raise operating costs yet also create moats that shield established providers from new entrants.
Key Report Takeaways
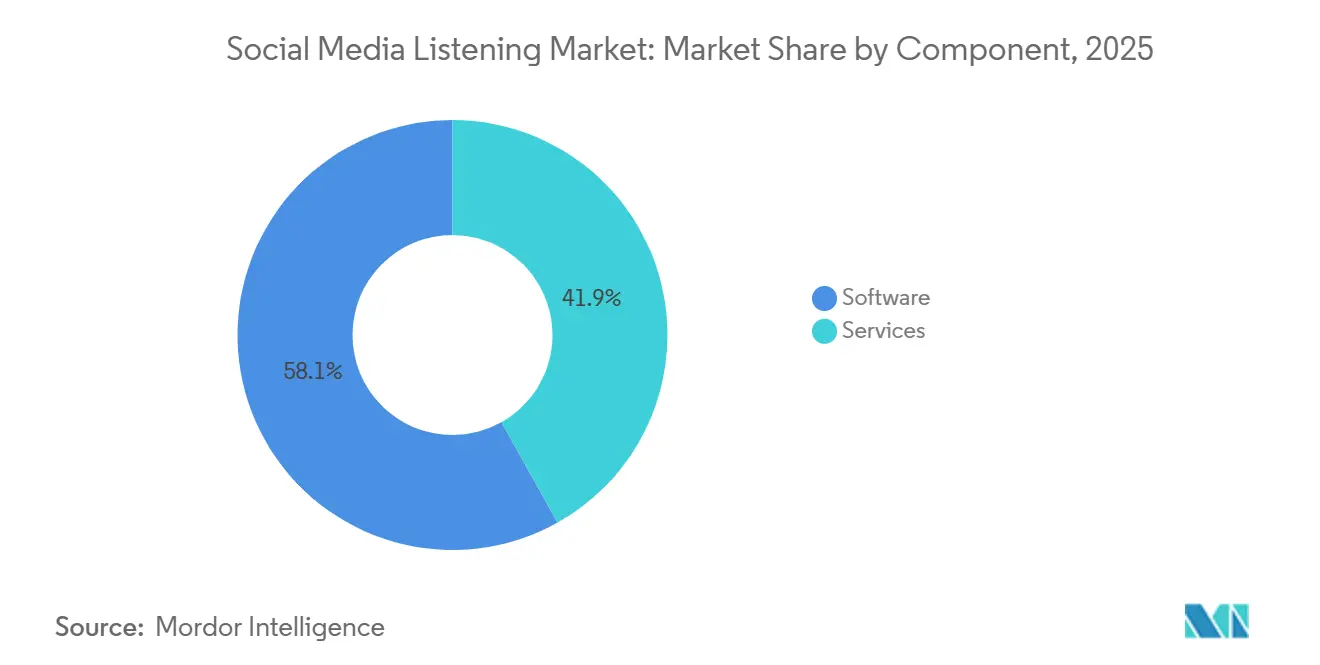
- By component, software led with 58.13% of 2025 revenue, while services are projected to advance at a 12.76% CAGR through 2031.
- By organization size, large enterprises accounted for 70.11% of 2025 deployments, whereas SMEs are forecast to expand at an 11.23% CAGR to 2031.
- By analytics type, text analytics captured 46.42% of 2025 revenue and video analytics is rising at a 13.29% CAGR during 2026-2031.
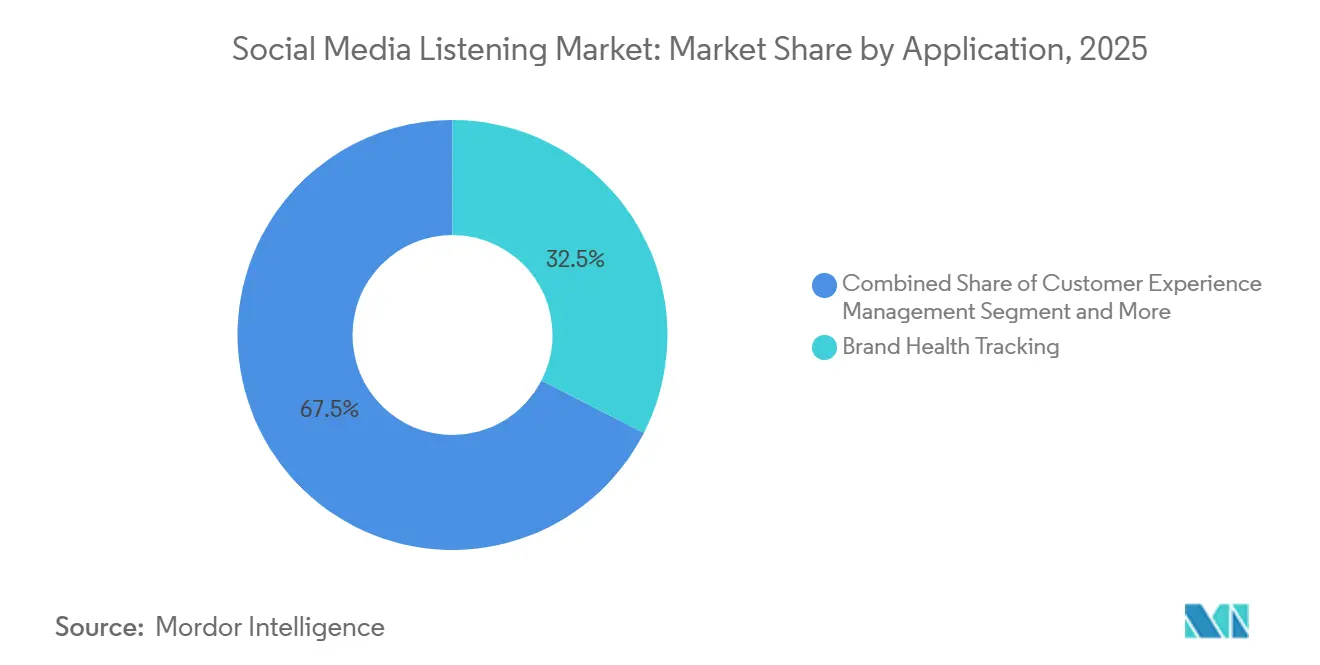
- By application, brand health tracking held 32.53% share in 2025 and lead generation and sales monitoring is set to grow at a 13.82% CAGR through 2031.
- By industry vertical, retail and e-commerce commanded 28.92% of 2025 spending and travel and hospitality is projected to climb at a 14.11% CAGR to 2031.
- By geography, North America represented 49.71% of 2025 revenue, while Asia-Pacific is on track for a 13.52% CAGR during 2026-2031.
Note: Market size and forecast figures in this report are generated using Mordor Intelligence’s proprietary estimation framework, updated with the latest available data and insights as of 2026.
Global Social Media Listening Market Trends and Insights
Drivers Impact Analysis*
| Driver | (~) % Impact on CAGR Forecast | Geographic Relevance | Impact Timeline |
|---|---|---|---|
| Rising digital ad budgets shifting from TV to social video | +2.8% | Global with strength in North America, Europe, Asia-Pacific | Medium term (2-4 years) |
| Generative-AI sentiment classification enhancing retail ROI | +2.3% | Global, early in North America and Western Europe, rapid in Asia-Pacific retail hubs | Short term (≤ 2 years) |
| Brand-risk mitigation amid influencer-led crises | +1.6% | Global, strongest in developed markets | Short term (≤ 2 years) |
| Regulatory response-time mandates for BFSI complaints | +1.4% | Europe, United States, United Kingdom, India, Australia | Medium term (2-4 years) |
| Gaming and livestreaming surge creating rich multimedia data sets | +1.8% | Global with epicenters in Asia-Pacific, North America, Europe | Medium term (2-4 years) |
| Open-API martech ecosystems driving platform consolidation | +1.5% | Global led by North America and Europe, expanding to Asia-Pacific and Middle East | Long term (≥ 4 years) |
| Source: Mordor Intelligence | |||
Rising Digital Ad Budgets Shifting From TV to Social Video
Brands are reallocating spend toward vertical video on TikTok, Instagram Reels, and YouTube Shorts, driving a 14.6% year-over-year jump in social video revenue in 2026.[1]Interactive Advertising Bureau, “IAB Internet Advertising Revenue Report 2026,” iab.com Platform-native formats yield swipe-up, share, and comment signals that traditional spots cannot provide, turning every campaign into a live focus group. Consumer packaged goods and direct-to-consumer players now refresh creative mid-flight based on frame-level feedback. This pivot pressures analytics suites to fuse engagement metrics with commerce funnels in real time, a capability limited to full-stack vendors. As linear TV fragments, the social media analytics market increasingly competes on how quickly it converts video sentiment into product, pricing, and media decisions.
Generative-AI Sentiment Classification Enhancing Retail ROI
Retailers deploy transformer models that map posts to fine-grained emotions such as frustration or urgency, unlocking inventory and pricing insights. A European fashion chain using Azure OpenAI identified a 22% spike in “fit anxiety” mentions, launched an AR sizing tool, and cut return rates by 18%.[2]Microsoft Corp., “Azure OpenAI Service in Dynamics 365,” microsoft.com Databricks reported a 3.2-times return on ad spend where Mosaic AI replaced rule-based engines.[3]Databricks Inc., “Mosaic AI Performance Report,” databricks.com Early pilots show that generative AI detects sarcasm and idioms at scale, yet production rollouts lag amid hallucination concerns. Vendors counter by adding human-in-the-loop validation and model explainability, accelerating enterprise confidence and fueling service revenues.
Brand-Risk Mitigation Amid Influencer-Led Crises
A single controversial post can wipe months of equity, prompting always-on monitoring that flags risk within minutes. Meltwater’s acquisition of Klear added workflows that cross-reference past controversies before contracts are signed. A 2025 incident saw a beauty brand’s sentiment score fall 40% in six hours, yet automated pause rules and pre-drafted apologies contained fallout to one news cycle. Sprinklr’s scenario-planning modules simulate crisis trajectories, letting teams rehearse responses and store pre-approved statements. Industries with safety stakes such as automotive now view sub-hour detection as a core compliance metric.
Regulatory Response-Time Mandates for BFSI Complaints
SRegulators equate social complaints with formal grievances, imposing strict acknowledgment and resolution clocks. The United Kingdom’s FCA requires acknowledgment within 24 hours, mirroring moves by India’s RBI and Australia’s ASIC. A European bank routed 19% of complaints originating on social channels through Brandwatch’s automation to meet deadlines. Vendors weave audit trails and case management directly into listening dashboards, turning compliance from a cost center into a selling point. The pressure catalyzes adoption of integrated analytics workflows across banking, insurance, and payments.
Restraints Impact Analysis*
| Restraint | (~) % Impact on CAGR Forecast | Geographic Relevance | Impact Timeline |
|---|---|---|---|
| Fragmented data-privacy regimes (GDPR, CCPA, PDPA) | -1.9% | Global, acutely complex in Europe, California, Singapore, Brazil | Long term (≥ 4 years) |
| Multilingual AI accuracy gaps for low-resource languages | -1.2% | Global, most severe in Africa, Southeast Asia, South America, Middle East | Medium term (2-4 years) |
| API access fee hikes from X and Meta | -1.1% | Global | Short term (≤ 2 years) |
| Overlap with in-house BI and CDP causing procurement fatigue | -0.9% | Developed markets with mature enterprise stacks | Medium term (2-4 years) |
| Source: Mordor Intelligence | |||
Fragmented Data-Privacy Regimes (GDPR, CCPA, PDPA)
Europe’s GDPR, California’s CCPA, Singapore’s PDPA, and Brazil’s LGPD each impose unique consent and localization rules, forcing platforms to maintain multiple storage zones. Deloitte found 42% of mid-market vendors delayed expansion due to regulatory complexity. Procurement cycles stretch by several months as multinationals audit data flows across borders. Paradoxically, high compliance costs deter newcomers, steering enterprise deals to incumbents that amortize legal spending across large customer bases.
Multilingual AI Accuracy Gaps for Low-Resource Languages
In emerging markets, sentiment visibility suffers as transformer accuracy plummets in Swahili, Tagalog, and other low-resource languages. These languages, often underrepresented in natural language processing models, present significant challenges for accurate sentiment analysis. A 2024 study by JAIR revealed a substantial drop in F1 scores, declining from 89% in English to just 58% in Tagalog. This sharp decrease highlights the limitations of current transformer models in handling linguistic diversity. While Meta's "No Language Left Behind" model has broadened coverage and made strides in addressing these gaps, it hasn't yet made a significant impact on commercial pipelines. As a result, brands grapple with either facing blind spots in their sentiment analysis or incurring the expenses of custom training to improve model performance. This challenge is particularly pronounced in Nigeria, Indonesia, and Peru, where commerce in local languages is on the rise, driven by the growing adoption of vernacular communication in digital and offline transactions.
*Our forecasts treat driver/restraint impacts as directional, not additive. The impact forecasts reflect baseline growth, mix effects, and variable interactions.
Segment Analysis
By Component: Services Scale as Complexity Outpaces In-House Skills
Software captured 58.13% of 2025 revenue in the social media analytics market, reflecting demand for self-service dashboards and open APIs. Yet services revenue is advancing at a 12.76% CAGR as enterprises hire managed analytics teams to handle multilingual nuance and regulatory audits. Professional services increasingly bundle license fees with analyst support, underscoring a hybrid business model. In regulated verticals, every sentiment insight must be defensible, sustaining long-term services contracts even as software becomes more automated.
The shift also fuels cross-sell. Sprinklr’s AI Studio automates response drafting, but brands still lean on integrators to align agents with legal guardrails. Accenture reports that over half of Fortune 500 firms outsource at least one listening workflow, creating stickiness that pure-play software vendors now match by launching in-house consulting arms. The interplay preserves growth for both product and service streams within the social media analytics market.


By Organization Size: SMEs Harness Freemium and Usage-Based Pricing
Large enterprises held 70.11% share in 2025, driven by multi-year deals and deep platform integrations. However, SMEs are scaling at an 11.23% CAGR, widening the social media analytics market footprint through freemium tiers and pay-as-you-go APIs. A bakery chain used Hootsuite’s expanded free plan for cross-channel sentiment without dedicated staff. Vertical-specific tools provide pre-configured dashboards, trimming onboarding to hours.
SMEs also pilot emerging features sooner because governance layers are lighter. Deloitte found they are 1.7 times more likely than large firms to test generative AI sentiment modules. Vendors therefore tier pricing so a USD 99 plan can grow into an enterprise license, ensuring lifetime value even in high-churn direct-to-consumer segments.
By Analytics Type: Video Accelerates Toward Modal Parity
Text analysis remains the anchor, accounting for 46.42% of 2025 sales, but video analytics is projected to rise at a 13.29% CAGR. Brands mine facial expressions, tone, and on-screen cues that text misses, uncovering packaging flaws or unspoken product opinions. A consumer electronics firm found 38% of reviewers frowned during unboxing, exposing a design issue long before surveys caught it.
Talkwalker’s Visual Listening suite merges object detection and optical character recognition to quantify brand imagery, complementing text and audio streams. Multimodal fusion is now essential as TikTok and Reels dominate engagement, pushing vendors toward unified pipelines that boost the social media analytics market size and relevance.
By Application: Lead Generation Surges on Real-Time Intent Signals
Brand tracking led at 32.53% of 2025 spending, yet lead generation is climbing at a 13.82% CAGR as sellers mine social intent before prospects hit web forms. LinkedIn’s Sales Navigator alerts shorten cycles by 11 days when target accounts voice pain points. Crisis management commands premium pricing because uptime and sub-hour detection avert litigation.
Generative AI now writes competitor briefs and response drafts, blurring analysis and activation. Predictive scoring that ranks job changes or budget posts by conversion likelihood is the next frontier, positioning analytics platforms as demand engines and enlarging the social media analytics market.

By Industry Vertical: Travel Rebounds With Hyper-Personalized Engagement
Retail and e-commerce held 28.92% of 2025 revenue, leveraging real-time sentiment to drive pricing and promotion. Travel and hospitality is projected to grow at a 14.11% CAGR as airlines and hotels rebuild loyalty through proactive social service. A European carrier used Brandwatch to spot mobile app complaints and shipped a patch before ratings plunged.
Healthcare taps analytics for patient experience and pharmacovigilance, with Sprinklr surfacing adverse events weeks ahead of official reports. Education, media, and telecom sectors increasingly rely on verticalized dashboards that bake in compliance filters, broadening demand across the social media analytics market.
Geography Analysis
North America contributed 49.71% of 2025 spending, supported by mature martech stacks and stringent privacy laws such as CCPA that require airtight audit trails. Market growth now pivots on upselling video and generative AI modules to consolidated platform users. Canada mirrors United States adoption, while Mexico’s WhatsApp-centric commerce adds new clients, expanding the regional social media analytics market size.
Asia-Pacific is the fastest mover with a 13.52% CAGR expected through 2031. China’s Douyin, India’s vernacular commerce boom, and Japan’s LINE service models drive platform innovation. Alibaba embedded sentiment into Tmall recommendations to tailor offers. Compliance shifts such as India’s Digital Personal Data Protection Act force local data centers, raising costs yet accelerating vendor localization.
Europe’s GDPR grants incumbents a compliance advantage through built-in residency and consent workflows. Automotive, luxury goods, and banking sectors spearhead demand. In the Middle East, sovereign-AI mandates push on-premise deployments in Saudi Arabia and the United Arab Emirates. South America’s Brazil and Argentina leapfrog desktop listening with mobile-first analytics, while Africa’s telecoms initiate text-only pilots before scaling to multimodal, together enlarging the global social media analytics market.

Competitive Landscape
The social media analytics market remains moderately fragmented, with the five largest vendors, Sprinklr, Meltwater, Brandwatch, NetBase Quid, and Talkwalker, collectively generating about 35-40 % of global revenue. Incumbents compete on three levers: breadth of social platform coverage, depth of AI-driven sentiment capabilities, and ease of integration with CRM and customer data platform ecosystems. Buyers increasingly favor suites that bundle listening, publishing, engagement, and data-warehouse connectors in a single contract, forcing point-solution providers either to specialize by vertical or quickly add integration layers.
Strategic moves over the past two years underscore a race to embed generative AI. Sprinklr’s AI Studio now drafts responses, escalates anomalies, and simulates crisis trajectories, trimming average complaint resolution time by nearly one-third in telecom pilots. Meltwater acquired Klear to overlay influencer risk-scoring on its listening engine, enabling marketers to vet creators before signing deals. Brandwatch added case-routing automation that assigns regulated financial complaints to compliance-trained agents within seconds, meeting new response-time mandates in banking and insurance. NetBase Quid sharpened its healthcare proposition by fine-tuning large language models on clinical terminology, while Talkwalker’s Visual Listening suite combines object detection and optical character recognition to quantify logo exposure across billions of images.
Competitive intensity is highest in North America and Europe, where enterprise customers demand multi-language coverage, 24-hour support, and strict service-level agreements for anomaly detection. Emerging regions favor vendors that localize models for low-resource languages and offer usage-based pricing that scales with data volume. Open-API ecosystems further tilt the field toward providers that maintain robust developer portals and out-of-the-box connectors with Salesforce, Adobe, HubSpot, Snowflake, and Databricks. Price competition is squeezing software-only gross margins, prompting leading vendors to bundle consulting, custom model training, and managed services as differentiation levers. Niche upstarts counter by targeting high-growth pockets such as gaming sentiment, healthcare reputation, or travel loyalty, often undercutting incumbents on price while delivering comparable feature depth.
Social Media Listening Industry Leaders
Meltwater
Sprinklr
Brandwatch (Cision LLC)
NetBase Quid
Talkwalker
- *Disclaimer: Major Players sorted in no particular order

Recent Industry Developments
- February 2026: X shifted to usage-based API pricing, prompting a 23% cut in data pulls by mid-market advertisers and spurring vendor consolidation.
- January 2026: Databricks revealed Mosaic AI users achieved 3.2-times return on ad spend, driving retail adoption.
- April 2025: Sprinklr launched AI Studio, automating response drafting and crisis simulation with 30% faster resolutions.
- March 2025: Microsoft integrated Azure OpenAI into Dynamics 365 Customer Insights, enabling AR sizing tools that reduced returns by 18%.


Global Social Media Listening Market Report Scope
Social listening involves analyzing conversations and trends relevant to the user's brand. These include discussions about the user's firm, competitors, and the industry at large. The information gleaned from these discussions is used to make sound marketing decisions.
The Social Media Analytics Market Report is Segmented by Component (Software, and Services), Organization Size (Large Enterprises, and SMEs), Analytics Type (Text, Image, Video, and Voice), Application (Brand Tracking, CX Management, Benchmarking, Lead Generation, Campaign Management, and Crisis Management), Industry Vertical (Retail, BFSI, IT and Telecom, Media, and More), and Geography. The Market Forecasts are Provided in Terms of Value (USD).
| Software |
| Services |
| Large Enterprises |
| Small and Medium-Sized Enterprises |
| Text Analytics |
| Image Analytics |
| Video Analytics |
| Voice and Audio Analytics |
| Brand Health Tracking |
| Customer Experience Management |
| Competitive Benchmarking |
| Lead Generation and Sales Monitoring |
| Campaign Management |
| Crisis Management |
| Retail and E-Commerce |
| BFSI |
| IT and Telecom |
| Media and Entertainment |
| Healthcare and Life Sciences |
| Travel and Hospitality |
| Education |
| Rest of Industry Verticals |
| North America | United States |
| Canada | |
| Mexico | |
| South America | Brazil |
| Argentina | |
| Rest of South America | |
| Europe | Germany |
| United Kingdom | |
| France | |
| Italy | |
| Spain | |
| Rest of Europe | |
| Asia-Pacific | China |
| India | |
| Japan | |
| South Korea | |
| Australia and New Zealand | |
| Rest of Asia-Pacific | |
| Middle East | Saudi Arabia |
| United Arab Emirates | |
| Turkey | |
| Rest of Middle East | |
| Africa | South Africa |
| Nigeria | |
| Egypt | |
| Rest of Africa |
| By Component | Software | |
| Services | ||
| By Organization Size | Large Enterprises | |
| Small and Medium-Sized Enterprises | ||
| By Analytics Type | Text Analytics | |
| Image Analytics | ||
| Video Analytics | ||
| Voice and Audio Analytics | ||
| By Application | Brand Health Tracking | |
| Customer Experience Management | ||
| Competitive Benchmarking | ||
| Lead Generation and Sales Monitoring | ||
| Campaign Management | ||
| Crisis Management | ||
| By Industry Vertical | Retail and E-Commerce | |
| BFSI | ||
| IT and Telecom | ||
| Media and Entertainment | ||
| Healthcare and Life Sciences | ||
| Travel and Hospitality | ||
| Education | ||
| Rest of Industry Verticals | ||
| By Geography | North America | United States |
| Canada | ||
| Mexico | ||
| South America | Brazil | |
| Argentina | ||
| Rest of South America | ||
| Europe | Germany | |
| United Kingdom | ||
| France | ||
| Italy | ||
| Spain | ||
| Rest of Europe | ||
| Asia-Pacific | China | |
| India | ||
| Japan | ||
| South Korea | ||
| Australia and New Zealand | ||
| Rest of Asia-Pacific | ||
| Middle East | Saudi Arabia | |
| United Arab Emirates | ||
| Turkey | ||
| Rest of Middle East | ||
| Africa | South Africa | |
| Nigeria | ||
| Egypt | ||
| Rest of Africa | ||


Key Questions Answered in the Report
What is the current growth outlook for social media analytics?
The market is projected to advance from USD 10.91 billion in 2026 to USD 20.51 billion by 2031, reflecting an 11.19 % CAGR driven by the shift to predictive, multimodal intelligence.
Which component segment is expanding the fastest?
Services are growing at a 12.76 % CAGR through 2031 because enterprises need managed analytics that address multilingual nuance and regulatory compliance.
Why are video analytics gaining traction over text analytics?
Short-form video on TikTok, Instagram Reels, and YouTube Shorts captures facial expressions and tone, providing sentiment signals that text alone cannot surface, pushing video analytics to a 13.29 % CAGR.
How are SMEs adopting social media analytics tools?
Freemium tiers and usage-based APIs allow small and medium-sized enterprises to start with low commitment, propelling SME adoption at an 11.23 % CAGR through 2031.
Which regions present the highest future growth opportunity?
Asia-Pacific is forecast to rise at a 13.52 % CAGR, buoyed by China’s short-video boom, India’s vernacular commerce, and Japan’s LINE-centric service models.
How concentrated is vendor market share?
The top five suppliers control roughly 35-40 % of revenue, resulting in a market concentration score of 6 that leaves room for niche and regional challengers.
Page last updated on:


