Social Casino Market Size and Share
Market Overview
| Study Period | 2020 - 2031 |
|---|---|
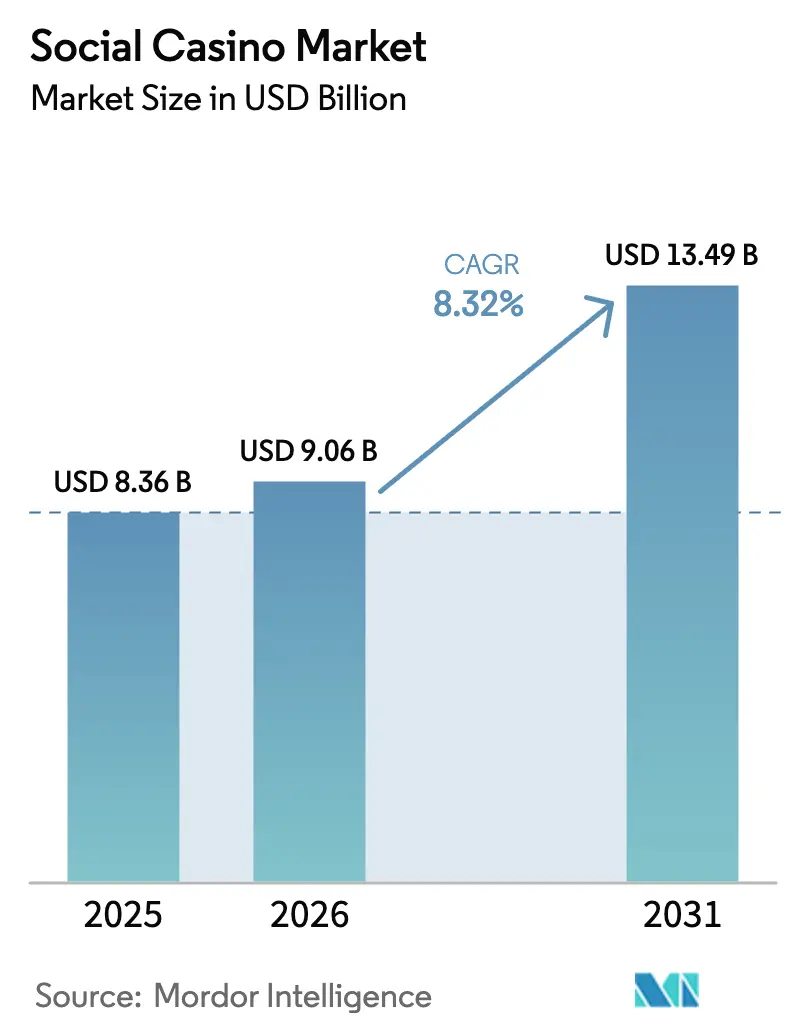
| Market Size (2026) | USD 9.06 Billion |
| Market Size (2031) | USD 13.49 Billion |
| Growth Rate (2026 - 2031) | 8.32% CAGR |
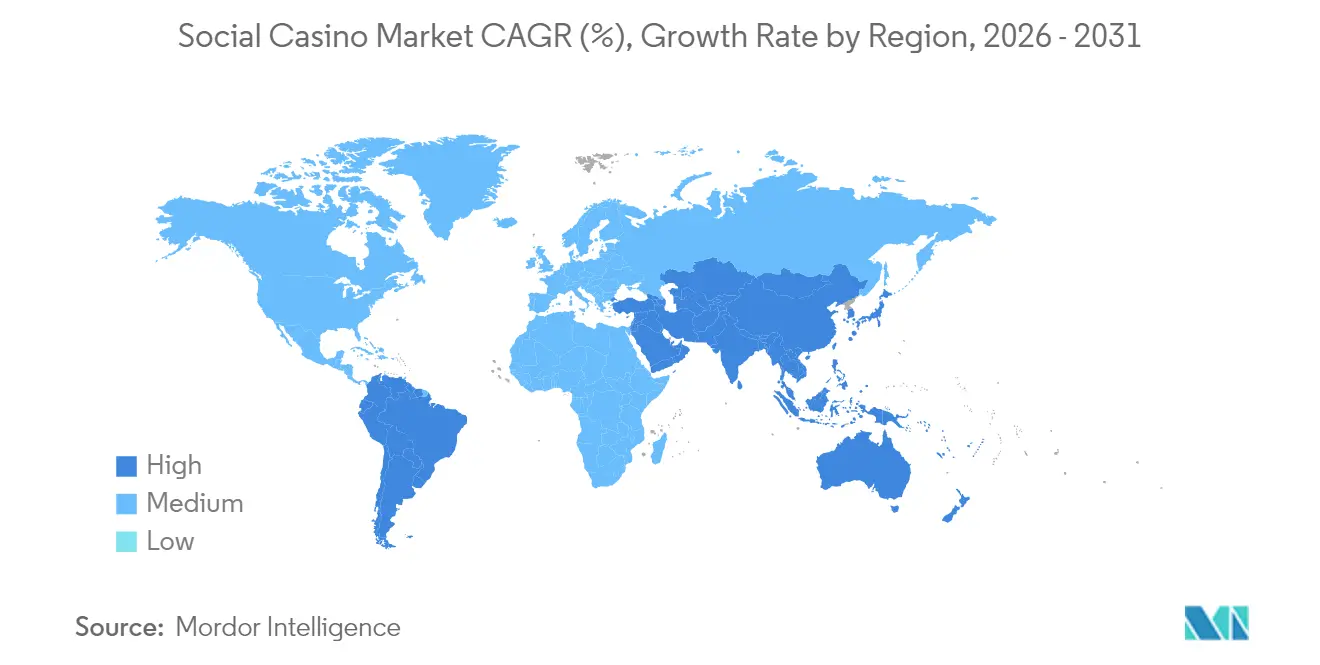
| Fastest Growing Market | Asia Pacific |
| Largest Market | North America |
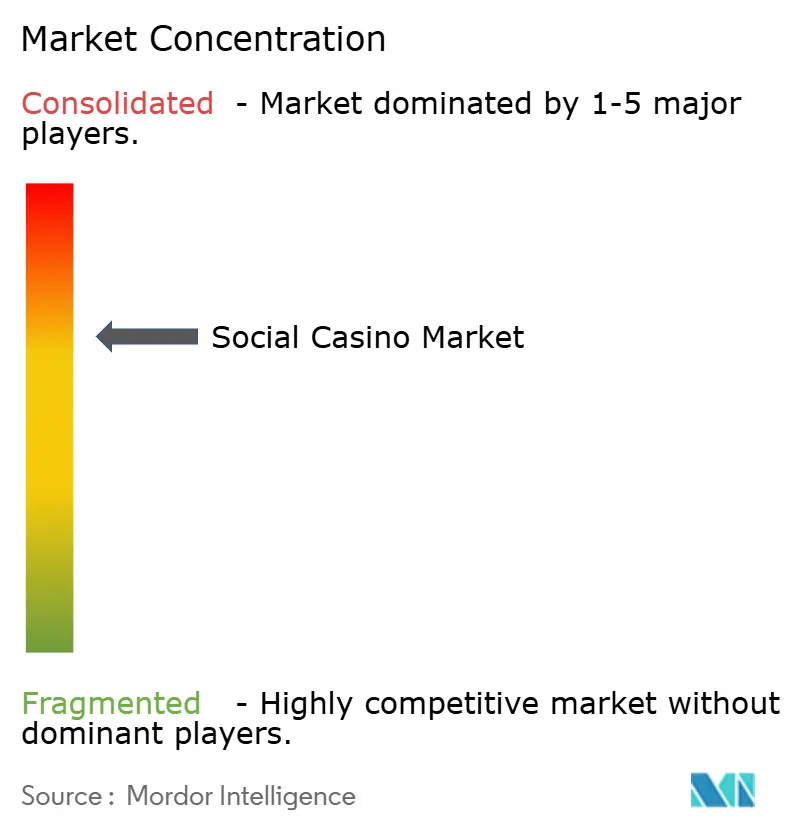
| Market Concentration | Medium |
Major Players *Disclaimer: Major Players sorted in no particular order Image © Mordor Intelligence. Reuse requires attribution under CC BY 4.0. | |
Social Casino Market Analysis by Mordor Intelligence
The social casino market size was valued at USD 8.36 billion in 2025 and estimated to grow from USD 9.06 billion in 2026 to reach USD 13.49 billion by 2031, at a CAGR of 8.32% during the forecast period (2026-2031). This steady rise comes from the industry’s ability to pivot around shifting rules, from North American convergence of social-gaming and real-money gambling to Europe’s new protections on virtual currencies. Premium intellectual-property (IP) slot titles, mobile-first player behavior and cloud-streamed “instant play” in emerging economies are reinforcing revenue momentum. Operators that master cross-platform wallets and gamified retention tools are widening average revenue per user in Asia-Pacific, while North American brands bundle social casino apps with loyalty programs to deepen engagement. Even so, higher user-acquisition costs after IDFA changes and stricter loot-box oversight in Europe and Australia are pressing margins and accelerating consolidation.
Key Report Takeaways
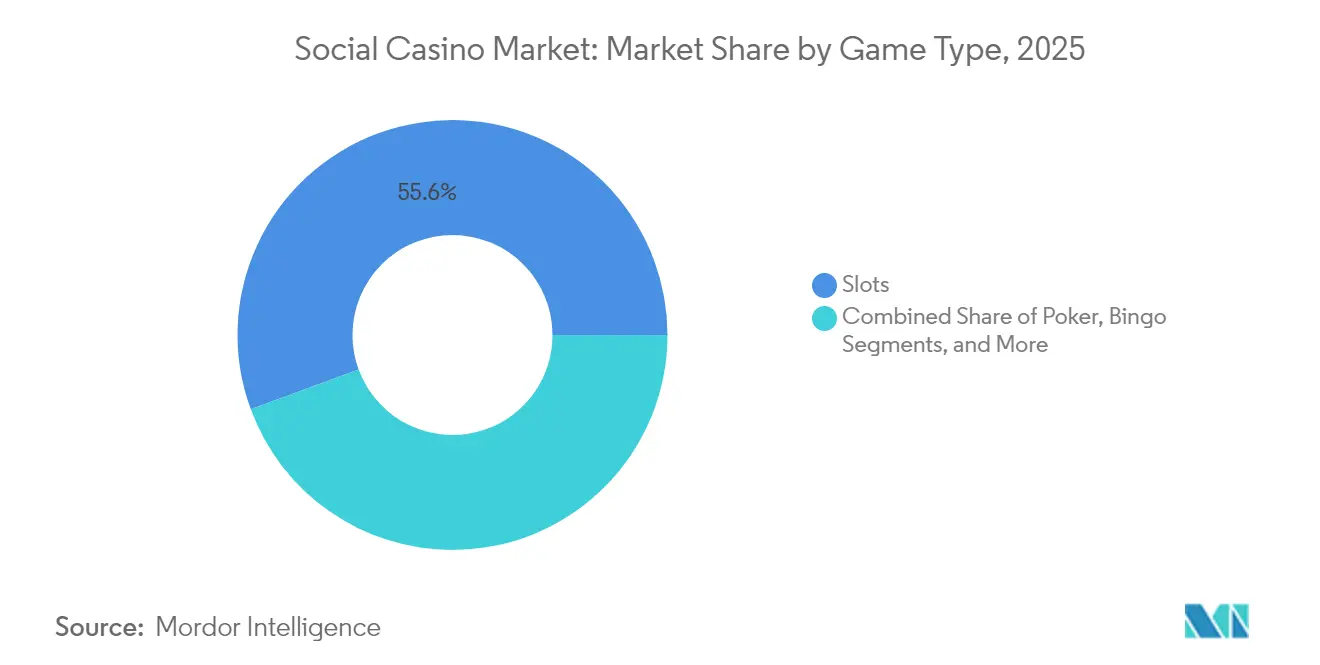
- By game type, slots held 55.62% of the social casino market share in 2025; bingo is forecast to post the fastest 9.79% CAGR through 2031.
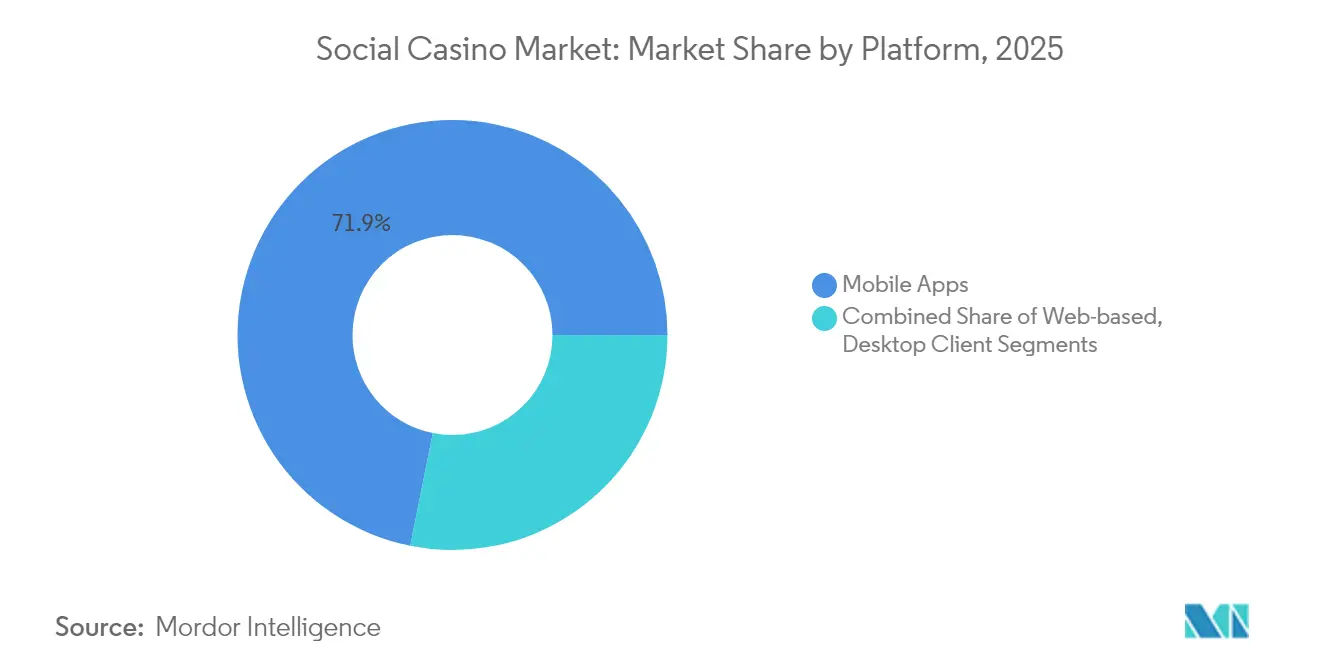
- By platform, mobile apps accounted for 71.85% of revenue in 2025, while this segment is projected to expand at an 10.86% CAGR to 2031.
- By geography, North America led with 40.18% revenue share in 2025; Asia-Pacific is poised for the quickest 10.19% CAGR during 2026-2031.
- By company, Aristocrat captured 20.73% share of global social slots revenue in 2025.
Note: Market size and forecast figures in this report are generated using Mordor Intelligence’s proprietary estimation framework, updated with the latest available data and insights as of 2026.
Global Social Casino Market Trends and Insights
Drivers Impact Analysis*
| Driver | (~) % Impact on CAGR Forecast | Geographic Relevance | Impact Timeline |
|---|---|---|---|
| Convergence of social gaming and real-money gambling | +1.80% | North America; spillover to South America | Medium term (2-4 years) |
| Gamified retention mechanics in Asia | +1.50% | Asia-Pacific core; global spread | Short term (≤ 2 years) |
| Supplier IP partnerships for premium slots | +1.20% | Global; focus on North America and Europe | Medium term (2-4 years) |
| Cross-platform wallets lifting lifetime value | +0.90% | Europe primary; North America secondary | Long term (≥ 4 years) |
| Cloud-streamed instant play in emerging markets | +0.70% | South America, Middle East and Africa, Asia-Pacific | Long term (≥ 4 years) |
| App-store privacy shifts benefiting niche operators | +0.60% | Global; iOS-dominant markets | Short term (≤ 2 years) |
| Source: Mordor Intelligence | |||
Convergence of Social Gaming and Real-Money Gambling in North America
Caesars Entertainment’s multistate rollout of proprietary iGaming sites in 2024 highlights how land-based casino brands use free-to-play apps to funnel players into regulated wagering platforms, a model that delivers higher lifetime values and targeted cross-promotion. Conversion success has sparked copy-cat strategies across legal U.S. jurisdictions, yet lawmakers in New York and New Jersey tabled 2025 bills that would curb sweepstakes-style models, underscoring both the upside and the compliance risk.
Gamified Retention Mechanics Driving In-App Purchases in Asia
SciPlay recorded USD 681 million in mobile in-app sales on an ARPDAU of USD 0.94 during 2024 thanks to guilds, limited-time events and leaderboards tuned for Chinese, Japanese and South Korean audiences. [1]Light & Wonder, “Form 10-K 2024,” sec.gov These mechanics cultivate daily play streaks and impulsive micro-transactions, but stricter privacy policies hinder the data granularity that fuels hyper-personalization.
Supplier IP Partnerships Enabling Premium Slots Globally
The Wheel of Fortune brand renewal through 2034 and Playtika’s April 2025 launch of Disney Solitaire show how recognizable franchises lure casual gamers and justify higher spending thresholds. Licensing raises content costs yet grants brand distinction and, in some jurisdictions, shields against gambling-adjacent stigma.
Cross-Platform Wallets Enhancing Lifetime Value in Europe
EU rules adopted in March 2025 require clear pricing and withdrawal rights for virtual coins, incentivizing regulated operators to deploy unified wallets that carry balances across titles. [2]European Commission, “Key Principles on In-Game Virtual Currencies,” commission.europa.eu Operators gain full-journey spend data for precision marketing while players enjoy low-friction checkout, though the build-out demands heavy tech and compliance budgets.
Restraints Impact Analysis*
| Restraint | (~) % Impact on CAGR Forecast | Geographic Relevance | Impact Timeline |
|---|---|---|---|
| IDFA deprecation inflating user-acquisition costs | -0.014 | Global; most acute on iOS | Short term (≤ 2 years) |
| Anti-loot-box regulation in EU and Australia | -0.008 | Europe and Australia; global spillover | Medium term (2-4 years) |
| FinCEN and FATF scrutiny on virtual-currency flows | -0.006 | US and other regulated markets | Medium term (2-4 years) |
| Latency limiting real-time play in Africa | -0.004 | Africa; selected emerging markets | Long term (≥ 4 years) |
| Source: Mordor Intelligence | |||
IDFA Deprecation Inflating User-Acquisition Costs
Apple’s privacy reset cut attribution accuracy and spiked media CPMs, tilting advantage toward majors such as Playtika that mine first-party data and own brand channels. Google’s removal of gambling ad limits for social casino in December 2024 partly offsets the blow, yet smaller studios struggle to absorb the 2025 cost surge without scale.
Intensifying Anti-Loot-Box Regulation in EU and Australia
EU guidance now compels odds disclosure and enforceable parental controls, while Australia flags loot-box content with higher age ratings. Belgium’s earlier ban proved porous as most grossing iPhone games still included loot boxes, spotlighting enforcement gaps even as compliance overhead rises. [3]Leon Xiao, “Breaking Ban: Belgium’s Ineffective Gambling Law,” doi.org
*Our forecasts treat driver/restraint impacts as directional, not additive. The impact forecasts reflect baseline growth, mix effects, and variable interactions.
Segment Analysis
By Game Type: Slots Dominance Drives Premium Content Investment
Slots generated the largest revenue slice at 55.62% in 2025, accounting for the single biggest contributor to the social casino market. Continuing IP tie-ups and multi-level progressive jackpots underpin the segment’s robust spend profile, with the Tiger and Dragon title winning “Best Slot Product” at the 2025 GGB awards. Maintaining this lead demands proprietary engines, exclusive licenses and event-driven mechanics that keep casual audiences returning.
Bingo’s projected 9.79% CAGR positions it as the fastest-rising format, capitalizing on chat-room play and collaborative power-ups that appeal to community-minded players. Poker and table games sustain loyal followings through skill-based tournaments and VIP ladders that extend session length. Niche lottery and arcade hybrids add incremental revenue by cross-selling boosters drawn from adjacent casual-gaming genres.


By Platform: Mobile Apps Accelerate Cross-Platform Integration
Mobile accounted for 71.85% of the social casino market in 2025, and its 10.86% CAGR through 2031 underscores the device’s entrenched primacy. Direct push alerts, one-tap payments and location features deepen engagement more than browser play can match. The social casino market size for mobile apps is therefore expected to outgrow desktop at a widening clip across both mature and emerging territories.
Operators are mitigating app-store fees and policy shifts by launching proprietary in-app purchase channels, as seen in SciPlay’s 2024 build-out. Browser and PC clients retain niche enthusiasts seeking large-screen comfort, yet roadmap investments increasingly prioritize responsive mobile UX, light streaming and carrier billing for regions with lower credit-card penetration.
Geography Analysis
North America captured 40.18% of global revenue in 2025 on the back of legalized iGaming corridors and high consumer wallets. Operators bundle loyalty points from physical casinos with social apps to lengthen play cycles and steer high-value users toward regulated betting offers. Legislative probes into sweepstakes mechanics in states such as New York and New Jersey foreshadow stricter disclosure rules, yet conversion synergies between free-to-play and cash wagering keep the region’s revenue per paying user above global averages.
Asia-Pacific is the fastest-growing arena with a 10.19% CAGR, fueled by rapid smartphone adoption, youthful demographics and culturally attuned guild play. Chinese regulations remain fluid, but Japan and South Korea contribute stable monetization while India’s rising middle class widens the addressable base for freemium models. Cross-border cloud streaming is easing device constraints and igniting interest in real-time multiplayer, a factor expected to sustain double-digit gains for the social casino market.
Europe follows a steadier path, supported by stringent but clear consumer safeguards that reward compliant operators and deter rogue entrants. The 2025 virtual-currency code introduces unified labeling and refund mechanisms that raise trust in branded platforms. National nuances persist, from the United Kingdom’s affordability checks to Germany’s licensing quotas, making localized compliance teams indispensable. South America and the Middle East and Africa present long-run upside once payment rails and broadband access mature, providing fertile ground for cloud-delivered instant play.

Competitive Landscape
Industry concentration is moderate: Aristocrat, Playtika, Zynga, Light and Wonder and IGT jointly command an estimated seven-tenths of global bookings, while a tail of mid-tier studios pivots around niche IP or regional expertise. Playtika’s USD 700 million SuperPlay buy in September 2024 broadened its reach across solitaire and board themes, mirroring Aristocrat’s history of bolt-on deals to protect its lead in social slots.
Content differentiation is hardening around premium IP. BetMGM’s 2025 exclusivity for “The Price is Right” and “Family Feud” extends the television-gamification playbook, while Caesars’ branded live-dealer studio underscores omnichannel loyalty tactics that tie digital and terrestrial footprints. Proprietary wallets and data pipelines are the new battleground, reducing reliance on third-party platforms and enhancing retention modeling in a post-IDFA context.
AI-driven segmentation, real-time A/B testing and fraud analytics are becoming baseline capabilities. Studios without the budget to support these stacks face acquisition or exit as UA inflation and compliance overhead erode margins. Looking forward, slot studios with powerful franchises, direct distribution and strong regulatory track records are positioned to shape product standards and pricing in the social casino market.
Social Casino Industry Leaders
Playtika Holding Corp.
Aristocrat Leisure Ltd. (SciPlay & Big Fish)
Zynga Inc.
Caesars Entertainment Inc.
Light and Wonder Inc. (Formerly Scientific Games)
- *Disclaimer: Major Players sorted in no particular order

Recent Industry Developments
- April 2025: Playtika rolled out Disney Solitaire via its SuperPlay unit, blending TriPeaks mechanics with Disney and Pixar characters.
- March 2025: The European Commission issued virtual-currency guidelines setting price-clarity and withdrawal norms for in-game coins.
- February 2025: A U.S. jury awarded USD 24.9 million to Washington players in a class action against High 5 Games’ social casino model.
- January 2025: Caesars opened a branded live-dealer studio in Pennsylvania through Evolution Gaming.


Global Social Casino Market Report Scope
Social casino is an online platform that offers virtual casino games in a social and entertainment-oriented setting. Unlike traditional online gambling platforms, social casinos do not allow players to wager or win real money. Instead, they use virtual currency that can be purchased or earned within the game.
The social casino market report is segmented by game type (slots, poker, bingo, others), by platform (web-based, mobile-based) and by geography (North America, Europe, Asia-Pacific, Latin America, and Middle East & Africa). The market sizes and forecasts are provided in terms of value (USD) for all the above segments.
| Slots |
| Poker |
| Bingo |
| Table Games |
| Others |
| Mobile Apps |
| Web-based |
| Desktop Client |
| North America | United States |
| Canada | |
| Mexico | |
| South America | Brazil |
| Argentina | |
| Rest of South America | |
| Europe | Germany |
| United Kingdom | |
| France | |
| Italy | |
| Spain | |
| Rest of Europe | |
| Asia-Pacific | China |
| Japan | |
| South Korea | |
| India | |
| Australia | |
| New Zealand | |
| Rest of Asia-Pacific | |
| Middle East and Africa | United Arab Emirates |
| Saudi Arabia | |
| South Africa | |
| Rest of Middle East and Africa |
| By Game Type | Slots | |
| Poker | ||
| Bingo | ||
| Table Games | ||
| Others | ||
| By Platform | Mobile Apps | |
| Web-based | ||
| Desktop Client | ||
| By Geography | North America | United States |
| Canada | ||
| Mexico | ||
| South America | Brazil | |
| Argentina | ||
| Rest of South America | ||
| Europe | Germany | |
| United Kingdom | ||
| France | ||
| Italy | ||
| Spain | ||
| Rest of Europe | ||
| Asia-Pacific | China | |
| Japan | ||
| South Korea | ||
| India | ||
| Australia | ||
| New Zealand | ||
| Rest of Asia-Pacific | ||
| Middle East and Africa | United Arab Emirates | |
| Saudi Arabia | ||
| South Africa | ||
| Rest of Middle East and Africa | ||


Key Questions Answered in the Report
What is the current size of the social casino market?
The social casino market size stood at USD 9.06 billion in 2026 and is forecast to rise to USD 13.49 billion by 2031.
Which game type dominates revenue?
Slots lead with 55.62% of 2025 revenue thanks to premium IP licensing and engaging progressive mechanics.
Which region is growing the fastest?
Asia-Pacific is expanding at a 10.19% CAGR through 2031, driven by mobile-first play and guild-based engagement.
How are privacy changes affecting user acquisition?
Apple’s IDFA restrictions have lifted cost-per-install rates, favoring large publishers that rely on first-party data strategies.
What role do branded IP deals play in market growth?
Licensed titles like Wheel of Fortune and Disney Solitaire drive higher conversion and retention, making IP agreements a core competitive lever.
Are regulatory trends likely to slow market expansion?
Stricter loot-box and virtual-currency rules raise compliance costs, yet clear standards also create safer environments that support long-term growth.
Page last updated on:


