Casino Management System Market Size and Share
Market Overview
| Study Period | 2020 - 2031 |
|---|---|
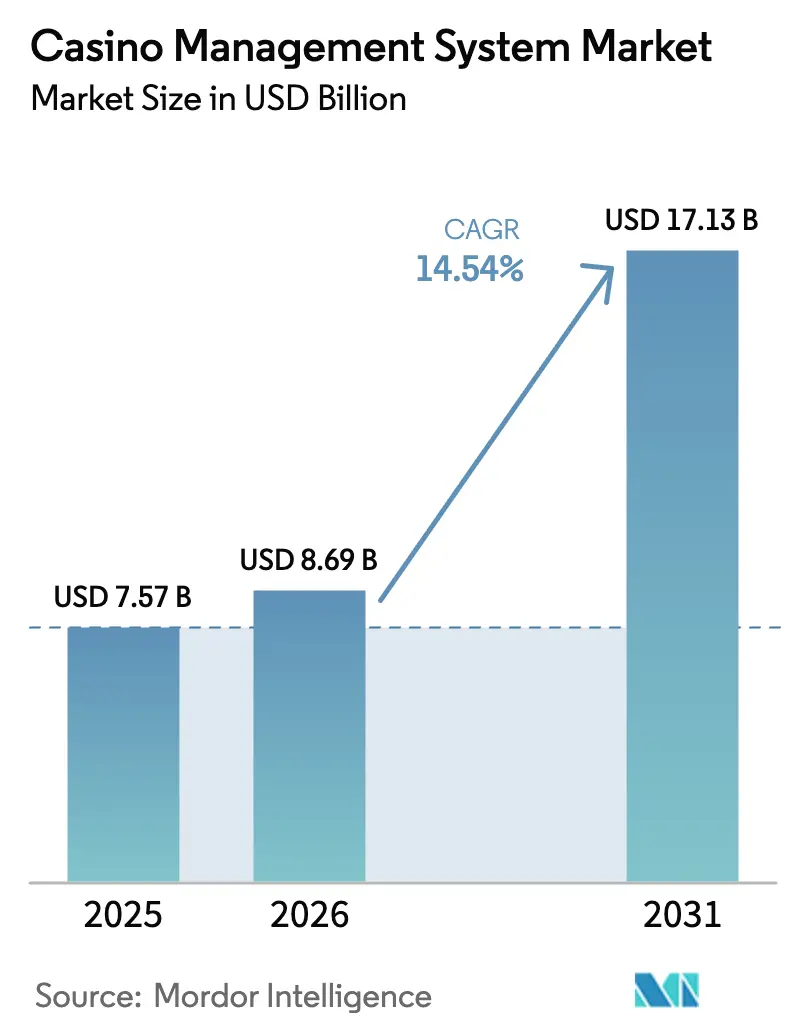
| Market Size (2026) | USD 8.69 Billion |
| Market Size (2031) | USD 17.13 Billion |
| Growth Rate (2026 - 2031) | 14.54% CAGR |
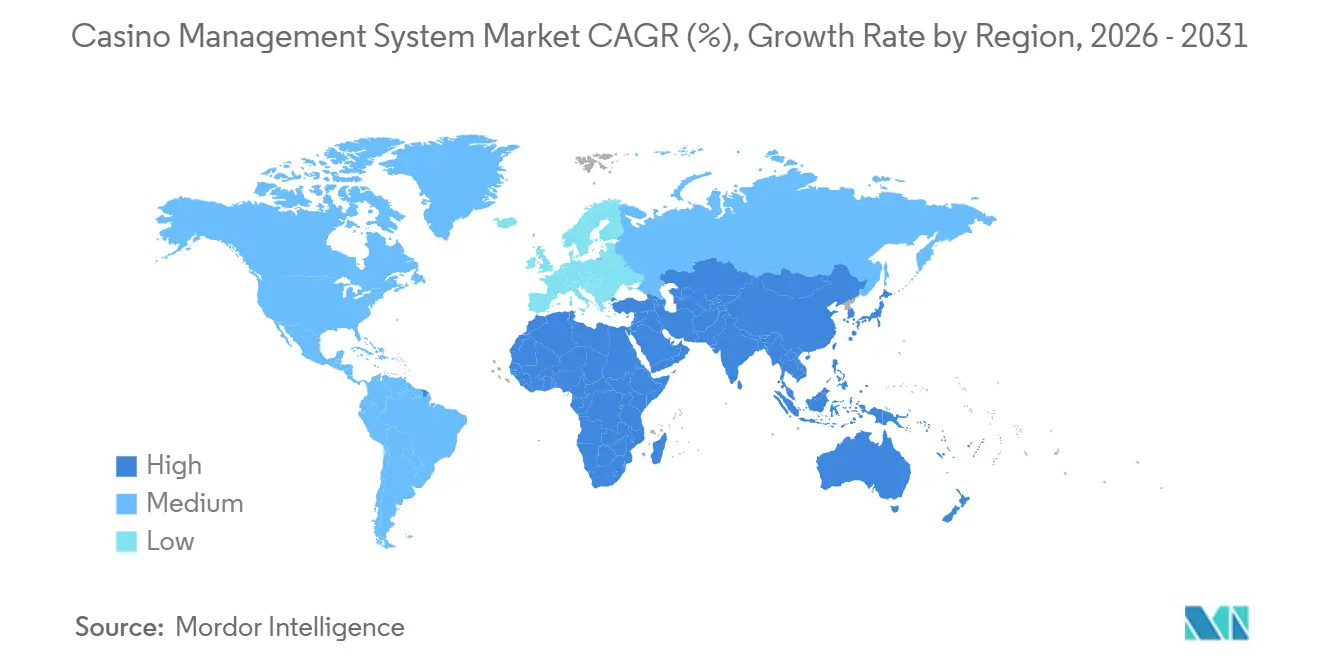
| Fastest Growing Market | Asia Pacific |
| Largest Market | North America |
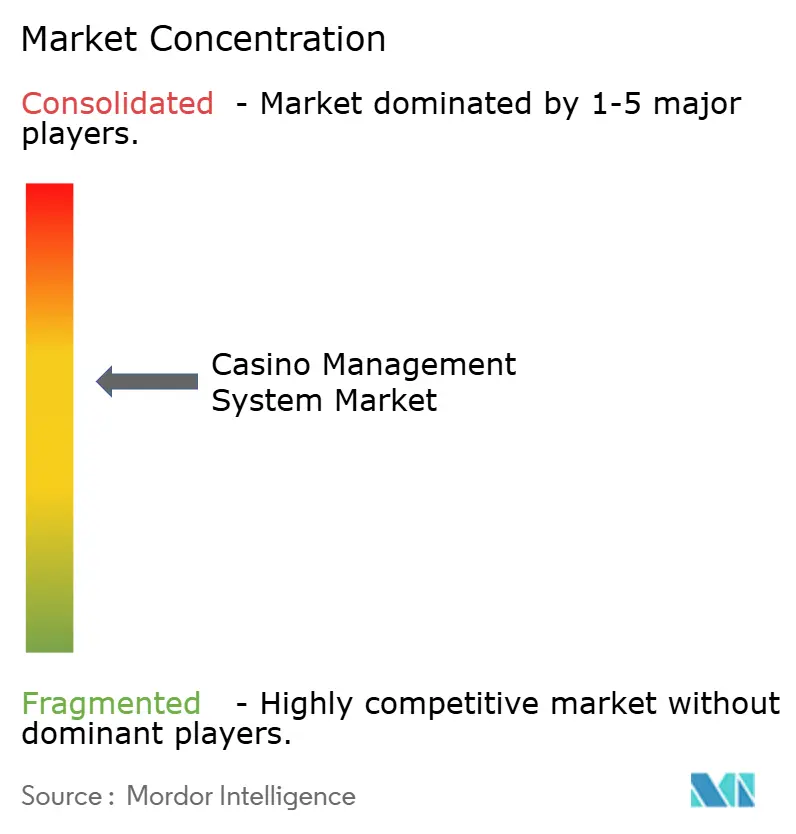
| Market Concentration | Medium |
Major Players *Disclaimer: Major Players sorted in no particular order Image © Mordor Intelligence. Reuse requires attribution under CC BY 4.0. | |
Casino Management System Market Analysis by Mordor Intelligence
The Casino Management System Market size is expected to grow from USD 7.57 billion in 2025 to USD 8.69 billion in 2026 and is forecast to reach USD 17.13 billion by 2031 at 14.54% CAGR over 2026-2031. Intensifying regulatory scrutiny, persistent labor shortages, and the strategic push for real-time customer intelligence are redefining platform priorities beyond simple digitization. Mandatory cashless mandates in Australia and Nevada, sovereign data-residency rules across the European Union, and an Asia-Pacific integrated-resort pipeline valued above USD 11 billion collectively accelerate demand for converged accounting, surveillance, loyalty, and analytics solutions. Operators now focus on modular, cloud-ready architectures that defer upfront capital expenditures, streamline multi-jurisdiction compliance, and close cybersecurity gaps exposed by recent high-profile breaches. Competitive dynamics favor vendors offering API-first suites, outcome-based pricing, and hybrid deployment options that respect tribal data sovereignty while leveraging hyperscale elasticity.
Key Report Takeaways
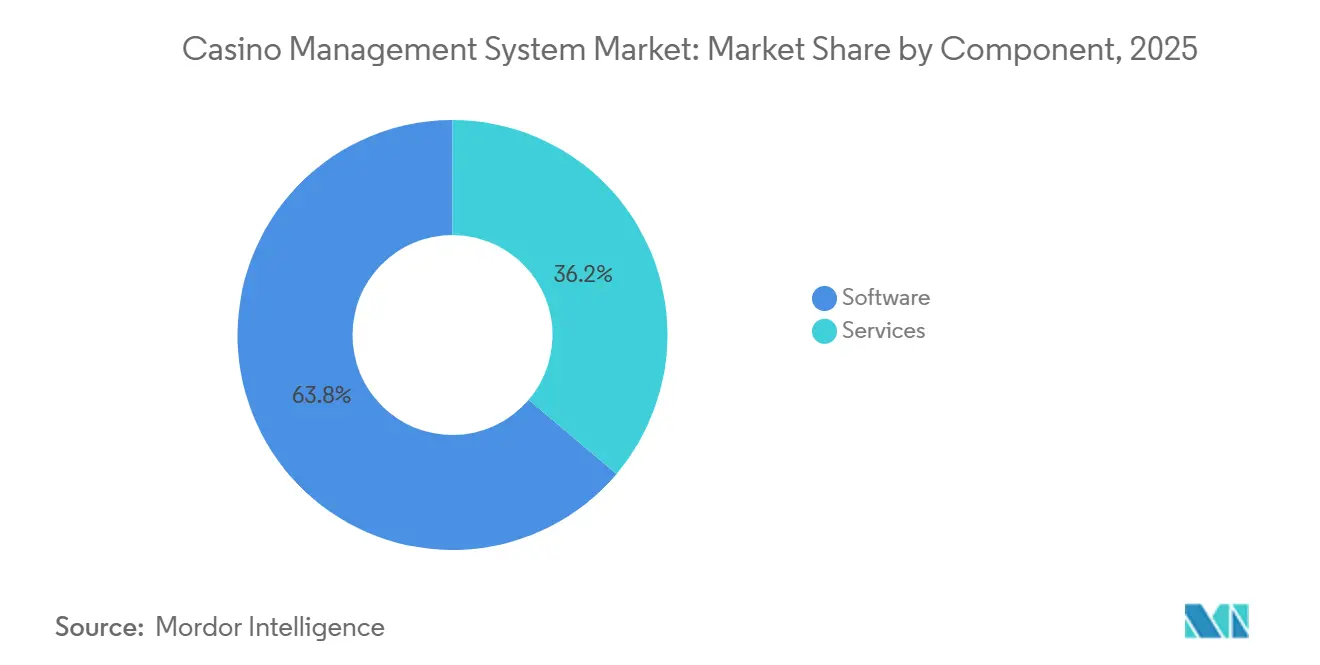
- By component, services accounted for 40% of revenue in 2025 and are forecast to grow at a 14.80% CAGR through 2031.
- By deployment mode, cloud-based offerings climbed to 32% revenue share in 2025 and are projected to expand at a 16.90% CAGR through 2031.
- By purpose, analytics modules represented 14% of the casino management systems market share in 2025 and are advancing at a 17.50% CAGR through 2031.
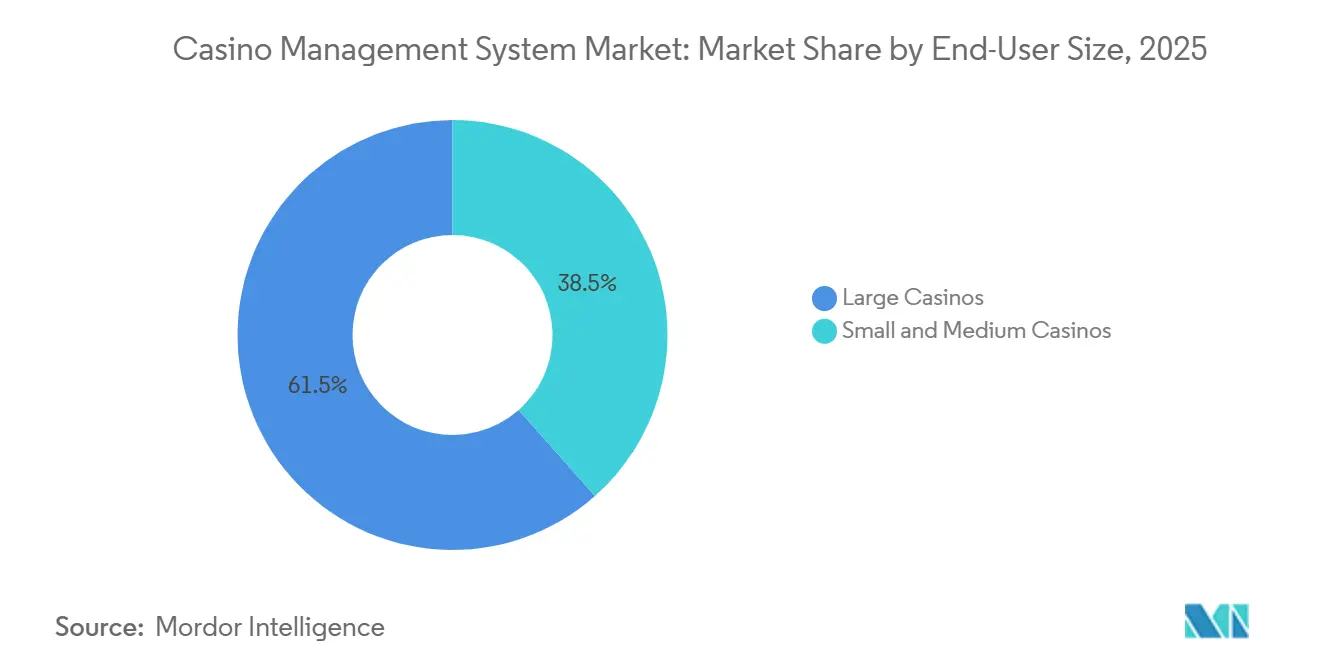
- By end-user size, small and medium properties recorded a 38% share of the casino management systems market size in 2025 and are expected to rise at a 15.60% CAGR to 2031.
- By casino type, tribal venues captured 22% revenue share in 2025 and lead growth with a 17.39% CAGR through 2031.
- By geography, Asia-Pacific is forecast to chart the fastest expansion at an 18.10% CAGR through 2031, while North America retained 39.41% revenue share in 2025.
Note: Market size and forecast figures in this report are generated using Mordor Intelligence’s proprietary estimation framework, updated with the latest available data and insights as of January 2026.
Global Casino Management System Market Trends and Insights
Rapid Integrated-Resort Builds Across Asia Driving CMS Roll-outs
Japan’s MGM Osaka, financed for USD 3.4 billion, targets a 2030 launch with more than 3,000 slots and 200 tables operating under a single platform.[1]Nikkei Asia, “MGM Osaka Integrated Resort Financing,” asia.nikkei.com Thailand’s draft entertainment-complex bill outlines 5–8 greenfield licenses of at least USD 1 billion each, signaling vendor opportunities to embed analytics from day one.[2]Bangkok Post, “Thailand Integrated Entertainment Complex Legislation,”bangkokpost.com Singapore’s Marina Bay Sands earmarked USD 8 billion through 2031 to merge cashless rails and real-time surveillance in a unified data lake. Although procurement cycles run 18–24 months due to multi-agency approvals, suppliers with regional offices and localized compliance credentials secure an outsized win rate, while later entrants contend with steep customization costs.
Mandatory Cashless/TITO Regulations in Australia and Nevada
Victoria expanded its cashless-card pilot in 2025 and, with New South Wales, set 2028 deadlines for ticket-in ticket-out retrofits across 180,000 machines. Nevada’s proposed IRS threshold increase to USD 30,000 lowers manual reporting burdens, nudging operators toward digital rails even without a legal mandate. Once core accounting and cage modules migrate to the cloud to support cashless play, incremental loyalty, surveillance, and analytics add-ons become marginally cheaper, boosting platform attach rates for API-centric vendors.
U.S. Sports-Betting Legalisation Fuelling Loyalty-System Upgrades
Legal wagering now spans 38 states, creating a customer-acquisition race that hinges on unified reward ecosystems. BetMGM showed that dual-vertical patrons deliver 40% higher lifetime value, pushing peers to overhaul loyalty stacks that reconcile sportsbook and casino data. Proposed federal oversight via the SAFE Bet Act would oblige seven-year record retention, making scalable data-warehousing a compliance necessity rather than a marketing luxury.
Cloud-Based CMS Adoption by Tribal Casinos to Offset IT Shortfalls
Mohegan Sun’s 2024 cloud migration lifted upsell conversions fivefold by coupling room inventory with live gaming data. Twenty-Nine Palms trimmed on-premise upkeep through quarterly SaaS updates, while Grand Casino integrated slot accounting via RESTful APIs without a disruptive rip-and-replace. Surveys reveal that sovereignty and cybersecurity remain concerns, yet hybrid models keeping patron PII onsite while exporting analytics workloads to the cloud are easing adoption barriers.
Restraint Impact Analysis*
| Restraint | (~)% Impact on CAGR Forecast | Geographic Relevance | Impact Timeline |
|---|---|---|---|
| High-Profile Cyber-Breaches Increasing Operator Liability | -1.8% | Global, acute in North America | Short term (≤ 2 years) |
| Macau Concession CapEx Freeze Delaying New CMS Contracts | -1.5% | Asia-Pacific (Macau, regional spill-over) | Medium term (2-4 years) |
| Stricter GDPR-Style Data-Privacy Rules Curb Player-Tracking Depth | -1.2% | Europe, emerging in the Asia-Pacific | Medium term (2-4 years) |
| Land-Based Footfall Erosion From Online and Mobile Gaming | -1.0% | Global, pronounced in North America and Europe | Long term (≥ 4 years) |
| Source: Mordor Intelligence | |||
High-Profile Cyber-Breaches Increasing Operator Liability
In 2023, MGM Resorts faced breach costs amounting to USD 100 million, while Caesars forked out USD 15 million as ransom. These significant incidents have propelled cybersecurity concerns to the forefront of board-level discussions, emphasizing the critical need for robust security measures. As a result, procurement committees are now mandating penetration tests, bug-bounty verifications, and cyber insurance as part of their evaluation processes. These additional requirements are extending sales cycles by up to six months, creating delays in finalizing deals, and inflating total ownership costs by 15–20%, thereby impacting overall budgets. Furthermore, smaller vendors without SOC 2 documentation are increasingly finding themselves at risk of disqualification, as organizations prioritize compliance and security standards. This trend is accelerating a wave of consolidation in the industry, with smaller players struggling to meet the heightened expectations and requirements.
Macau Concession CapEx Freeze Delaying New CMS Contracts
Galaxy, Sands China, and MGM China, despite a significant USD 15 billion pledge for the period 2023-2033, have made the decision to reduce their 2024 capital budgets. These financial resources are now being redirected towards initiatives aimed at improving liquidity and implementing non-gaming upgrades to diversify their offerings. The gross gaming revenue in Macau has shown considerable volatility, with an 11% year-on-year decline recorded in January 2025. This decline has prompted operators to increasingly favor pay-as-you-go cloud models over traditional large perpetual licenses. This strategic shift, while offering flexibility to operators, has resulted in revenue fluctuations for vendors who are heavily reliant on deals originating from the Macau market.
*Our forecasts treat driver/restraint impacts as directional, not additive. The impact forecasts reflect baseline growth, mix effects, and variable interactions.
Segment Analysis
By Component: Services Surge on Compliance Complexity
Services captured 40% of 2025 revenue and are projected to expand at a 14.80% CAGR as operators lean on vendor expertise for jurisdiction reporting and cybersecurity audits. The casino management systems market size for services is projected to reach USD 6.3 billion by 2031, reflecting bundled implementation, training, and managed-security retainers. Software keeps a larger dollar base, yet its growth lags because many modules reach feature parity, pressuring license rates. Vendors improving margins through standardized rollout toolkits and remote configuration attract operators eager to avoid multi-week floor closures. The casino management systems market benefits when service teams shorten compliance timelines that otherwise expose properties to fines.
Software revenue still leads, driven by unavoidable subscription renewals and maintenance. API-first platforms that expose microservices win favor because they let operators incrementally add functionality without forklift upgrades. Vendors monetizing usage-based analytics or responsible-gaming AI unlock new annuity streams, although price sensitivity rises among mid-tier casinos.


By Deployment Mode: Cloud Gains Ground on Subscription Economics
Cloud installations held 32% share in 2025 and are climbing at a 16.90% CAGR through 2031 as budget-constrained venues shift from capital expenditure to operating expenditure. The casino management systems market share for cloud could top 48% by 2031 if hyperscale providers sustain gaming-specific certifications. Tribal properties drive initial momentum, but mid-sized commercial resorts follow once Nevada certified Oracle’s Cloud Hospitality suite.[3] Hybrid designs that keep sensitive PII on-premise while exporting analytics workloads ease sovereignty concerns and shorten migration windows to under six months for sub-1,000-machine casinos.
On-premise remains entrenched among mega-resorts with sunk servers and latency-sensitive pit applications. Still, refreshed Nevada standards requiring remote firmware pushes fresh hardware procurement that increasingly bundles thin-client gateways, a stepping-stone toward full cloud adoption.
By Purpose: Analytics Modules Lead on AML Mandates
In 2025, analytics accounted for 14% of total revenue, yet it demonstrated the fastest growth rate at 17.50% CAGR. This significant growth is primarily driven by the enforcement of the EU's anti-money laundering (AML) deadlines and the U.S.'s increasing focus on responsible gaming standards. The adoption of advanced services, such as real-time transaction monitoring, beneficial ownership matching, and machine-learning-based churn prediction, has justified premium pricing and contributed to higher module attach rates. These analytics solutions are becoming indispensable for operators aiming to meet regulatory requirements and enhance operational efficiency. Meanwhile, accounting and cage services continue to serve as foundational components of the market, as regulators consistently audit meter accuracy to ensure compliance.
However, innovation in these areas has been incremental, with limited advancements beyond their core functionalities. Loyalty modules, on the other hand, have reached a plateau, as most properties have already completed their first-generation rollouts. The next phase of growth for loyalty modules is expected to stem from the integration of sportsbook and online channels, which could unlock new opportunities for customer engagement and retention. Security modules incorporating computer vision technologies are experiencing uneven adoption across different regions. This variability is largely influenced by privacy laws, which impose restrictions on the use of facial recognition in certain jurisdictions. Despite these challenges, the potential for security modules to enhance surveillance and operational security remains significant, particularly in markets with fewer regulatory constraints.
By End-User Size: Small and Medium Casinos Narrow Technology Gap
In 2025, properties with fewer than 1,000 machines accounted for 38% of the total spend, experiencing a robust growth rate of 15.60% CAGR. This surge is largely attributed to the introduction of modular cloud offers, starting at an annual price point of USD 50,000. These modular solutions provide cost-effective and scalable options, making advanced analytics more accessible to smaller operators. The shift to subscription pricing has effectively dismantled the historical USD 500,000 entry barrier, which previously limited access to such technologies.
This change empowers independent regional casinos to tap into analytics that were previously the domain of major players on the Strip, enabling them to compete more effectively in the market. While large multi-property chains wield significant negotiating power and benefit from early-access pilots, their committee-driven procurement processes tend to elongate sales cycles. This dynamic creates an opportunity for agile vendors to expand their reach among smaller operators, who are often quicker to adopt innovative solutions due to their streamlined decision-making processes.
By Casino Type: Tribal Properties Accelerate Digital Transformation
In 2025, tribal venues accounted for 22% of the revenue and are projected to grow at a robust CAGR of 17.39% through 2031, driven primarily by compact renewals that unlock modernization budgets. These renewals are enabling tribal venues to invest in advanced technologies and infrastructure, ensuring they remain competitive in the evolving gaming market. Federal grants are playing a significant role by subsidizing responsible-gaming features, which are becoming increasingly important as the industry focuses on ethical practices and player protection. Additionally, sovereignty considerations are amplifying the demand for hybrid clouds, particularly those designed to operate securely within tribal network boundaries, ensuring compliance with unique regulatory requirements. While integrated-resort casinos continue to dominate in terms of absolute spending, their growth has started to plateau.
This moderation is largely due to the fact that many top-tier properties have already implemented full-suite deployments, leaving limited room for further expansion in this segment. On the other hand, racinos and slot routes are increasingly adopting lightweight cloud dashboards, which provide the flexibility to remotely push game configuration updates, enhancing operational efficiency. Meanwhile, cruise operators are awaiting advancements in low-earth-orbit bandwidth technology. This innovation is expected to enable real-time loyalty accrual at sea, a feature that could significantly enhance customer engagement and retention for cruise-based gaming operations.
Geography Analysis
North America retained 39.41% revenue share in 2025, underpinned by Nevada’s mature rules, 29-state tribal presence, and 38-state sports betting. Growth cools as the region shifts from new construction to software refresh cycles, especially Nevada’s 2026 remote-update mandate. Canada’s regulators now harmonize technical standards, opening multi-province self-exclusion databases that bolster regional demand for cross-jurisdiction compliance engines. Replacement demand keeps the casino management systems market resilient even without greenfield supply.
Asia-Pacific leads with an 18.10% CAGR, propelled by Japan’s MGM Osaka, Thailand’s pending legislation, and Singapore’s USD 8 billion Marina Bay Sands upgrade. Australia’s 2028 cashless deadline sparks a USD 1.2 billion systems overhaul, while New Zealand consults on aligned harm-reduction rules. Macau’s capex freeze tempers near-term orders, yet long-run diversification into mass-market slots elevates platform requirements.
Europe’s outlook depends on AML and data-privacy rule enforcement such as Germany’s deposit limits and France’s GDPR fines. Obligatory beneficial-ownership checks at EUR 2,000 transactions raise demand for real-time analytics. Harmonization across Spain and Italy fosters cross-border loyalty pools, yet tighter consent rules curb aggressive player-tracking depth. South America and the Middle East remain fragmented but offer upside if Brazil’s land-based licenses and UAE integrated-resort discussions progress.

Competitive Landscape
In South America, Brazil stands out as the primary player, benefiting from import duties that promote local board assembly and support the domestic market. These import duties create an environment conducive to local manufacturing, encouraging companies to assemble boards within the country. However, the arrival of laminates from Asia significantly undermines these cost savings, as imported materials continue to play a major role in the supply chain. This reliance on Asian imports dilutes the potential economic advantages of local assembly, making it challenging for the region to fully capitalize on its domestic production capabilities. Meanwhile, the Middle East and Africa, with their still-nascent EV adoption and insufficient board volumes, remain heavily reliant on imports. The low demand in these regions makes greenfield investments economically unviable, further reinforcing their dependence on external suppliers. The lack of substantial board volumes and the early stage of EV adoption in these markets create significant barriers to establishing local manufacturing facilities, leaving imports as the primary source of supply.
In addition to these challenges, the competitive landscape in South America is further influenced by the global supply chain dynamics. The dependence on Asian imports for laminates not only impacts cost structures but also exposes the region to potential supply chain disruptions. Factors such as fluctuating shipping costs, geopolitical tensions, and varying lead times add layers of complexity to the market. These challenges necessitate strategic planning and risk mitigation measures for companies operating in the region, as they strive to balance cost efficiency with supply chain reliability.
Similarly, the Middle East and Africa face unique hurdles in developing a robust local manufacturing ecosystem. Limited infrastructure, coupled with a lack of skilled labor and technological expertise, hampers the establishment of domestic production facilities. Furthermore, the relatively low penetration of electric vehicles in these regions reduces the demand for components like boards, making it difficult to achieve economies of scale. As a result, stakeholders in these markets are likely to continue relying on imports in the near term, while exploring opportunities to gradually build local capabilities as EV adoption grows.
Casino Management System Industry Leaders
International Game Technology PLC
Aristocrat Leisure Ltd.
Novomatic AG
Scientific Games Corp.
Konami Gaming Inc.
- *Disclaimer: Major Players sorted in no particular order

Recent Industry Developments
- February 2026: Everi began full-scale rollout of CMS+ at two Pacific Northwest tribal casinos, adding responsible-gaming AI to earlier accounting deployments.
- January 2026: OPTX signed a three-year analytics contract with a mid-tier Nevada operator, adopting outcome-based pricing linked to incremental loyalty revenue.
- December 2025: Konami deployed Synkros at a newly opened California cardroom, integrating cashless wallets ahead of state-level mandates expected in 2027.
- November 2025: Galaxy Gaming’s Game Operating System reached 100 installations, mainly in Asia-Pacific stadium gaming pits.


Research Methodology Framework and Report Scope
Market Definitions and Key Coverage
Mordor Intelligence defines the casino management system (CMS) market as the licensed software and related support services that handle cage operations, player loyalty, surveillance integration, table-slot accounting, hotel interfaces, analytics, and marketing modules inside brick-and-mortar casinos, cruise ships, and integrated resorts. Pure online-only gaming platforms, generic property-management suites, and stand-alone surveillance hardware are outside this scope.
Scope Exclusion: Solutions sold solely for internet casinos or sportsbook back-ends are excluded.
Segmentation Overview
- By Component
- Software
- Services
- By Deployment Mode
- On-Premise
- Cloud-Based
- By Purpose
- Accounting and Cage Operations
- Security and Surveillance
- Hotel and Resort Management
- Analytics and Reporting
- Player Tracking and Loyalty
- Media Management and Digital Signage
- Marketing and Promotions
- By End-User Size
- Small and Medium Casinos
- Large Casinos
- By Casino Type
- Integrated Resort Casinos
- Tribal Casinos
- Racinos
- Slot Route Operations
- Cruise/Shipboard Casinos
- By Geography
- North America
- United States
- Canada
- Mexico
- South America
- Brazil
- Argentina
- Rest of South America
- Europe
- Germany
- United Kingdom
- France
- Italy
- Spain
- Rest of Europe
- Asia Pacific
- China
- Japan
- South Korea
- India
- Australia
- New Zealand
- Rest of Asia-Pacific
- Middle East and Africa
- Middle East
- United Arab Emirates
- Saudi Arabia
- Turkey
- Rest of Middle East
- Africa
- South Africa
- Nigeria
- Kenya
- Rest of Africa
- Middle East
- North America
Detailed Research Methodology and Data Validation
Primary Research
Interviews with floor managers, cage cashiers, and system integrators across Las Vegas, Macau, Manila, and Sydney allowed us to validate installed-base estimates, average price per gaming position, migration pace to cloud CMS, and typical module attach rates. Follow-up surveys with European compliance officers filled gaps around AML analytics spending.
Desk Research
Our analysts began by mapping the global footprint of 4,400+ regulated gambling venues using freely accessible registries such as the American Gaming Association factbook, Nevada Gaming Control Board revenue reports, World Casino Directory listings, and customs shipment codes for slot machines on UN COMTRADE. Industry statutes from the EU 6th AML Directive and Australia's TITO mandate clarified compliance-driven demand. Company filings and SEC 10-Ks supplemented venue counts and average system replacement cycles, while D&B Hoovers and Dow Jones Factiva feeds provided operator financials to benchmark capital spending. (This list is illustrative; many additional public and paid sources supported desk verification.)
Market-Sizing & Forecasting
We applied a top-down reconstruction starting with venue counts, gaming positions, and average CMS spend per position, which are then cross-checked through bottom-up roll-ups of sampled supplier revenues. Key variables include:
• new resort openings announced per year,
• average slot-to-table ratio,
• ticket-in/ticket-out penetration,
• regulatory compliance cost per position,
• refresh interval for legacy systems.
A multivariate regression on these drivers, blended with ARIMA smoothing for cyclical tourism shocks, projects demand through 2030. Bottom-up gaps (e.g. tribal casino opacity) were adjusted using anonymized channel checks before final sign-off.
Data Validation & Update Cycle
Outputs pass variance thresholds against AGA revenue benchmarks and quarterly vendor earnings. Outliers trigger re-contact of at least two subject-matter experts. Reports refresh each year, and any material event, such as a national legalization or major M&A, prompts an interim update before client delivery.
Why Mordor's Casino Management Software Baseline Earns Operator Trust
Published estimates often diverge because firms pick different venue sets, bundle hardware variably, or convert currencies at unmatched dates.
Key gap drivers include: competitors mixing online-only platforms with land-based spend, aggressive ASP escalation assumptions, or older base years that ignore post-pandemic refurbishment spikes. Mordor's model locks on regulated brick-and-mortar properties, uses mid-year USD average rates, and refreshes annually, giving decision-makers a steadier baseline.
Benchmark comparison
| Market Size | Anonymized source | Primary gap driver |
|---|---|---|
| USD 7.57 B (2025) | Mordor Intelligence | - |
| USD 9.46 B (2024) | Global Consultancy A | Includes surveillance hardware bundles and limited venue verification |
| USD 8.42 B (2024) | Industry Association B | Blends online casino platforms; assumes 19 % CAGR without module-level cross-checks |
Taken together, the comparison shows that when scope creep and unvetted assumptions are stripped away, Mordor delivers a balanced, transparent baseline grounded in tracked venues, clearly stated exclusions, and a repeatable update cadence; qualities that asset managers and system vendors alike rely upon for strategy setting.


Key Questions Answered in the Report
What is the current value of the casino management systems market?
The casino management systems market size reached USD 8.69 billion in 2026 and is on track to hit USD 17.13 billion by 2031.
How fast is cloud adoption growing among casinos?
Cloud deployments are expanding at a 16.90% CAGR through 2031 as operators switch from capital purchases to subscription payments.
Which region is the fastest-growing for casino management platforms?
Asia-Pacific leads with an 18.10% CAGR, driven by integrated-resort builds in Japan, Thailand, and Singapore.
Why are analytics modules in high demand?
Real-time AML regulations and responsible-gaming standards require instant transaction monitoring, making analytics the fastest-growing module at a 17.50% CAGR.
Page last updated on:


