
Technology, Media and Telecom
5th MayPricing Strategy for Semiconductor Components
3 Min Read
The Smart Waste Management Market Report is Segmented by Solution (Fleet Management, Remote Monitoring, Analytics, and More), Component (Hardware, Software, and More), Waste Type (Industrial Waste, Residential Waste, and More), Application (Smart Collection, Smart Processing, and More), Deployment (Cloud-Based and On-Premises), and Geography.
Market Overview
| Study Period | 2019 - 2030 |
|---|---|
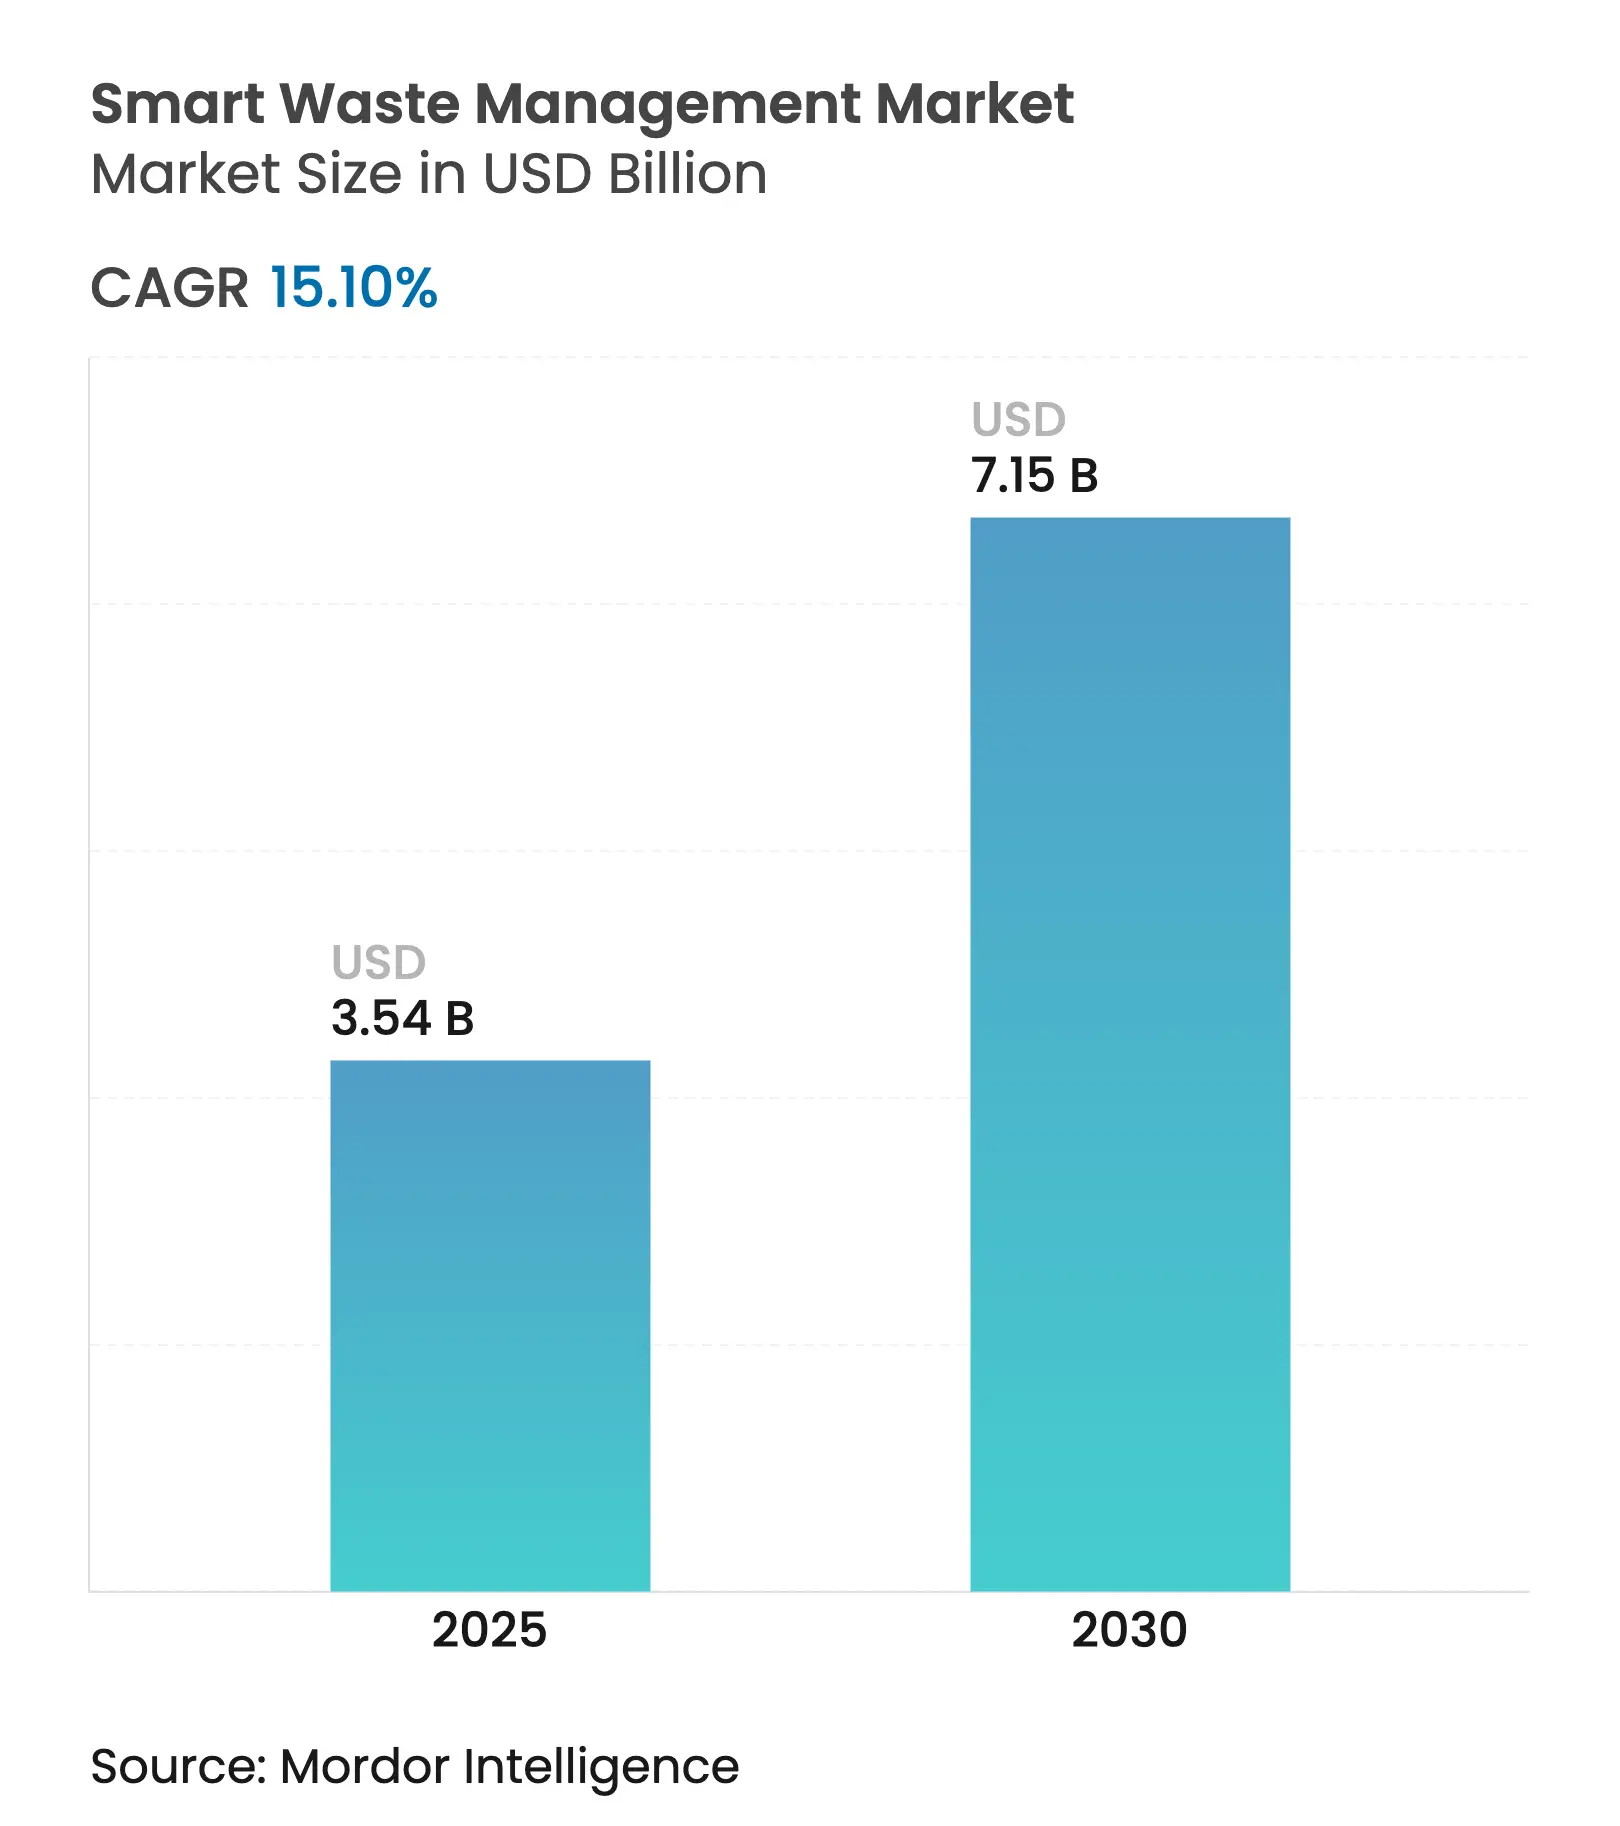
| Market Size (2025) | USD 3.54 Billion |
| Market Size (2030) | USD 7.15 Billion |
| Growth Rate (2025 - 2030) | 15.10 % CAGR |
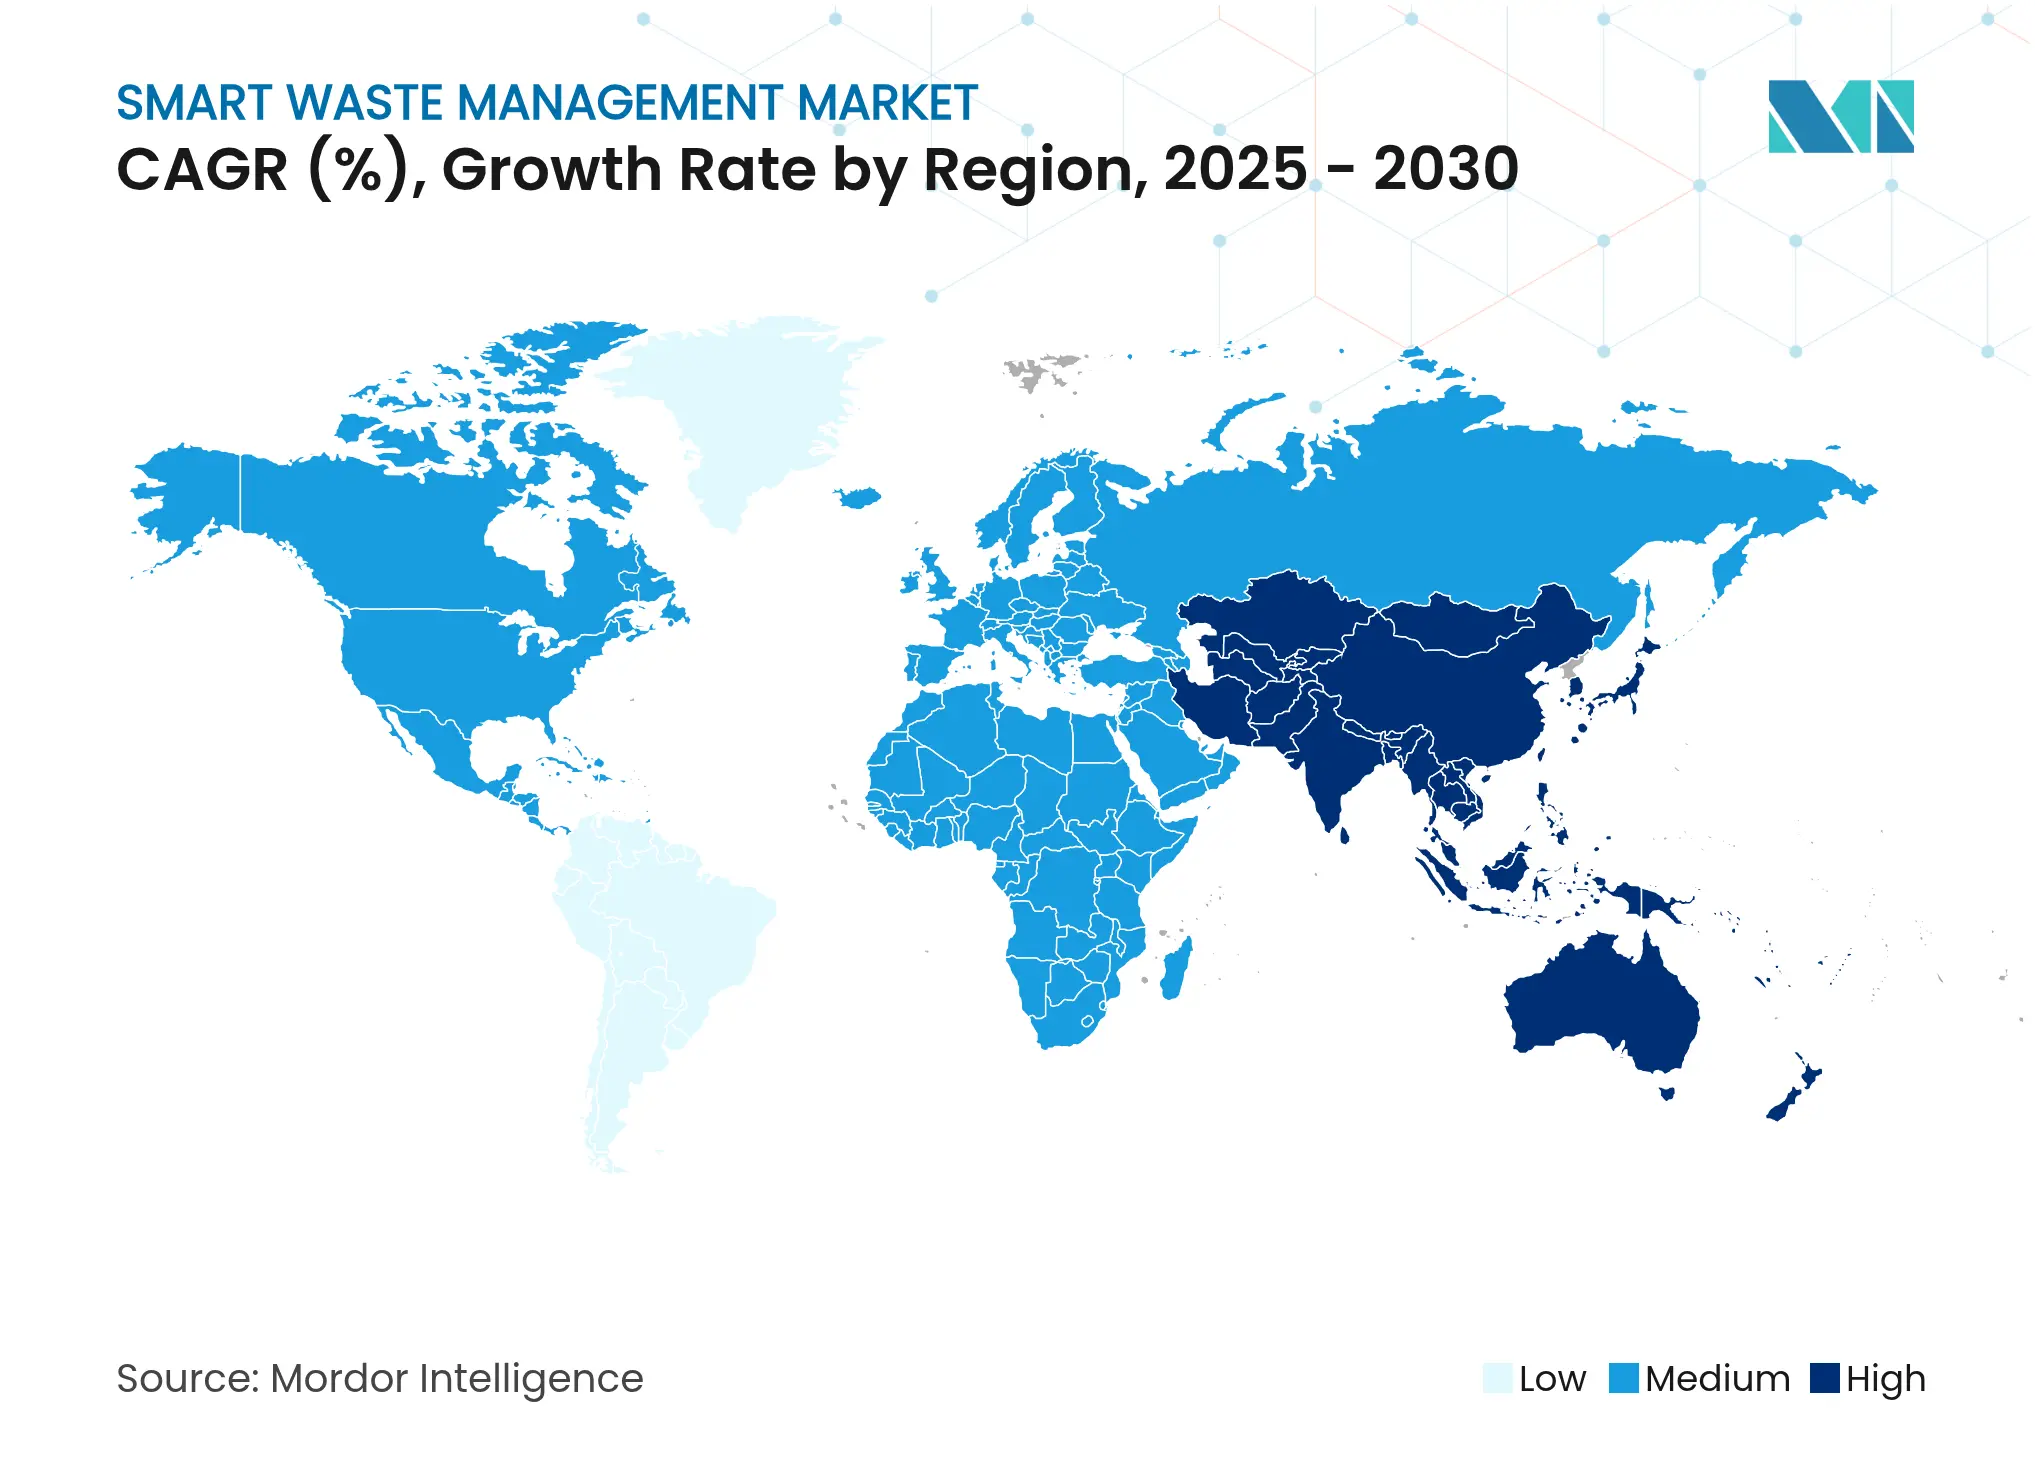
| Fastest Growing Market | Asia Pacific |
| Largest Market | North America |
| Market Concentration | Medium |
Major Players*Disclaimer: Major Players sorted in no particular order. Image © Mordor Intelligence. Reuse requires attribution under CC BY 4.0. |
Rapid urbanisation, tightening carbon regulations, and mounting landfill levies make data-driven waste services a fiscal necessity for municipalities rather than an optional upgrade. Lower IoT sensor prices, wider 5G and LPWAN footprints, and maturing AI platforms enable real-time visibility into collection, slashing fuel expenditure while ensuring compliance with circular-economy rules. Carbon-credit programmes now monetize diverted organics, and pay-as-you-throw schemes provide cities with new recurring revenue streams. Venture investors channel capital into AI-driven robotic sorting start-ups, and incumbent haulers accelerate consolidation to secure technology capabilities, creating a balanced landscape where innovation and scale coexist.
Key Report Takeaways
Drivers Impact Analysis
| Driver | (~) (%) Impact on CAGR Forecast | Geographic Relevance | Impact Timeline | |||
|---|---|---|---|---|---|---|
Data-driven route optimisation cuts fuel use Data-driven route optimisation cuts fuel use | +2.8% | Global, early adoption in North America and EU | Medium term (2–4 years) | (~) (%) Impact on CAGR Forecast:+2.8% | Geographic Relevance :Global, early adoption in North America and EU | Impact Timeline :Medium term (2–4 years) |
Pay-as-you-throw programmes boost municipal ROI Pay-as-you-throw programmes boost municipal ROI | +2.1% | North America and EU core, expanding to APAC | Short term (≤ 2 years) | |||
Growth of smart-city budgets Growth of smart-city budgets | +3.2% | Global, led by APAC and North America | Long term (≥ 4 years) | |||
Stricter e-waste take-back mandates Stricter e-waste take-back mandates | +1.9% | EU leadership, expanding globally | Medium term (2–4 years) | |||
VC funding for AI‐robotic sorting start-ups VC funding for AI‐robotic sorting start-ups | +1.7% | North America and EU, with APAC emergence | Short term (≤ 2 years) | |||
Carbon-credit monetisation from diverted waste Carbon-credit monetisation from diverted waste | +1.4% | Global, with regulatory support in developed markets | Long term (≥ 4 years) | |||
| Source: Mordor Intelligence | ||||||
Data-driven route optimisation cuts fuel use
Real-time fill-level sensors and AI routing engines shorten vehicle kilometres travelled by 25% and reduce diesel consumption by 10%, attacking the single largest controllable cost in collection operations. Dynamic routing ends the practice of emptying half-full bins, lessening traffic congestion and CO₂ emissions while sustaining service regularity. Fleet managers prefer cloud dashboards that visualise predicted fill curves so that crews leave depots only when beneficial. The model scales gracefully across dense urban grids and suburban zones, proving attractive to budget-constrained public works departments. As carbon pricing gains traction, verified fuel savings also translate into tradable carbon credits, reinforcing the investment case for sensor-based optimisation.
Pay-as-you-throw programmes boost municipal ROI
Massachusetts and Maine towns applying PAYT have cut disposed tonnage by 44% and shifted collection costs from property taxes to direct user fees. Bin-mounted load cells transmit weight data that billing engines convert into household invoices, creating a transparent feedback loop that nudges residents toward recycling. Finance directors welcome the model’s ability to stabilise budgets by linking service usage to cost recovery, while environmental officers highlight the social equity benefits of charging only for waste generated. The mechanism generates reliable cash flows that can be reinvested in sensor roll-outs or recycling infrastructure, reinforcing a virtuous cycle of waste minimisation and fiscal resilience within the smart waste management market.
Growth of smart-city budgets
Municipal IT plans now earmark larger allocations for digital waste platforms because collection quality is highly visible to citizens and because payback periods are shorter than for many other smart-city verticals. Development banks in Asia package solid-waste hardware, software, and capacity-building services inside comprehensive urban-infrastructure loans.[1]Asian Development Bank, “Integrated Solid-Waste Projects,” adb.org Procurement teams increasingly bundle remote monitoring, analytics, citizen-feedback apps, and carbon-reporting modules into a single tender, allowing suppliers to amortise R&D costs over wider functional footprints. This preference lifts average contract sizes and promotes ecosystem partnerships between haulers, telecom carriers, and platform vendors, cementing the smart waste management market as a cornerstone of broader smart-city roadmaps.
Stricter e-waste take-back mandates
Basel-Convention amendments effective January 2025 oblige prior governmental consent for all cross-border e-waste shipments, adding paperwork intricacy that digital tracking platforms can automate.[2]US Environmental Protection Agency, “Basel Convention Amendments,” epa.gov South Korea will extend its RoHS-style rules to every electric product by 2026, and the EU lengthens producer-responsibility scopes year by year. Compliance now hinges on tamper-proof chain-of-custody records and precise material reconciliation, tasks well suited to IoT tag reading and blockchain-backed ledgers. These mandates accelerate demand for AI sorting robots that can separate plastics, metals and circuit boards cleanly, raising recovery value and feeding secondary-raw-material supply chains for consumer-electronics makers.
Restraints Impact Analysis
| Restraint | (~) % Impact on CAGR Forecast | Geographic Relevance | Impact Timeline | |||
|---|---|---|---|---|---|---|
High retrofit costs for legacy fleets High retrofit costs for legacy fleets | -1.8% | Global, particularly acute in developing markets | Medium term (2-4 years) | (~) % Impact on CAGR Forecast:-1.8% | Geographic Relevance :Global, particularly acute in developing markets | Impact Timeline :Medium term (2-4 years) |
Patchy LPWAN / 5G coverage in rural routes Patchy LPWAN / 5G coverage in rural routes | -1.3% | Rural areas globally, severe in developing regions | Short term (≤ 2 years) | |||
Data-privacy concerns over bin-level sensors Data-privacy concerns over bin-level sensors | -0.9% | EU and North America primarily | Long term (≥ 4 years) | |||
Slow payback in low-density municipalities Slow payback in low-density municipalities | -1.1% | Rural and suburban areas globally | Medium term (2-4 years) | |||
| Source: Mordor Intelligence | ||||||
High retrofit costs for legacy fleets
A complete sensor, telematics and hydraulic-weight-cell upgrade can reach USD 25,000 per truck, straining municipal capital limits, especially in smaller jurisdictions reliant on ageing vehicles. Fragmented cab-ling layouts and proprietary onboard computers demand custom interfaces, stretching installation timelines and inflating labour bills. Cities therefore phase deployments over replacement cycles, stalling network effects that depend on data density. Suppliers react with subscription models bundling hardware amortisation into monthly fees, yet balance-sheet restrictions keep adoption uneven, tempering growth potential within segments of the smart waste management market.
Patchy LPWAN / 5G coverage in rural routes
Many rural roads traverse shadow zones where LoRa or NB-IoT signals drop below functional thresholds, forcing bins into store-and-forward modes that erode the immediacy of analytics. Municipalities can erect private gateways, but upfront tower, backhaul and maintenance expenses rival the sensor costs they seek to recoup. Some pilot deployments resort to satellite back-up for remote transfer stations, though bandwidth tariffs constrain high-frequency data pushes. Until carrier roll-outs close these gaps, remote districts will deploy only partial smart functionality, slowing penetration in lower-density catchments of the smart waste management market.
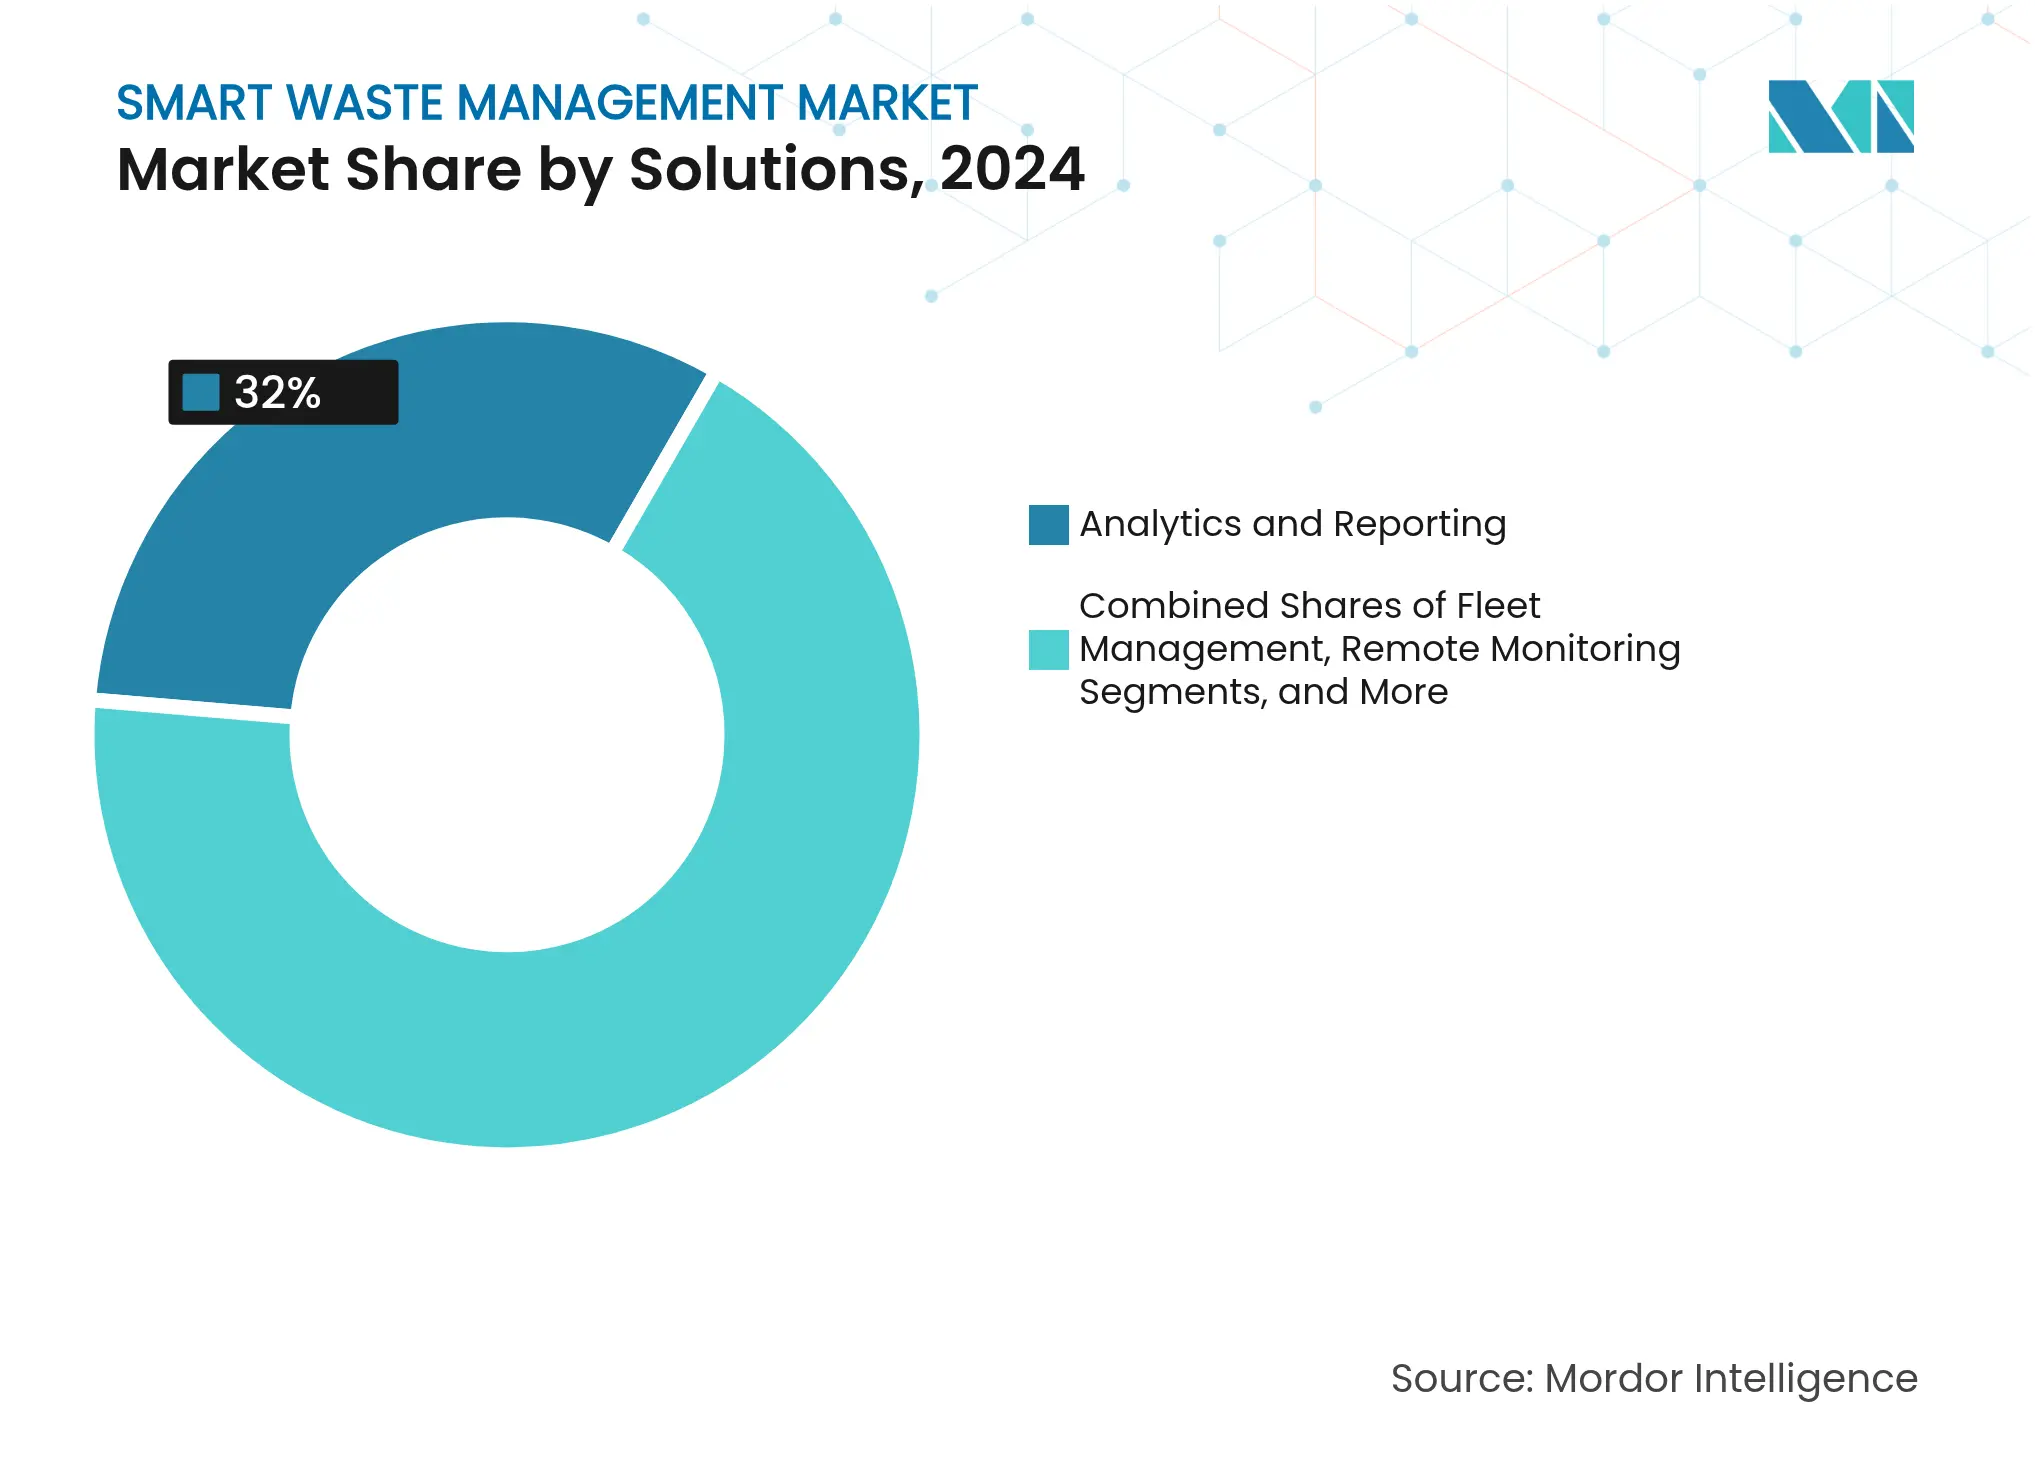
By Solution: Analytics Unlock Operational Intelligence
Analytics and Reporting held 32% share of the smart waste management market in 2024 and is forecast to post a 17.21% CAGR through 2030. Cities gravitate to cloud dashboards that translate raw sensor readings into digestible KPIs such as missed pickup alerts, fuel burned per tonne and greenhouse-gas abatement. Predictive models ingest historical fill trends, weather patterns and event calendars to schedule dynamic routes days ahead, lifting truck utilisation rates and resident satisfaction simultaneously. Fleet-management modules overlay live GPS breadcrumbs and diagnostic alerts, minimising unscheduled downtime and extending asset life. Mobile workforce tools then deliver turn-by-turn updates to in-cab tablets, closing the feedback loop between analytics insights and frontline execution.
Synergies grow as separate solution pillars converge. Asset-management engines now recommend optimal bin-placement based on pedestrian footfall data, while remote monitoring flags contamination events that threaten recycling quality. AI video analytics spot illegal dumping incidents, forwarding geotagged evidence to enforcement teams. These cross-module workflows create switching costs that solidify vendor positions and expand total contract values, underpinning robust revenue momentum for the smart waste management market.
Note: Segment shares of all individual segments available upon report purchase
By Component: Software Platforms Enable Integration
Software products captured 41% of the smart waste management market size in 2024 and are projected to accelerate at 20.11% CAGR to 2030 as municipalities embrace subscription pricing that sidesteps heavy capex. Cloud architectures deliver over-the-air feature updates and cybersecurity patches, eliminating field visits. Vendor APIs facilitate plug-and-play links with city ERPs, carbon registries and citizen-reporting apps, unlocking network effects that widen the addressable base. Hardware still underpins data capture, yet commoditised sensors fall in price each year, shifting the spending mix toward software functionality and value-added analytics.
Service revenue grows in tandem as integrators design change-management roadmaps, train crews, and monitor data-quality dashboards. Managed-service contracts bundle warranty, analytics tuning, and compliance reporting into predictable monthly fees, aligning supplier incentives with customer outcomes. This recurring-revenue profile attracts private-equity interest and fuels consolidation plays that reshape the competitive contours of the smart waste management market.
By Waste Type: Residential Dominance Meets E-Waste Momentum
Residential streams contributed 46% of 2024 revenue because households present the most frequent collection cycles and offer clear citizen-engagement benefits to elected officials. Bin-level sensors discourage over-stuffing, and smartphone apps nudge residents to separate organics, raising diversion rates and increasing verified carbon-credit earnings. Smart-tagged bags support PAYT billing, anchoring the economic model for ongoing technology refreshes.
E-waste, however, outpaces all categories at a 15.9% CAGR through 2030. Producer-responsibility mandates, data-destruction liabilities, and high raw-material recovery values justify robotics capable of 99.3% classification accuracy.[3]AETECH, “AI Sorting Accuracy Report,” aetech.co Automated depopulation equipment pulls batteries and chips with minimal human contact, cutting injury risk and reclaiming critical metals for domestic supply chains. Commercial and industrial segments still matter, with dense downtown business districts offering lucrative route-optimisation upside, yet compliance-heavy e-waste is where technology differentiation most strongly rewards suppliers inside the smart waste management market.

Recognized by Experts. Trusted by Leaders.
A trusted intelligence partner to global decision-makers across 90+ countries.


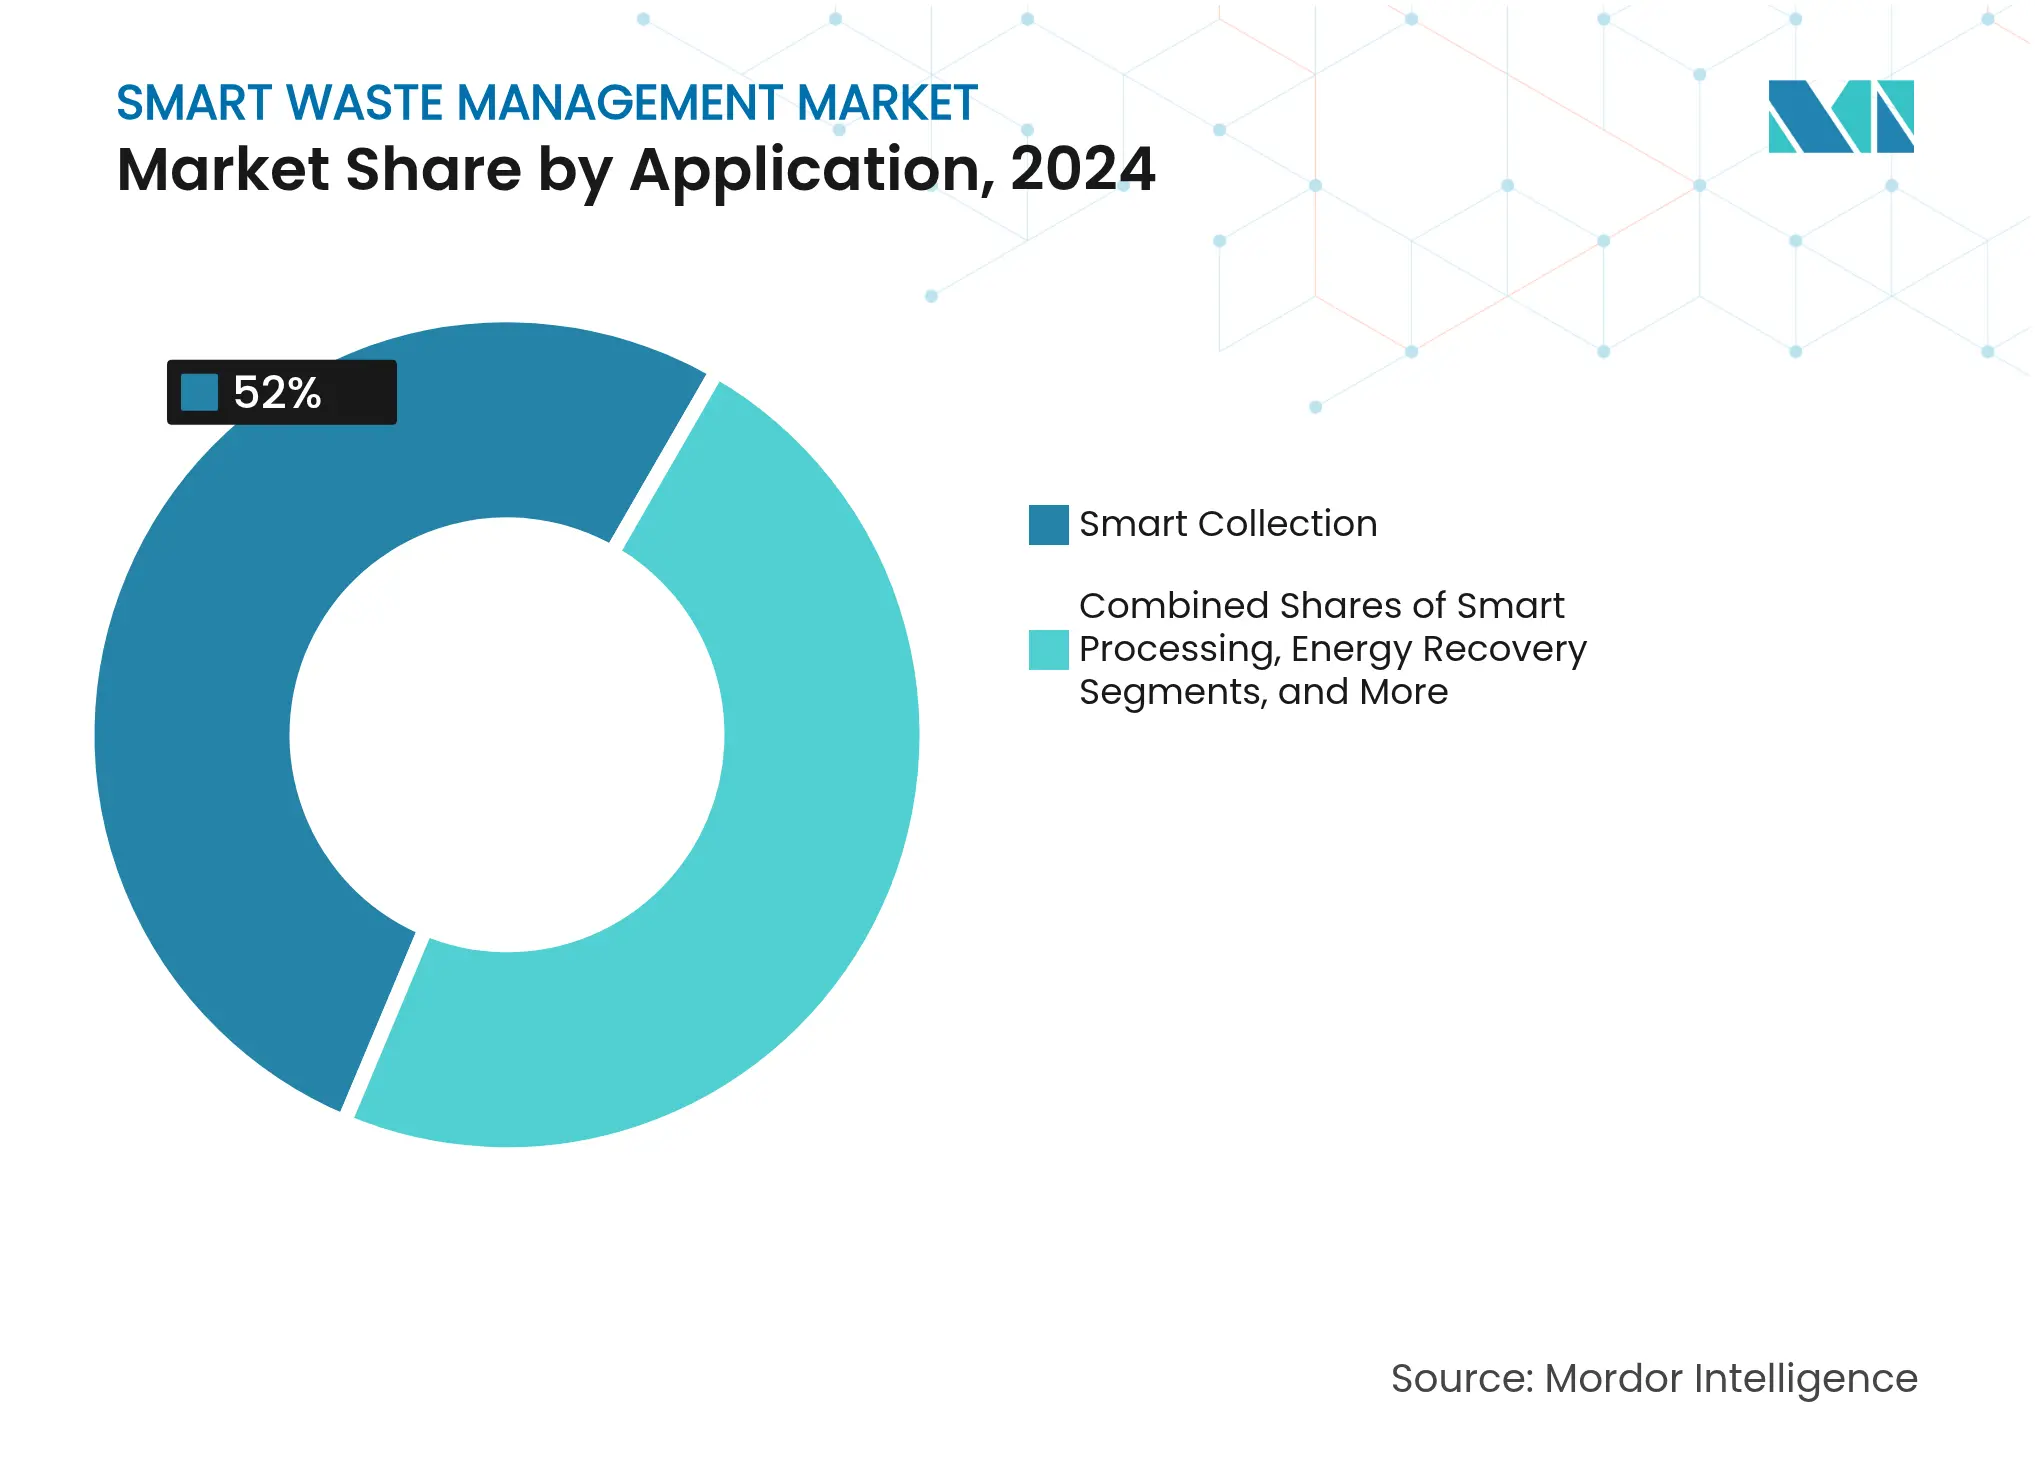
By Application: Smart Collection Leads Immediate Savings
Smart Collection accounted for 52% of 2024 revenue and maintains the highest 22.53% CAGR outlook because fuel, labour, and truck maintenance dominate municipal budgets. Fill-level telemetry, traffic feeds, and weather data combine in route engines that recalculate daily manifests, trimming idle time and overtime expenditure. Cities report that fewer kilometres and fewer stops extend brake and tyre life, providing a compounding maintenance dividend.
Smart Processing is the next frontier as optical sorters, AI vision, and robotics raise material-recovery facility throughput and purity. Energy-recovery units converting organics into renewable natural gas deliver decarbonisation credits under many greenhouse-gas protocols. Landfill-gas monitoring platforms predict leachate levels and methane spikes, guiding cap installation timelines. Integrated application suites therefore stretch the life of disposal assets and diversify revenue, reinforcing upward momentum across the wider smart waste management market.
By Deployment: Cloud Adoption Accelerates Accessibility
Cloud installations already make up 61% of active deployments and advance at 21.12% CAGR because small and mid-sized municipalities lack on-premises IT staff. Subscription models convert capital projects into operating expenses, simplifying budget approvals. Multi-tenant setups allow vendors to amortise R&D, bring down per-seat pricing and roll out enhancements weekly. Built-in redundancy and professional security operations meet stringent data-sovereignty rules now found in most procurement laws, easing policymaker concerns.
On-premises still persists in jurisdictions with strict public-sector hosting mandates or unreliable external connectivity. Hybrid architectures push latency-sensitive calculations, such as robotic-sorter vision inference, to edge gateways while housing dashboards in the cloud. This flexibility widens the addressable pool and sustains diverse go-to-market strategies for platform providers inside the smart waste management market.
Smart Waste Management Market in North America
North America held 38% of the smart waste management market share in 2024 on the back of mature telecom networks, early carbon-pricing schemes, and federal infrastructure grants that subsidise smart-city deployments. Bigbelly’s solar compacting bins cut pickups by up to 80% in New York and Boston, validating cost savings that unlocked follow-on rollouts.[4]Bigbelly, “City Deployments,” bigbelly.com Canada’s offset protocol for organics diversion lets projects such as SusGlobal’s Belleville facility monetise 105,000 verified credits, enhancing payback periods. Regional haulers also capitalise on the Inflation Reduction Act, which offers clean-fleet tax credits, accelerating electric-truck pilots tied to sensorised routing software.
Asia Pacific is the fastest-growing region at a 16.7% CAGR, propelled by urbanisation and national digital-infrastructure programmes. Japan’s Kawagoe City deploys SmaGO bins equipped with solar panels, compressors and cellular modems that message fill status to control rooms, cutting overflow complaints at tourist sites. South Korea’s tightened RoHS framework drives AI sorting investments, and China’s Zero-Waste City pilots showcase measurable landfill and CO₂ reductions via integrated sensor networks. Multilateral lenders provide concessional loans that bundle waste-management hardware, connectivity and analytics, lowering entry barriers for secondary-tier cities and expanding the overall smart waste management market.
Europe sustains robust adoption thanks to 20 years of circular-economy policy evolution. Basel-Convention conformity, landfill-tax escalators and aggressive recycling targets spur municipalities to track every tonne digitally. Veolia’s EUR 4 billion GreenUp plan deploys advanced hazardous-waste tracking and resource-regeneration systems, signalling corporate commitment at scale veolia.com. Energy-from-waste plants integrate carbon-capture modules with real-time emissions dashboards that feed into EU sustainable-finance disclosures, showing how compliance and technology interlock. Cross-border initiatives standardise API schemas so bin-sensor data can feed national statistical agencies, further entrenching digital infrastructure across the region’s smart waste management market.
Smart Waste Management Market in United States
The United States dominates the North American smart waste management market as the largest country segment. The nation's leadership position is supported by the extensive implementation of strategic waste management programs across major cities and municipalities. With approximately 88% share of the North American market in 2024, the United States demonstrates strong adoption of smart waste management solutions. The country's growth is driven by government initiatives promoting sustainability, the penetration of smart city waste management initiatives across highly urbanized regions, and an increasing focus on efficient waste collection and disposal practices.
Smart Waste Management Market in Canada
Canada represents a growing market for smart waste management solutions, with a forecasted growth rate of approximately 13% from 2024 to 2029. The country's market is characterized by increasing industrialization and expansion of the residential sector, which creates substantial demand for smart waste management solutions. Canadian cities and municipalities are actively seeking innovative solutions to address waste management challenges, improve efficiency, and promote sustainability. The government's initiatives to create a clean environment and reduce waste material are driving the adoption of smart waste management systems across the country.
Smart Waste Management Market in Europe
Europe demonstrates a strong commitment to smart waste management solutions, supported by progressive environmental policies and technological innovation across the region. The market landscape spans key countries, including Germany, the United Kingdom, France, Spain, and Italy, each contributing significantly to the regional market development. The region's growth is driven by increasing urbanization, stringent waste management regulations, and widespread adoption of smart city waste management initiatives.
Smart Waste Management Market in Germany
Germany leads the European smart waste management market with approximately 21% share of the regional market in 2024. The country's dominance is attributed to its advanced waste management infrastructure and strong focus on technological innovation. Germany applies a five-stage waste hierarchy: prevention, reuse preparation, recycling, alternative forms of recovery, and disposal, making it one of the most advanced nations in terms of waste management technology and systems globally.
Smart Waste Management Market in United Kingdom
The United Kingdom exhibits the highest growth potential in the European region, with a projected growth rate of approximately 18% from 2024 to 2029. The country's rapid market expansion is driven by the increasing implementation of sensors, IoT devices, and data analytics to optimize waste collection and improve efficiency. The UK's commitment to environmental sustainability and smart city waste management initiatives has led to significant investments in smart waste management technologies, particularly in urban areas.
Smart Waste Management Market in Asia-Pacific
The Asia-Pacific region represents a dynamic market for smart waste management solutions, characterized by rapid urbanization, increasing environmental awareness, and growing government initiatives. Key markets include China, India, Australia, and Japan, each contributing uniquely to the regional market development. The region's transformation is driven by smart city waste management initiatives, rising environmental concerns, and the need for efficient waste management systems in rapidly growing urban areas.
Smart Waste Management Market in China
China emerges as the largest market in the Asia-Pacific region, demonstrating strong adoption of smart waste management solutions. The country's leadership in the market is supported by extensive implementation of smart city waste management technologies and significant investments in waste management infrastructure. The Chinese State Council's initiatives for developing zero-waste cities and the integration of artificial intelligence in waste management systems showcase the country's commitment to advanced waste management solutions.
Smart Waste Management Market in Australia
Australia represents the fastest-growing market in the Asia-Pacific region, showing remarkable progress in smart waste management adoption. The country's growth is driven by a strong focus on sustainability initiatives and environmental protection measures. The implementation of AI-powered smart waste systems and advanced waste sorting technologies demonstrates Australia's commitment to innovative waste management solutions, particularly in urban areas.
Smart Waste Management Market in Rest of the World
The Rest of the World region, encompassing Latin America, the Middle East, and Africa, shows increasing adoption of smart waste management solutions. The market growth in these regions is primarily driven by rapid urbanization, industrialization, and an increasing focus on sustainable waste management practices. While the market is still developing, significant investments in smart city waste management initiatives, particularly in the Middle East, are creating new opportunities for smart waste management solutions. The United Arab Emirates leads the market in this region, while Brazil shows the fastest growth potential, driven by increasing adoption of smart city technologies and government initiatives promoting sustainable waste management practices.
Market Concentration
Top Companies in Smart Waste Management Market
Market structure remains moderately concentrated, with top haulers controlling fleet assets while platform vendors own the software stack. Waste Management Inc. moved decisively by acquiring Stericycle for USD 7.2 billion in 2024, adding regulated-medical-waste capability and expanding service breadth. The deal combines Stericycle’s niche expertise with WM’s buying power for sensors and trucks, positioning the enlarged entity to bid for bundled municipal contracts that demand both standard and hazardous services.
AI-centric disruptors such as AMP Robotics illustrate the performance gap achievable with vision systems that sort 150 tons daily at 60% landfill diversion rates. Their technology gains traction as rising labour costs and purity standards squeeze manual MRF operations. Partnerships with haulers like Waste Connections convert pilot wins into multi-facility rollouts, demonstrating a template for start-up scale-up within the smart waste management market.
Private equity also reshapes dynamics. EQT’s majority stake in AMCS Group underscores confidence in usage-based billing software and end-to-end operations suites. Routeware’s purchase of Rubicon’s fleet-technology wing exemplifies segmentation where platform specialists concentrate on routing, telematics and billing, allowing haulers to license functionality rather than build internally. As consolidation proceeds, suppliers able to blend hardware, cloud analytics and service integration gain structural advantage, while niche innovators focus on high-margin e-waste robotics, carbon-credit registries and advanced energy-recovery modules to capture specific profit pools inside the smart waste management market.

*Disclaimer: Major Players sorted in no particular order
1. INTRODUCTION
2. RESEARCH METHODOLOGY
3. EXECUTIVE SUMMARY
4. MARKET LANDSCAPE
5. MARKET SIZE and GROWTH FORECASTS (VALUE)
6. COMPETITIVE LANDSCAPE
7. MARKET OPPORTUNITIES and FUTURE OUTLOOK
The process of implementing a technique used to monitor the collection, disposal, and transportation of waste material services for efficient waste management operations is known as smart waste management. This relates to the Internet of Things (IoT), which includes numerous cameras, portable computers, and other devices.
The smart waste management market is segmented by solution (fleet management, remote monitoring, analytics), waste type (industrial waste, residential waste), and geography (North America (United States, Canada), Europe (Germany, United Kingdom, France, Italy, Spain, and Rest of Europe), Asia Pacific (India, China, Japan, Australia, and Rest of Asia-Pacific), and Rest of the World). The market size and forecasts are provided in terms of value (USD) for all the above segments.
Pricing Strategy for Semiconductor Components
3 Min Read
Accelerating Additive Manufacturing Adoption in India
3 Min Read
When decisions matter, industry leaders turn to our analysts. Let’s talk.