Revenue Cycle Management Market Size and Share
Market Overview
| Study Period | 2020 - 2031 |
|---|---|
| Market Size (2026) | USD 95.22 Billion |
| Market Size (2031) | USD 154.39 Billion |
| Growth Rate (2026 - 2031) | 10.15% CAGR |
| Fastest Growing Market | Asia Pacific |
| Largest Market | North America |
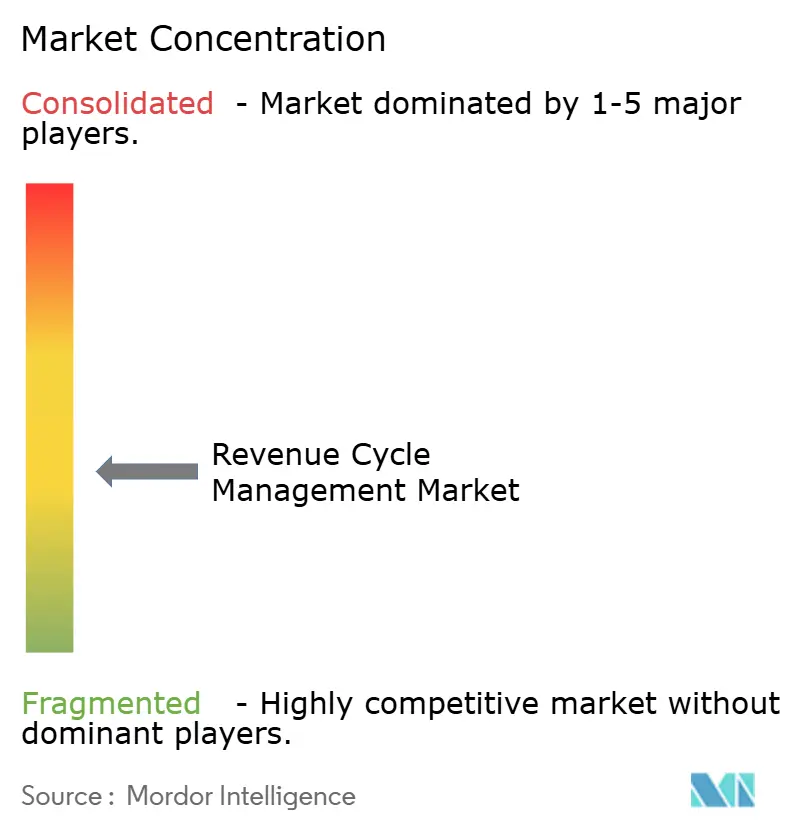
| Market Concentration | Medium |
Major Players *Disclaimer: Major Players sorted in no particular order Image © Mordor Intelligence. Reuse requires attribution under CC BY 4.0. | |
Revenue Cycle Management Market Analysis by Mordor Intelligence
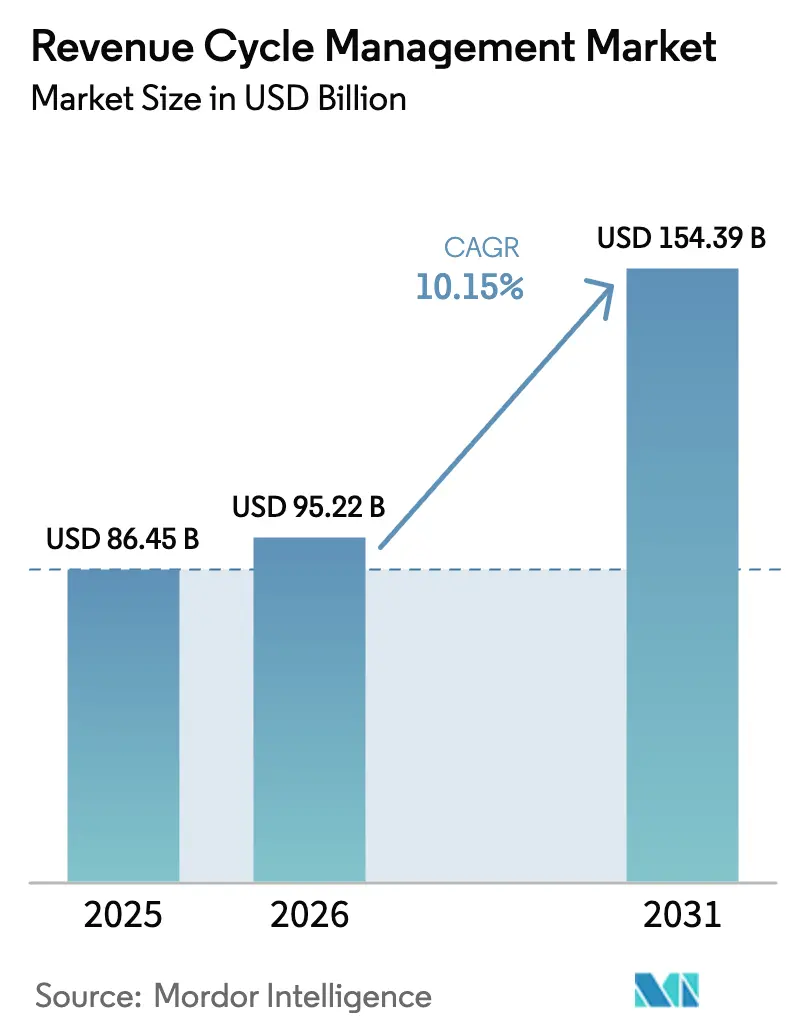
The revenue cycle management market size is expected to grow from USD 86.45 billion in 2025 to USD 95.22 billion in 2026 and is forecast to reach USD 154.39 billion by 2031 at 10.15% CAGR over 2026-2031. Expanding administrative overhead, the pivot toward value-based reimbursement, and widening AI adoption are combining to make automated revenue capture a board-level necessity. Providers are prioritizing integrated platforms that merge clinical documentation, denial avoidance, and cash-flow analytics in one workspace, cutting manual touches and shortening days in accounts receivable. North American health systems continue to anchor demand, yet rising private-insurance penetration in Asia-Pacific is unlocking sizable new addressable volumes. Service outsourcing remains prevalent because staffing gaps persist, but cloud software’s rapid acceleration signals a gradual hand-off from labor-heavy models to subscription-based architectures that scale with patient volumes. The net effect is heightened competition among technology vendors that can wrap predictive analytics and compliance updates into a single, interoperable stack.
Key Report Takeaways
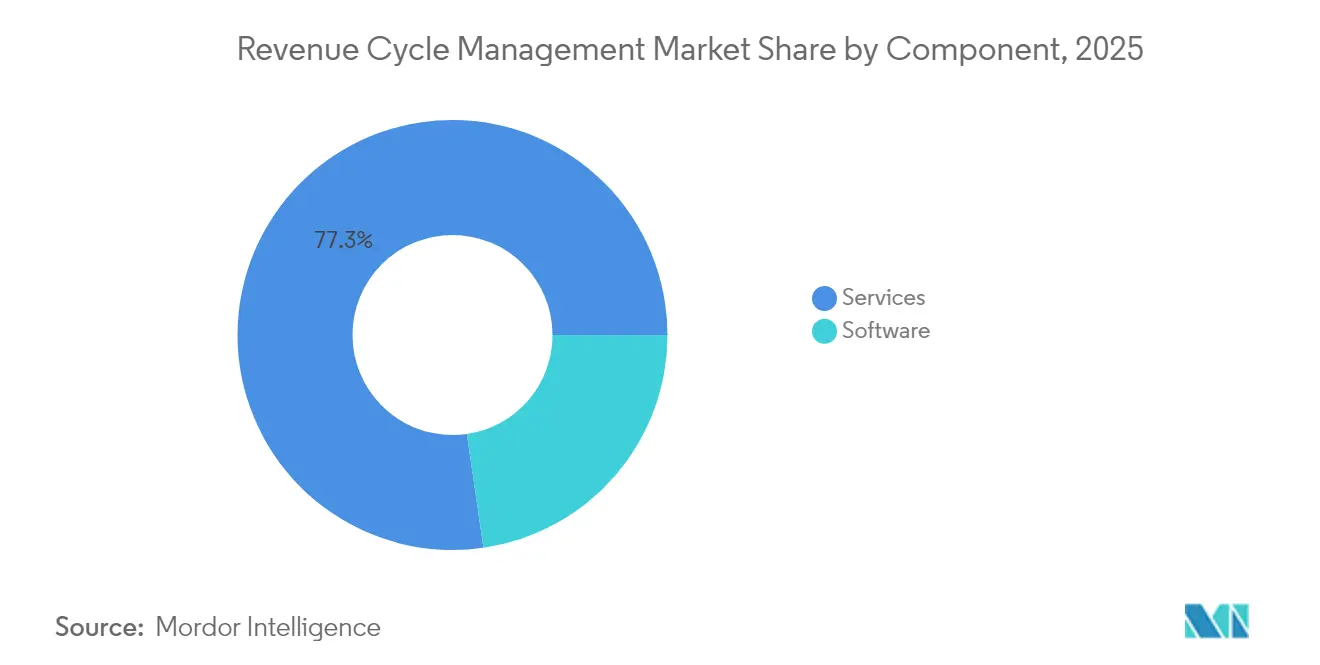
- By component, services held 77.30 % of the market in 2025, while cloud-based software is projected to grow at a 13.65 % CAGR through 2031.
- By deployment, on-premise solutions accounted for a 57.90 % share in 2025, whereas cloud-based models are expected to rise fastest at a 13.65 % CAGR through 2031.
- By function, claims and denial management captured 33.40 % of 2025 revenue, while clinical documentation improvement is anticipated to expand at a 15.05 % CAGR through 2031.
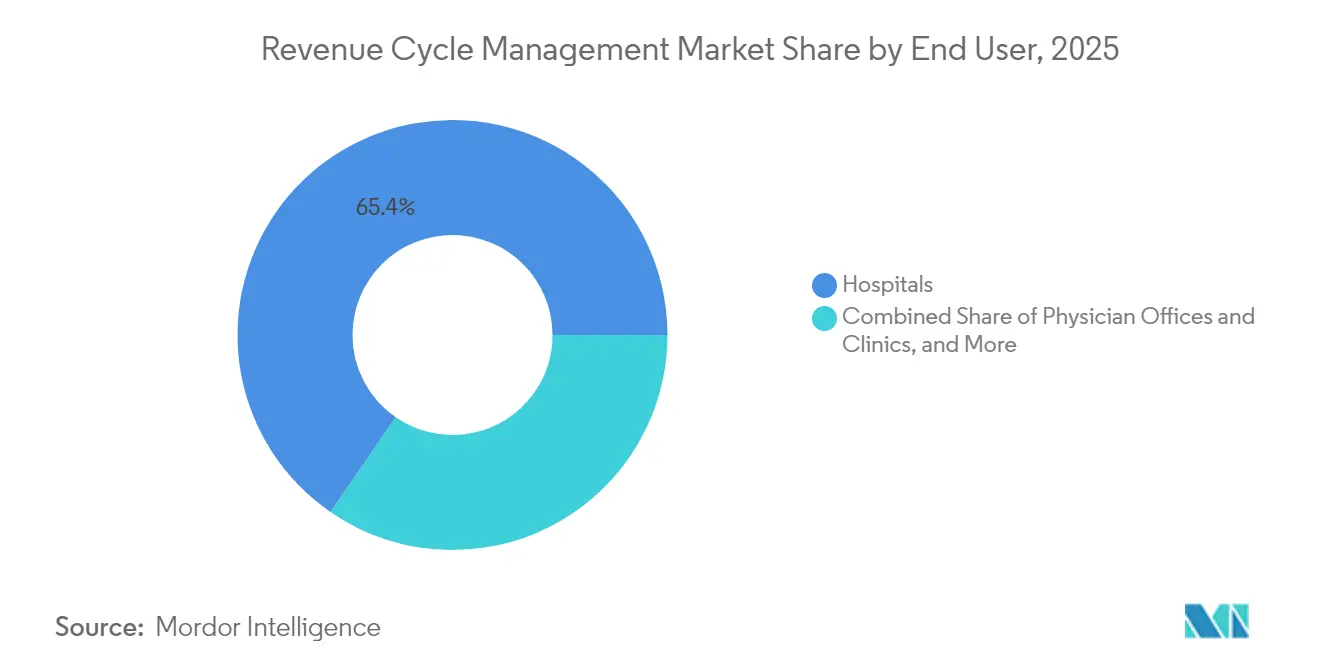
- By end user, hospitals secured a 65.40 % revenue share in 2025, while ambulatory surgery centers are set to grow most quickly at a 13.42 % CAGR through 2031.
- By specialty, radiology led with a 41.20 % share in 2025, whereas oncology is forecast to climb at a 13.88 % CAGR through 2031.
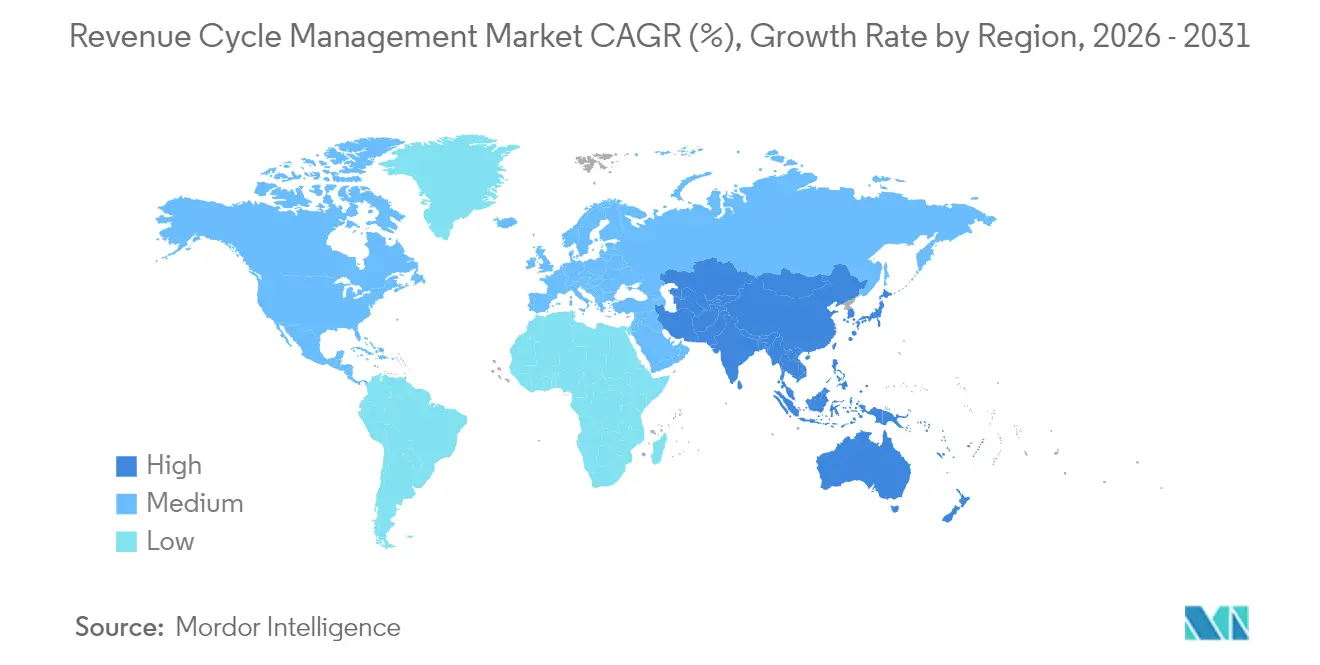
- By geography, North America dominated with a 47.20 % share in 2025, yet Asia-Pacific is predicted to expand fastest at a 15.92 % CAGR to 2031.
Note: Market size and forecast figures in this report are generated using Mordor Intelligence’s proprietary estimation framework, updated with the latest available data and insights as of 2026.
Global Revenue Cycle Management Market Trends and Insights
Drivers Impact Analysis*
| Driver | (~) % Impact on CAGR Forecast | Geographic Relevance | Impact Timeline |
|---|---|---|---|
| Global Shift Toward Value-Based & Outcome-Linked Reimbursement | +2.4% | North America, APAC, EU | Medium term (3-4 years) |
| Escalating Administrative Cost Pressure Prompting RCM Automation | +1.8% | Global | Short term (≤2 years) |
| Accelerated Digital-Health & Interoperability Mandates Worldwide | +1.3% | Global, with early APAC uptake | Medium term (3-4 years) |
| Consumerization of Healthcare Increasing Patient Billing Complexity | +0.8% | North America, EU | Short term (≤2 years) |
| Proliferation of Cloud-Native Health IT Platforms and SaaS Economics | +1.2% | Global, APAC core, spill-over to MEA | Medium term (3-4 years) |
| Source: Mordor Intelligence | |||
Global Shift Toward Value-Based & Outcome-Linked Reimbursement
Value-based care, now written into major payer contracts, is recasting Revenue Cycle Management industry priorities by tying payment to clinical quality rather than service volume. Health systems that adopted accountable care frameworks recorded collective savings in excess of USD 700 million, proving that financial upside exists once organizations master quality metrics. As a response, RCM platforms are integrating population-health dashboards that translate clinical outcomes into reimbursement triggers, ensuring that providers track gaps in care before payment risk materializes. That evolution implicitly demands normalized data from disparate sources, giving interoperability a new commercial urgency.
Escalating Administrative Cost Pressure Prompting RCM Automation
Administrative expenses routinely consume 20 – 25 % of United States healthcare spending, so executives view automation as a proven lever to arrest cost inflation. AI-enabled bots now complete routine prior authorization transactions in seconds, a process that previously required manual review and days of staff follow-up, and some hospitals have documented a 50 % reduction in claim preparation time after deployment. These improvements free billing professionals to concentrate on complex exceptions, generating an unplanned productivity dividend that management can redeploy toward patient-facing roles. Importantly, institutions that automate admit-through-cash workflows report heightened staff satisfaction because tedious, error-prone data entry tasks disappear.
Accelerated Digital-Health & Interoperability Mandates Worldwide
Regulators in multiple regions now demand frictionless data exchange, accelerating EHR penetration and pushing RCM vendors to deliver plug-and-play APIs that synchronize clinical and financial records. The Healthcare Financial Management Association’s five-stage Revenue Cycle Management Technology Adoption Model shows that 42 % of health systems remain at Stage 1, highlighting untapped market potential for orchestration layers that bridge disparate applications[1]Healthcare Financial Management Association, “Revenue Cycle Management Technology Adoption Model,” Healthcare Financial Management Association, hfma.org. Provider executives report that the framework clarifies gaps in their technology roadmaps, and those insights often lead to vendor rationalization as clients favor unified platforms. Early adopters believe that consistent data structures reduce payer abrasion because clean claims cycle through adjudication workflows with minimal intervention.
Consumerization of Healthcare Increasing Patient Billing Complexity
High-deductible health plans shift financial responsibility to patients, so providers must recalibrate revenue strategies toward transparent, retail-like experiences. Front-end estimation tools that present out-of-pocket costs before service are becoming standard because they improve collections and enhance patient trust. At the same time, flexible payment plans and digital wallets reduce bad-debt write-offs by aligning repayment schedules with household cash flow, a trend that forces RCM platforms to embed consumer finance logic. Facilities adopting automated eligibility verification report fewer surprise bills and strengthened community reputation, an outcome that indirectly supports procedural volume growth.
Restraints Impact Analysis*
| Restraint | (~) % Impact on CAGR Forecast | Geographic Relevance | Impact Timeline |
|---|---|---|---|
| Heterogeneous, Ever-Changing Payer Rules and Coding Standards | -1.6% | North America, EU, APAC | Short term (≤2 years) |
| Persistent Shortage of Skilled Coding & RCM Talent | -1.2% | Global, with acute effects in APAC & MEA | Medium term (~3-4 years) |
| Data-Privacy & Cyber-security Risks Handling Protected Health Info | -0.7% | North America, EU | Medium term (~3-4 years) |
| High Up-Front Investment and Change-Management Barriers | -0.9% | Global, especially among small/medium providers | Short term (≤2 years) |
| Source: Mordor Intelligence | |||
Heterogeneous, Ever-Changing Payer Rules and Coding Standards
Denial rates hovering around 10 – 15 % illustrate how quickly payer edits and policy updates can overturn otherwise compliant claims. Medical group leaders confirm that denials climbed further in 2024, so organizations are investing in continuous code updates and predictive scrubbers that flag likely rejections before submission[2]Medical Group Management Association, “MGMA Stat: Claim Denial Trends,” Medical Group Management Association, mgma.com. Forward-looking health systems allocate dedicated teams to mine denial root causes, and iterative feedback loops between coders and clinicians are shortening correction cycles. AI-driven rules engines that self-learn from payer remittances now deliver measurable reductions in attachment requests, cutting administrative overhead.
Persistent Shortage of Skilled Coding and RCM Talent
Despite technology gains, complex cases still require specialized coders, yet the talent pool remains thin as retirements outpace new certifications. Health systems fill the gap by outsourcing certain revenue cycle functions, often negotiating outcome-based contracts that align vendor compensation with collected cash. Outsourcing decisions, in turn, accelerate consolidation among global business process firms eager for health-IT exposure, pushing the revenue cycle management market size upward. Inside hospital walls, leaders expand upskilling initiatives so entry-level staff can interpret AI recommendations and oversee exception queues, a pivot that raises internal training budgets.
*Our forecasts treat driver/restraint impacts as directional, not additive. The impact forecasts reflect baseline growth, mix effects, and variable interactions.
Segment Analysis
By Component: Services Dominate While Cloud Software Accelerates
Services hold 77.30% market share of the Revenue Cycle Management market size in 2025, mirroring providers’ preference for turnkey expertise amid staffing shortages. Clients view outsourcing as an immediate route to improved collections because service partners assume responsibility for technology investment and continuous process refinement. Nevertheless, cloud-based software is posting a 13.65% CAGR through 2031, more than the overall market growth, because subscription pricing aligns cost with usage and removes large capital hurdles.
Hospitals that implement cloud RCM suites often discover secondary benefits, such as real-time dashboards that spotlight physician documentation gaps, enabling corrective coaching within a single shift. Over time, these analytics capabilities encourage in-house teams to transition from transactional tasks to strategic revenue integrity roles. The dual-track growth pattern implies that hybrid operating models, combining retained oversight with selective outsourcing—will become common, broadening the Revenue Cycle Management industry opportunity for both software firms and service bureaus.


By Deployment: Cloud-Based Growth Outpaces On-Premise Installations
On-premise deployments retain 57.90% Revenue Cycle Management market share in 2025, reflecting earlier capital purchases and residual security concerns. Yet cloud installations are expanding at a 13.65% CAGR to 2031, propelled by flexible infrastructure, automatic upgrades, and easier integration with payer APIs. Organizations that climb the HFMA technology-adoption curve frequently cite cloud moves as the inflection point when cycle-time metrics start to trend downward. One observed benefit is faster implementation of regulatory code sets, since cloud vendors push updates centrally instead of relying on client IT teams.
As cyber-security frameworks mature, board-level resistance to off-site hosting is receding, and CFOs note that predictable subscription fees simplify multi-year budgeting. This cost transparency acts as a hidden accelerant to overall Revenue Cycle Management market size growth because even mid-tier hospitals can now access features that were once reserved for large academic centers.
By Function: Claims & Denial Management Faces Technological Disruption
Claims and denial workflows represent 33.40% of the Revenue Cycle Management market size in 2025, spotlighting the centrality of clean claims to provider solvency. AI-driven pre-adjudication editing now achieves 98 % clean-claim rates for some users, an efficiency level that historically required vast human review. That success is pushing vendors to embed similar logic in related functions, such as coordination of benefits, which yields incremental cash lift without additional headcount.
Clinical documentation improvement, however, is advancing fastest at 15.05% CAGR because higher coding precision feeds downstream claims accuracy, creating a compounding benefit. Health systems that invested in AI-powered CDI tools documented multi-million-dollar revenue improvements within 12 months, changes that surprised even veteran finance leaders. As algorithms mature, they start recommending documentation fixes at the point of care, effectively merging clinical and financial workflows, a shift that broadens the definition of RCM itself.
By End User: Ambulatory Surgery Centers Emerge as Growth Hotspot
Hospitals account for 65.40% EBITDA-weighted Revenue Cycle Management market share in 2025, yet Ambulatory Surgery Centers (ASCs) are logging a 13.42% CAGR to 2031, illustrating outpatient migration of procedures. ASCs execute high-volume specialty cases at lower reimbursement rates, so they prioritize streamlined billing to protect narrow margins. Increased reliance on commercial plans means that eligibility verification and patient-payment collection must occur before the day of surgery to minimize write-offs. RCM vendors that design ASC-specific templates, notably for gastroenterology and ophthalmology CPT codes, report accelerated sales cycles because administrators value turnkey content over generic workflow engines.
Furthermore, as ASCs expand into joint-venture arrangements with health systems, revenue-cycle standards converge, allowing software providers to cross-sell hospital clients on outpatient modules. This convergence raises the revenue cycle management industry revenue pool by stitching together previously separate client segments.
By Specialty: Radiology Specialty Drive Integration Requirements
Radiology commanded a leading 41.20% share in 2025, while oncology is projected to surge at a 13.88% CAGR, continuing through 2031. Cardiology, oncology, radiology, and pathology each carry unique coding constructs, yet multi-specialty groups increasingly operate on shared practice-management platforms that must interpret all of them. Providers notice that unified RCM improves referral network visibility, leading to better patient retention and additional service revenue.
Specialty-agnostic rule libraries compiled by AI engines shorten new-clinic onboarding by mapping codes to payer edits automatically. At the same time, clinicians appreciate real-time coding prompts because fewer downstream queries interrupt patient care. Vendors that prove they can support specialty depth and enterprise breadth simultaneously are capturing Revenue Cycle Management market share as medical groups grow larger via acquisition.
Geography Analysis
North America commands 47.20% of the current Revenue Cycle Management market size, supported by complex multi-payer frameworks and a long history of EHR adoption. Vendor consolidation is active, evidenced by R1 RCM’s USD 8.9 billion transaction, signaling private-equity conviction that scaled process expertise can deliver outsized cash-flow gains. Hospitals in the United States report that 46% already utilize some form of AI in revenue-cycle workflows. Interestingly, Canadian single-payer structures still require RCM tools for provincial reconciliation, revealing that payer complexity is not the only growth driver. The region’s reimbursement transparency mandates create rich data sets, enabling vendors to refine machine-learning models faster than elsewhere, reinforcing North American leadership.
Asia-Pacific is forecast to post a 15.92% CAGR through 2031, the fastest regional pace in the Revenue Cycle Management industry, propelled by government-backed digital-health investments and swelling middle-class demand for private insurance. India’s national insurance expansion is catalyzing standardized claims infrastructure, and hospitals that digitize billing early capture accelerated settlement times. China’s tier-three city hospitals increasingly seek cloud RCM to leapfrog older client-server models, mirroring the smartphone adoption curve seen in other industries. Local partners remain critical for navigating regulatory approval in markets such as Japan, where data localization laws shape hosting architecture. This need for contextual adaptation presents a barrier to entry for global vendors but simultaneously offers high returns to firms that secure first-mover standing.
Europe retains meaningful Revenue Cycle Management market share, although growth is steadier because many countries operate single-payer models that centralize claim standards. Even so, GDPR requirements push hospitals toward cloud environments with strict encryption and audit trails, spurring joint ventures between U.S. and European software firms experienced in privacy engineering. In the United Kingdom, the National Health Service’s renewed focus on backlog reduction has elevated interest in AI scheduling and billing triage features that resemble private-sector RCM. Meanwhile, Middle East, Africa, and South America represent emerging territories where private hospital chains drive early demand, setting a foundation for accelerated adoption once regulatory frameworks mature.
Mordor Intelligence provides coverage of the revenue cycle management market across other key regional markets. Detailed country-level analysis extends to United States incorporating local coverage and market participation, as required.

Competitive Landscape
The Revenue Cycle Management market exhibits moderate fragmentation: a handful of large integrated health-IT suppliers coexist with specialized service pure-plays and nimble AI start-ups. Oracle Cerner and Epic Systems defend their installed EHR bases by embedding financial features directly into clinical workflows, reducing interface expenses for clients. That advantage pressures stand-alone vendors to innovate faster on denial prediction and prior authorization automation to retain relevance.
Mergers and acquisitions are narrowing the field; private-equity sponsors target RCM because recurring revenue and cost-containment dynamics align with portfolio objectives. The result is a pipeline of mega-deals that consolidate coding shops, denial-management boutiques, and automation software under unified brands. Providers benefit because bundled offerings simplify vendor management, although critics warn that market power could later translate into price escalation for embedded services. In the near term, integrated tech-services hybrids that provide both software and labor appear best positioned to win enterprise contracts where risk-share pricing and outcome guarantees are table stakes.
Technology differentiation increasingly hinges on explainable AI; hospitals demand transparency around model-driven code suggestions to satisfy auditors. Vendors respond by adding lineage dashboards that display which payer edits informed a prediction, an approach that builds trust and accelerates regulatory acceptance. Interoperability also shapes competition; platforms that ingest FHIR-based data without custom interfaces lower total cost of ownership and appeal to CIOs standardizing digital infrastructure. Consequently, the next competitive battleground is likely to revolve around open ecosystems rather than closed suites, even for incumbent giants.
Revenue Cycle Management Industry Leaders
R1 RCM Inc.
eClinicalWorks
Veradigm LLC
MCKESSON Corporation
Athenahealth, Inc.
- *Disclaimer: Major Players sorted in no particular order

Recent Industry Developments
- May 2025: Infinx acquired i3 Verticals' Healthcare Revenue Cycle Management business and proprietary technology for a cash deal valued at USD 96 million, underscoring the rising demand for AI-driven platforms.
- April 2025: Syracuse Orthopedic Specialists chose Veradigm Revenue Cycle Services and Coding Services to support expansion goals, illustrating provider confidence in integrated data and RCM offerings.
- May 2024: Nextech introduced Nextech RCM professional billing services within its practice-management suite, positioning the firm to capture specialty-practice demand for unified clinical and financial workflows.


Research Methodology Framework and Report Scope
Market Definitions and Key Coverage
Our study defines the revenue cycle management (RCM) market as the total annual spend on purpose-built software platforms and outsourced services that help healthcare providers capture charges, code encounters, submit claims, follow up on denials, and post payments across inpatient and outpatient settings worldwide. We track only commercial RCM solutions sold by third-party vendors or business-process outsourcers; routine in-house payroll costs and pure consulting fees fall outside this boundary.
Scope exclusion: internal provider payroll linked to billing offices is not included.
Segmentation Overview
- By Component
- Software
- Integrated RCM Suite
- Standalone Modules
- Services
- Outsourced RCM BPO
- Consulting & Training
- Software
- By Deployment
- Cloud-based
- On-premise
- By Function
- Claims & Denial Management
- Medical Coding & Billing
- Electronic Health Record (Integrated RCM)
- Clinical Documentation Improvement (CDI)
- Insurance Eligibility Verification
- Other Functions (Patient Scheduling, Pricing Transparency)
- By End User
- Hospitals
- Physician Offices & Clinics
- Ambulatory Surgery Centers
- Laboratories
- Diagnostic Imaging Centers
- Other End Users
- By Specialty
- Radiology
- Oncology
- Cardiology
- Pathology
- Multi-specialty & Others
- Geography
- North America
- United States
- Canada
- Mexico
- Europe
- Germany
- United Kingdom
- France
- Italy
- Spain
- Rest of Europe
- Asia-Pacific
- China
- Japan
- India
- Australia
- South Korea
- Rest of Asia-Pacific
- Middle East and Africa
- GCC
- South Africa
- Rest of Middle East and Africa
- South America
- Brazil
- Argentina
- Rest of South America
- North America
Detailed Research Methodology and Data Validation
Primary Research
Mordor analysts held structured interviews with hospital finance chiefs, revenue-integrity managers, and senior product leads at RCM vendors across North America, Europe, and Asia Pacific. These conversations tested pricing corridors, cloud transition speed, and denial pain points, letting us fine-tune model assumptions and cross-check secondary signals.
Desk Research
We began by mapping the demand pool with freely available health-system indicators such as Centers for Medicare & Medicaid Services national health expenditure tables, American Hospital Association utilization statistics, World Bank hospital bed datasets, OECD health price indices, and ICD-10 claims denial benchmarks released by the Office of Inspector General. Company filings, investor decks, and leading hospital network annual reports supplied adoption rates and average selling prices.
To validate ownership structures and revenue splits, we tapped paid resources from D&B Hoovers and Dow Jones Factiva, then layered in shipment traces from Volza that highlight cross-border software deliveries. These references illustrate our approach; many other public and subscription sources were analyzed for triangulation and clarity.
Market-Sizing & Forecasting
We constructed a top-down demand pool using provider counts, average claims volume per facility, and prevailing spend per claim. Select bottom-up roll-ups of large vendor revenues and channel checks served as a reasonableness screen before locking totals. Key model variables include electronic health record penetration, outsourced billing share, payer denial rates, payer mix shifts toward value-based contracts, and regional health-expenditure growth. Multivariate regression captures how each driver steers RCM outlays, and scenario analysis adjusts for regulatory or reimbursement shocks.
Data Validation & Update Cycle
Outputs run through variance checks against historical denial ratios and vendor filings, followed by peer review and a manager sign-off. Reports refresh every twelve months, and we trigger interim updates when reimbursement rules change materially or an acquisition reshapes market share.
Why Our Revenue Cycle Management Baseline Commands Reliability
Published figures vary widely because firms choose different scopes, cost layers, and refresh cadences. According to Mordor Intelligence, sticking to licensed software and outsourced services and excluding internal payroll keeps the lens consistent.
Key gap drivers include whether internal billing staff costs are bundled, if software and services are blended with broader healthcare IT, currency conversion practices, and the frequency of model refresh. Some publishers also apply aggressive cloud-adoption ramps that inflate outer-year totals.
Benchmark comparison
| Market Size | Anonymized source | Primary gap driver |
|---|---|---|
| USD 86.45 B | Mordor Intelligence | - |
| USD 384.63 B | Global Consultancy A | Adds internal provider payroll and payer-side admin spend |
| USD 163.72 B | Trade Journal B | Blends RCM with broader healthcare IT platforms |
| USD 61.11 B | Regional Consultancy C | Narrows scope to software only, omits service contracts |
The comparison shows that once apples are matched with apples, our disciplined scope selection and annual refresh give decision-makers a balanced, reproducible baseline they can trace back to clear variables and defensible steps.


Key Questions Answered in the Report
What is the Revenue Cycle Management market size in 2026?
The market stands at USD 95.22 billion in 2026.
How fast is the Revenue Cycle Management industry expected to grow?
It is forecast to register a 10.15 % CAGR, reaching USD 154.39 billion by 2031.
Which region shows the highest Revenue Cycle Management market growth?
Asia-Pacific is projected to grow at a 15.92 % CAGR through 2031, the fastest among all regions.
Why are services still the largest component in the Revenue Cycle Management market share?
Providers continue to outsource revenue-cycle functions to offset staffing shortages and access specialized expertise quickly.
What is driving adoption of cloud-based Revenue Cycle Management platforms?
Cloud solutions reduce capital expenditure, deliver automatic regulatory updates, and improve interoperability with electronic health records.
How does value-based care influence Revenue Cycle Management solutions?
Value-based models require tracking of quality metrics linked to reimbursement, prompting demand for analytics-driven RCM tools that bridge clinical and financial data.
Page last updated on:


