Smart Home As A Service Market Size and Share
Market Overview
| Study Period | 2020 - 2031 |
|---|---|
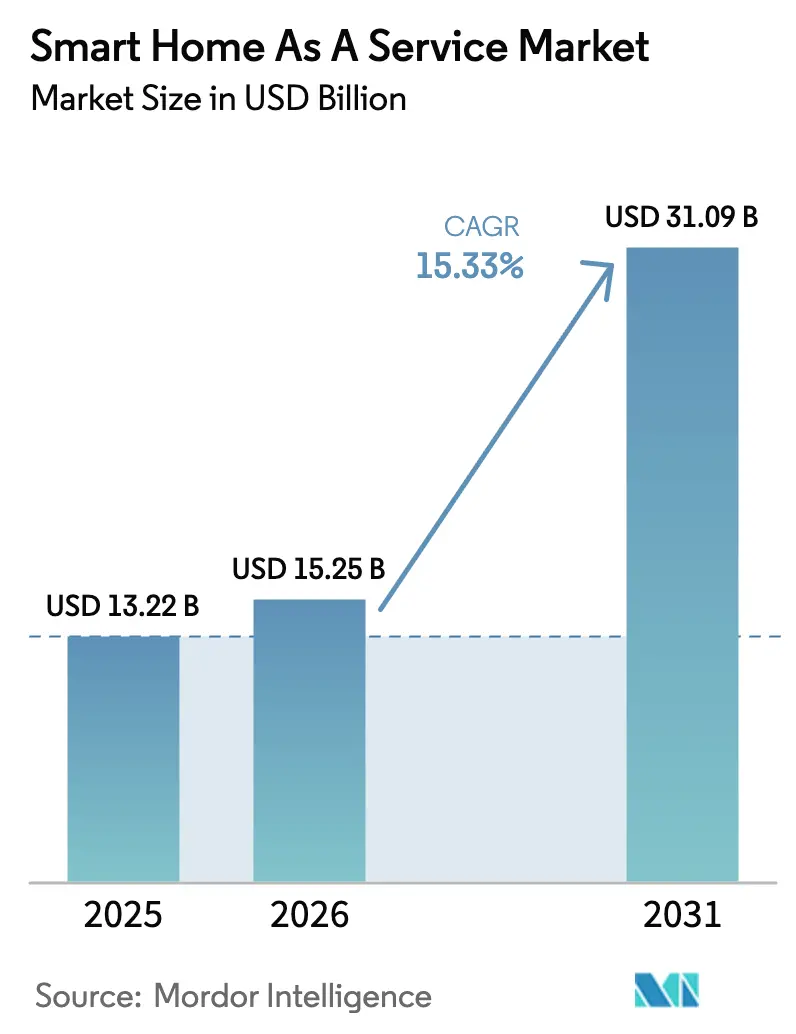
| Market Size (2026) | USD 15.25 Billion |
| Market Size (2031) | USD 31.09 Billion |
| Growth Rate (2026 - 2031) | 15.33% CAGR |
| Fastest Growing Market | Asia Pacific |
| Largest Market | North America |
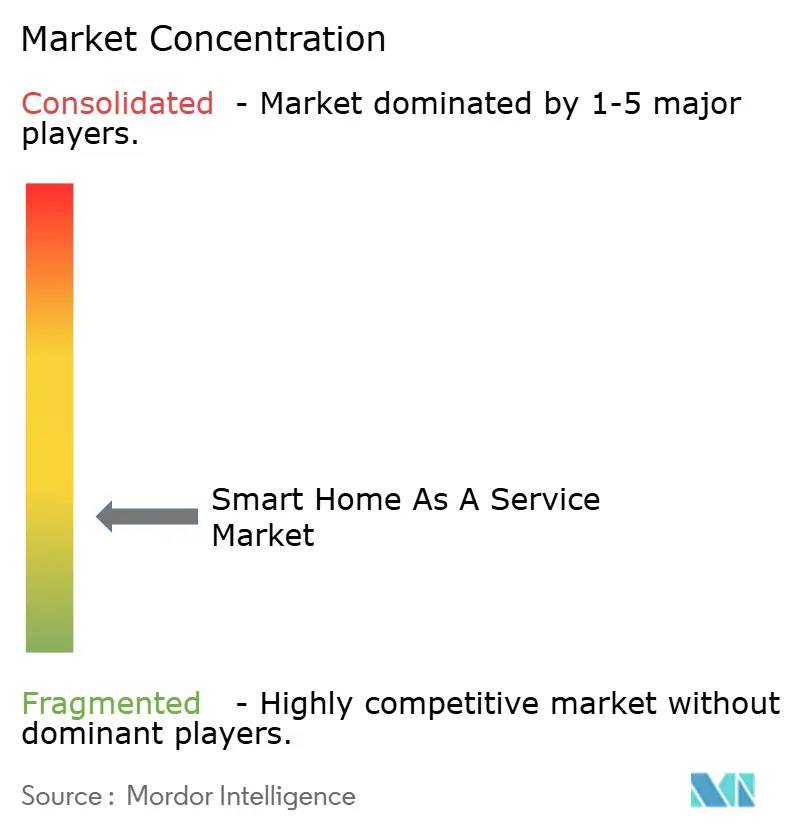
| Market Concentration | Low |
Major Players *Disclaimer: Major Players sorted in no particular order Image © Mordor Intelligence. Reuse requires attribution under CC BY 4.0. | |
Smart Home As A Service Market Analysis by Mordor Intelligence
The smart home as a service market size is expected to grow from USD 13.22 billion in 2025 to USD 15.25 billion in 2026 and is forecast to reach USD 31.09 billion by 2031 at 15.33% CAGR over 2026-2031. Growth was propelled by broadband operators bundling connected-home packages, insurance firms tying premium discounts to active monitoring, and utilities paying consumers for orchestrated appliance loads. Rising demand for interoperable ecosystems over standalone gadgets, ongoing AI-driven feature releases, and pay-as-you-go financing models continued to reinforce the subscription proposition. Competitive intensity stayed high because security providers, telcos, utilities, and big-tech platforms all sought to own the customer relationship. At the same time, up-front device costs, lingering privacy concerns, and partial Matter adoption restrained full-scale penetration, especially in price-sensitive regions.
Key Report Takeaways
- By service type, Managed Services held 74.15% revenue share in 2025, while DIY/Self-Install broadened at a 19.6% CAGR to 2031.
- By solution, Security and Surveillance captured 38.10% of the smart home as a service market share in 2025; Energy and Utility Management is advancing at 22.4% CAGR to 2031.
- By component, Hardware accounted for 47.95% of the smart home as a service market size in 2025; Software/Platforms are growing at 18.6% CAGR.
- By geography, North America led with a 42.20% share in 2025, whereas Asia-Pacific is set to post an 17.7% CAGR to 2031.
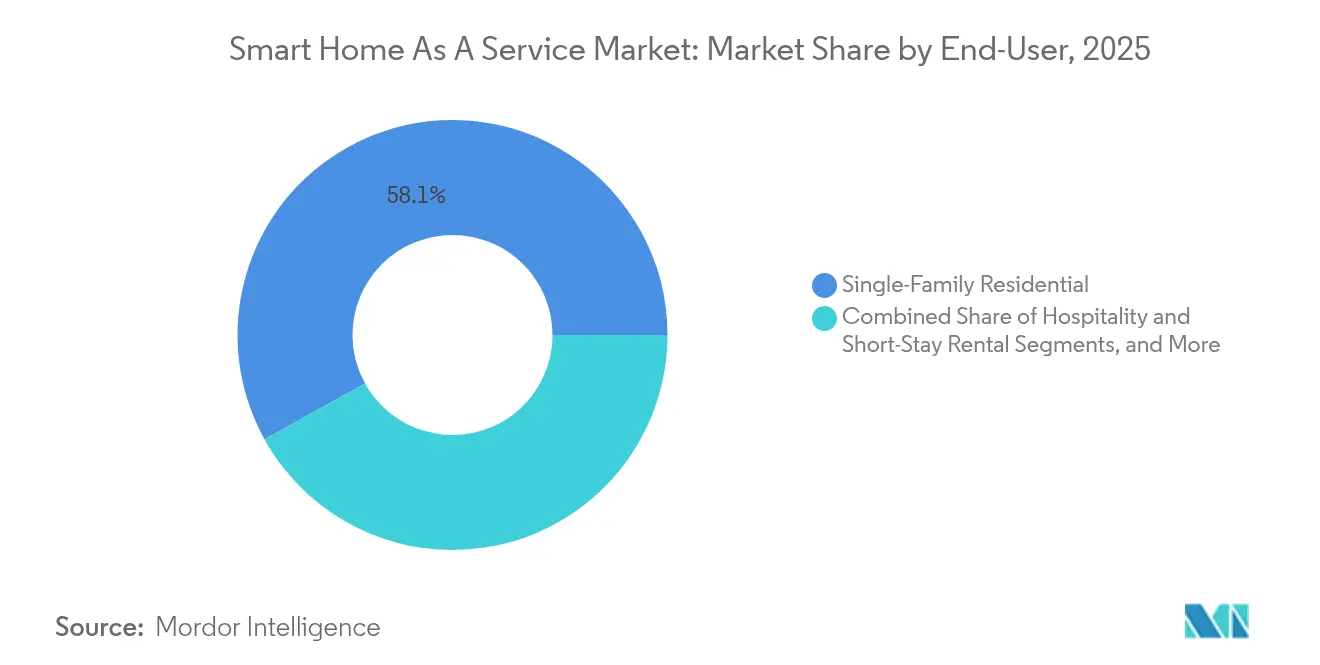
- By end-user, Single-Family Residential commanded 58.05% in 2025, but Multi-Family/MDU will climb at 21.3% CAGR.
- By sales channel, Telco/Cable MSO bundles supplied 39.85% of 2025 sales, while Utilities and ESCOs are scaling fastest at 23.1% CAGR.
Note: Market size and forecast figures in this report are generated using Mordor Intelligence’s proprietary estimation framework, updated with the latest available data and insights as of 2026.
Global Smart Home As A Service Market Trends and Insights
Drivers Impact Analysis*
| Driver | (~) % Impact on CAGR Forecast | Geographic Relevance | Impact Timeline |
|---|---|---|---|
| Rising consumer appetite for seamless home automation | +2.8% | Global, stronger uptake in North America and Europe | Medium term (2-4 years) |
| Rapid advances in IoT, AI, and cloud connectivity | +3.2% | Global, led by Asia-Pacific hubs | Long term (≥4 years) |
| Telco and security firms are bundling subscription smart-home packages | +2.1% | Core markets in North America and Europe | Short term (≤2 years) |
| Smart-amenity race among multi-dwelling-unit property managers | +1.9% | Urban centres worldwide | Medium term (2-4 years) |
| Insurance premium discounts tied to monitored devices | +1.4% | North America and Europe | Medium term (2-4 years) |
| Utility demand-response incentives for orchestrated loads | +2.6% | Early adopters in California, Texas, and Germany | Long term (≥4 years) |
| Source: Mordor Intelligence | |||
Rising Consumer Appetite for Seamless Home Automation
Voice assistants groomed households to expect lighting, climate, and security to collaborate without manual input. Platforms that push real-time software patches and predictive routines, therefore, gained subscription renewals. Samsung SmartThings earned ENERGY STAR certification for energy management in 2023, validating measurable savings that help justify monthly fees.[1]U.S. Environmental Protection Agency, “ENERGY STAR Program Advances Energy Management through Smart Homes,” epa.gov Continuous learning algorithms also reinforced the “no interface” ideal, encouraging providers to prioritize friction-free, behavior-driven automation that customers cannot replicate with piecemeal device purchases.
Rapid Advances in IoT, AI, and Cloud Connectivity
Matter 1.4, released in November 2024, sharpened multi-vendor interoperability and ensured local failover when internet links drop. Concurrent launches of Thread mesh and Wi-Fi 7 hardware reduced latency for security footage and emergency alerts. Edge AI now crunches occupancy and load-profile data on-premise while exporting non-sensitive summaries to the cloud, boosting both privacy perception and response speed. These technical leaps strengthened the smart home as a service market because they arrive mainly through firmware updates rather than fresh hardware, aligning perfectly with recurring-revenue models.
Telco and Security Firms Bundling Subscription-Based Smart-Home Packages
Broadband operators blended automation features with existing voice, video, and mobile plans to lift average revenue per user and lower churn. Comcast’s Xfinity Home surpassed 1 million subscribers by merging monitoring, energy dashboards, and entertainment control into a single fee. Cox extended its mobile play in 2024, pitching an “all-in-one” household bundle that deepened ecosystem lock-in. Security incumbents such as ADT added Google Nest gear plus insurer tie-ins, again reinforcing the subscription ethos.
Smart-Amenity Race Among Multi-Dwelling-Unit Property Managers
Landlords installed smart locks, thermostats, and building-wide Wi-Fi to command rent premiums that reached 5-15% in many U.S. metros. Calix’s SmartMDU delivers turnkey connectivity, letting owners upsell managed internet and automate maintenance workflows. Because residents cannot individually rewire common spaces, property managers increasingly sign multi-year service contracts that amplify the smart home as a service market.
Restraints Impact Analysis*
| Restraint | (~) % Impact on CAGR Forecast | Geographic Relevance | Impact Timeline |
|---|---|---|---|
| Data privacy and cybersecurity concerns | -1.8% | Worldwide, acute in GDPR jurisdictions | Short term (≤2 years) |
| Up-front hardware and installation costs | -2.1% | Developing Asia-Pacific, Latin America | Medium term (2-4 years) |
| Persistent interoperability gaps | -1.3% | Global | Medium term (2-4 years) |
| Grid-resilience mandates delaying approvals | -0.9% | North America and Europe | Long term (≥4 years) |
| Source: Mordor Intelligence | |||
Data-Privacy and Cyber-Security Concerns
Continuous telemetry from cameras, locks, and occupancy sensors unsettled many households, especially in Europe, where GDPR imposes strict consent rules. Studies by the National Association of Home Builders ranked privacy among the top barriers to smart home uptake. Vendors reacted with local encryption, on-device AI, and granular data-sharing panels, yet consumer education still lagged, dampening conversion rates.
Up-Front Hardware and Installation Costs in Price-Sensitive Regions
Turnkey packages often require several hundred USD in devices plus labour fees ranging from USD 79 to USD 250 per unit. The expense limited adoption in emerging economies where disposable income trails developed markets. Some providers tested lease-to-own plans and subsidized starter kits, but balancing acquisition cost against lifetime value remained challenging for investors chasing scale.
*Our forecasts treat driver/restraint impacts as directional, not additive. The impact forecasts reflect baseline growth, mix effects, and variable interactions.
Segment Analysis
By Service Type: Managed Services Lead Despite DIY Growth
Managed Services held a dominant 74.15% share of the smart home as a service market in 2025, underscoring homeowner reliance on professional installation, 24/7 monitoring, and remote diagnostics. Providers leveraged certified technicians and proprietary platforms to reduce downtime, heightening perceived value and justifying subscription pricing. Nevertheless, the DIY/Self-Install slice is expanding at 19.6% CAGR through 2031 as Matter-certified devices and plug-and-play mobile apps cut configuration time to minutes, enabling cost-conscious users to bypass installers altogether. The convergence of AI-based setup assistants and augmented-reality step-by-step guides further narrows the expertise gap. Generative AI copilots that walk users through Zigbee pairing or rule-creation workflows, as showcased by Netguru in late-2024, will accelerate this shift.
Managed players are countering DIY momentum with hybrid models that bundle initial white-glove setup plus self-service feature expansion. Subscription tiers increasingly resemble telecom rate cards where higher-priced bundles unlock enhanced automations, cloud video storage, or energy-savings analytics. Despite the DIY boom, complex whole-home retrofits, elder-care monitoring, and insurance-validated security still favour managed expertise. As a result, the smart home as a service market size for managed offerings is projected to remain larger than DIY through 2031, even while relative share slips a few points.


By Solution: Security Dominance Challenged by Energy Management
Security and Surveillance solutions accounted for 38.10% of the smart home as a service market share in 2025, benefiting from clear ROI in loss prevention and lower insurance deductibles. Door/window sensors, smart locks, and 24/7 video monitoring are integrated smoothly into premium packages, and insurers in North America often offer 5-10% policy discounts for certified installs. Yet Energy and Utility Management is clocking the fastest 22.4% CAGR, fuelled by real-time utility rate signals and aggressive demand-response payouts in California, Texas, and parts of Germany. The Home Connectivity Alliance’s Energy Management Interface, publicized in January 2024, simplified the enrolment of refrigerators, HVAC units, and water heaters into grid programs.
Entertainment, lighting, and window-control applications ride on the same backbone, but their unit economics hinge more on lifestyle convenience than measurable payback. Whole-home automation suites that aggregate security, energy, and wellness sensors into a single dashboard command the highest ARPU, especially when paired with predictive machine-learning routines. As electricity prices continue to climb in deregulated markets, energy dashboards integrated into these suites should widen their addressable audience and enlarge the overall smart home as a service market size.
By Component: Software Platforms Gain Ground on Hardware
Hardware still represented 47.95% of 2025 revenue, reflecting the unavoidable cost of hubs, cameras, and smart breakers. Nonetheless, subscription-priced Software/Platforms will post a 18.6% CAGR through 2031 as recurring analytics, AI inference engines, and API-metered services deliver incremental value beyond the initial installation. Tuya bills developers per 10,000 API calls, illustrating the pivot from one-time license fees to consumption pricing.
Cloud orchestration layers allow over-the-air feature drops, predictive maintenance, and cross-device macros without new physical components. Below that stack, hardware margins keep thinning because commoditized Wi-Fi/BLE radios and reference-design chipsets enter white-label supply chains. Professional and Managed Services sit atop both layers, monetizing peace of mind through on-site support packages and extended warranties. The overall smart home as a service market, therefore, tilts toward software-centric differentiation, aligning the ecosystem with SaaS benchmarks such as net revenue retention and churn minimization.
By End-User: Single-Family Leads While MDU Accelerates
Single-family residential households generated 58.05% of the 2025 demand, aided by ownership autonomy that simplifies major retrofits. Average revenue per household remained highest in this group because owners often combine security, HVAC automation, and outdoor cameras in a single purchase cycle. However, the Multi-Family/MDU segment is advancing at a 21.3% CAGR as property managers chase occupancy rates and operational savings. Smart-lock rollouts eliminate key management, while centralized dashboards cut maintenance truck rolls and utility waste.
Hospitality and short-stay rentals added incremental volume. Airbnb operators deployed contactless check-in, energy presets, and noise sensors to protect property and elevate guest reviews, with 30% already running AI chatbots for 24/7 support in 2025. Small commercial offices are next in line: energy insights, occupancy analytics, and insurance-friendly leak detection mirror residential use-cases, thereby broadening the smart home as a service industry customer base.
By Sales Channel: Telcos Lead While Utilities Surge
Telco/Cable MSO bundles supplied 39.85% of 2025 activations because broadband installers had already entered the home and could up-sell automation during truck visits. Comcast, Cox, and Liberty Global all tied smart-home subscriptions to internet loyalty plans, converting dumb CPE into multifunction gateways. Yet, Utilities and ESCOs exhibit the fastest 23.1% CAGR as grid operators reward customers for flexible loads available through connected thermostats and smart water heaters. Some electric retailers even rebrand their user apps as “home energy services,” blurring lines between kWh billing and lifestyle automation.
Security-dealer channels remained resilient because UL-certified monitoring satisfies insurer stipulations, while retail/e-commerce outlets catered to bargain hunters with self-install kits. Installation service providers such as HelloTech were acquired by platform vendors—Door’s 2024 deal being a prime example—to secure end-to-end control of the customer journey. This consolidation trend should continue as fragmented last-mile support remains a pain point for the smart home as a service market.
Geography Analysis
North America captured 42.20% of global revenue in 2025 thanks to widespread broadband, entrenched security monitoring firms, and state-level incentives for demand-response. California’s time-of-use tariffs motivated homeowners to outsource energy orchestration to subscription platforms, while insurers across several states cut premiums for verified smart-alarm setups. Telcos leveraged triple-play bundles to lock in customers, and retailers like Target addressed lingering setup barriers with in-home “Easy Install” services powered by HelloTech.
Asia-Pacific recorded the highest regional CAGR of 17.7% heading to 2031 as urbanization, smart-city pilots, and surging mobile penetration fostered the appetite for app-first connected living. Advanced markets—Japan, South Korea, Singapore—mirrored North American adoption curves, but China and India supplied the bulk of incremental unit volume owing to expanding middle-class segments. The voice-first paradigm resonated strongly among smartphone-centric consumers, bypassing legacy hub requirements and amplifying addressable scale.
Europe maintained steady momentum with roughly 19% household penetration in leading economies, yet more than half of broadband homes had little smart-home familiarity, indicating substantial headroom. Strict GDPR frameworks heightened data-privacy due diligence, favoring suppliers that can demonstrate on-device processing and transparent consent flows. Utility decarbonization mandates further catalyze energy-management subscriptions. The region has forecast turnover of EUR 13.3 billion from connected homes, translating to USD 15 billion at average 2024 exchange rates, underscoring its weight in the global smart home as a service market.


Competitive Landscape
The smart home as a service market remains fragmented, with no vendor exceeding a low-double-digit share. Telcos such as Comcast, telco-security hybrids like ADT, and device-centric giants including Samsung vie alongside start-ups focused on AI orchestration. Installation and support are especially atomized; independent technicians from HelloTech, Handy, and Best Buy’s Geek Squad collectively handled a large slice of field calls. Door’s 2024 acquisition of HelloTech crystallized a vertical-integration play that shields product performance by controlling last-mile service.
Incumbents increasingly differentiate via ecosystem breadth and AI depth rather than hardware alone. Samsung SmartThings leveraged its ENERGY STAR credential to win energy-savings-focused households, while Google’s Matter push aimed to dissolve compatibility anxiety. Utilities formed joint ventures with cloud analytics firms to sell value-added load-flexibility packages that overlap traditional security bundles, creating cross-industry collision zones. Given these dynamics, the market favors agile players capable of seamless firmware pipelines, strategic partnerships, and subscription-friendly financing models that lower entry friction.
Strategic announcements underscored the pivot toward multi-service hubs. ZTE’s Wi-Fi 7 media centres introduced in March 2025 fused 4K entertainment, mesh routing, and smart-home control in one SKU.[4]ZTE Corporation Press Office, “ZTE Unveils AI-Powered Home Network Solutions,” zte.com.cn Brilliant NextGen, born from its 2024 acquisition, targeted builders who want unified lighting, HVAC, and access panels out-of-the-box. Competitive pressure is therefore shifting toward long-term service innovation rather than near-term box shipments.
Smart Home As A Service Industry Leaders
ADT Inc.
Vivint Smart Home, Inc.
Comcast Corporation (Xfinity Home)
Alarm.com Holdings, Inc.
Control4 Corp. (Snap One)
- *Disclaimer: Major Players sorted in no particular order

Recent Industry Developments
- March 2025: ZTE Corporation unveiled AI-powered home network solutions at MWC Barcelona 2025, featuring a 4K AI Soundbar, media center, and Wi-Fi 7 devices.
- November 2024: The Connectivity Standards Alliance issued Matter 1.4, extending device classes and offline resilience.
- August 2024: Brilliant was acquired by Almeida Strategic Investments and Cullinan Holdings, forming Brilliant NextGen, Inc. to scale smart-home solutions for builders.
- June 2024: Door (formerly Latch) completed its acquisition of HelloTech to launch Door Services for multi-unit residences.


Research Methodology Framework and Report Scope
Market Definitions and Key Coverage
Mordor Intelligence defines the Smart Home as a Service (SHaaS) market as subscription-based bundles that cover the remote management, maintenance, and periodic upgrade of connected home devices and platforms across security, energy, comfort, and entertainment functions. Revenue is booked at the service contract level rather than at the one-time sale of hardware.
Scope Exclusion: Stand-alone device retail sales and single-visit installation services that do not include an ongoing subscription are excluded.
Segmentation Overview
- By Service Type
- Managed Services
- Integrated Services
- DIY / Self-Install Services
- By Solution
- Security and Surveillance
- Lighting and Window Control
- Energy and Utility Management
- Entertainment and Connectivity
- Whole-Home Automation Suites
- By Component
- Hardware
- Software / Platforms
- Professional and Managed Services
- By End-User
- Single-Family Residential
- Multi-Family / MDU
- Hospitality and Short-Stay Rental
- Small Commercial and Office
- By Sales Channel
- Telco / Cable MSO Bundles
- Security Service Providers
- Utilities and ESCOs
- Retail / E-commerce
- By Geography
- North America
- United States
- Canada
- Mexico
- South America
- Brazil
- Argentina
- Rest of South America
- Europe
- Germany
- United Kingdom
- France
- Italy
- Spain
- Russia
- Rest of Europe
- Asia-Pacific
- China
- Japan
- India
- South Korea
- South-East Asia
- Rest of Asia-Pacific
- Middle East and Africa
- Middle East
- Saudi Arabia
- United Arab Emirates
- Turkey
- Rest of Middle East
- Africa
- South Africa
- Nigeria
- Rest of Africa
- Middle East
- North America
Detailed Research Methodology and Data Validation
Primary Research
We complemented desk work through semi-structured interviews with SHaaS platform operators, telco bundling managers, security installers, and utility demand-response teams across North America, Europe, and Asia-Pacific. These conversations validated device attachment rates, churn levels, and subscription ARPU assumptions that were only partially visible in public filings.
Desk Research
Our analysts harvested macro and micro cues from freely available, reputable sources such as the US Energy Information Administration for residential energy spend trends, the Federal Communications Commission for broadband penetration, Eurostat's dwelling stock, the Consumer Technology Association's smart device adoption surveys, and patent analytics from Questel that signal technology shifts. Financial disclosures, investor presentations, and trade association papers (e.g., Continental Automated Buildings Association) further framed competitive moves and pricing practices. This list is illustrative; many additional open datasets and news archives inside Dow Jones Factiva were reviewed to cross-check numbers and narratives.
Market-Sizing & Forecasting
A top-down build started with 2024 occupied dwelling counts by region and broadband households, then applied weighted penetration of multi-device smart homes to arrive at the addressable service pool. Results were corroborated through sampled bottom-up roll-ups of leading providers' subscriber bases and telco bundle disclosures. Key variables feeding the model include average connected-device count per household, service attach rate per device cluster, monthly ARPU progression, security incident rates that lift adoption, and regional electricity tariffs that spur energy-management bundles. A multivariate regression, stress-tested through scenario analysis, produced the 2025-2030 trajectory, while gaps in smaller geographies were bridged with proxy indicators such as smart speaker shipments and mobile data plan upgrades.
Data Validation & Update Cycle
Before sign-off, we run divergence checks versus independent indicators, escalate anomalies for peer review, and re-engage sources when swings exceed preset thresholds. Mordor updates the model annually and issues interim refreshes after material events like major telco-platform launches, ensuring clients always receive the freshest view.
Why Mordor's Smart Home As A Service Baseline Warrants Trust
Published estimates often diverge because firms track different revenue streams, convert currencies on varied dates, or freeze models for longer intervals.
Key gap drivers include some studies that fold in stand-alone installation fees, others that stop at managed security contracts, and a few that assume uniform ARPU growth that our interviews found unrealistic. In addition, Mordor's six-month refresh cadence captures rapid tariff and bundle changes, while several publishers revise only every two to three years.
Benchmark comparison
| Market Size | Anonymized source | Primary gap driver |
|---|---|---|
| USD 13.22 B | Mordor Intelligence | - |
| USD 14.20 B | Regional Consultancy A | Includes one-off installation revenue and smart appliance extended warranties |
| USD 7.98 B | Industry Association B | Counts security monitoring contracts only; omits energy and entertainment bundles |
In sum, our disciplined scoping, live primary validations, and frequent model refreshes yield a balanced, transparent baseline that decision-makers can trace back to clear variables and repeatable steps.


Key Questions Answered in the Report
What is the current smart home as a service market size?
The market generated USD 15.25 billion in 2026 and is forecast to reach USD 31.09 billion by 2031 on a 15.33% CAGR path.
Which region dominates the smart home as a service market?
North America led with a 42.20% share in 2025 due to mature broadband networks, insurer discounts for monitored homes, and active demand-response programs.
Which segment is growing fastest within the smart home as a service industry?
Energy and Utility Management solutions are expanding at a 22.4% CAGR as utilities reward flexible loads and homeowners seek relief from rising power prices.
Why are telcos important players in the smart home as a service market?
Telecom providers bundle automation features with broadband and mobile plans, leveraging existing field crews and customer relationships to upsell subscription services.
How is Matter improving smart home adoption?
Matter 1.4 strengthened device interoperability and offline resilience, enabling consumers to mix brands without compatibility fears, which directly supports service-based recurring revenue models.
What keeps some consumers from adopting smart home subscriptions?
Key barriers include privacy concerns around continuous data collection and the high up-front cost of devices and professional installation, especially in developing markets.
Page last updated on:


