Smart Farm Market Size and Share
Market Overview
| Study Period | 2020 - 2031 |
|---|---|
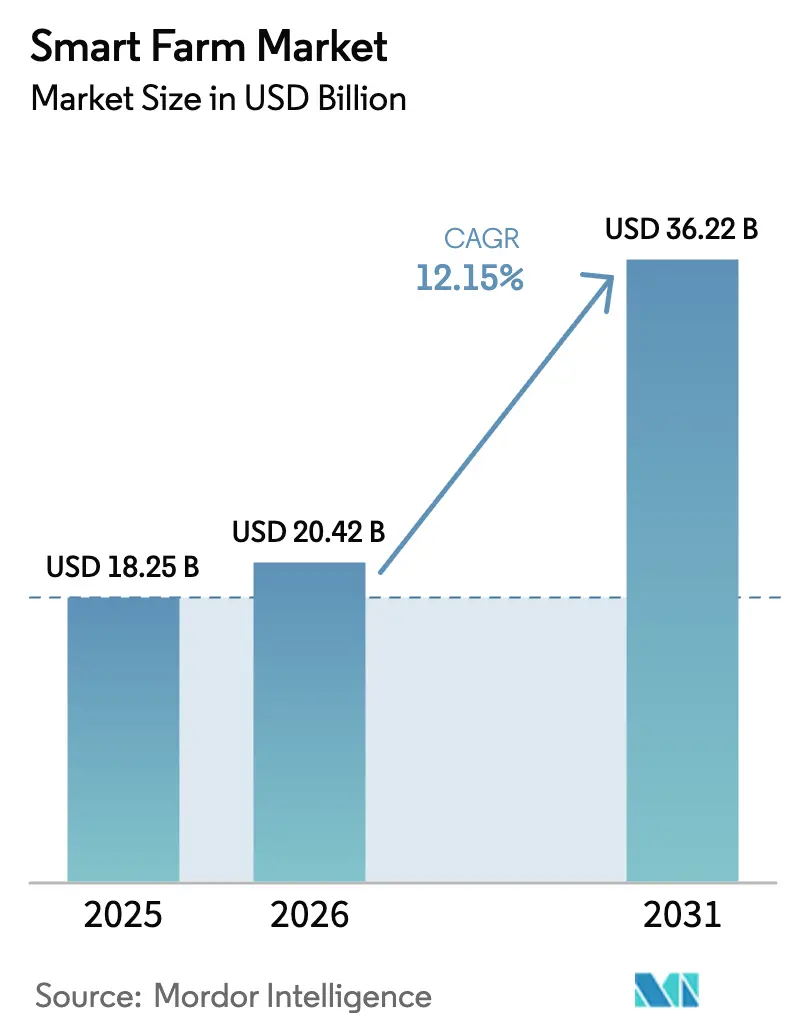
| Market Size (2026) | USD 20.42 Billion |
| Market Size (2031) | USD 36.22 Billion |
| Growth Rate (2026 - 2031) | 12.15% CAGR |
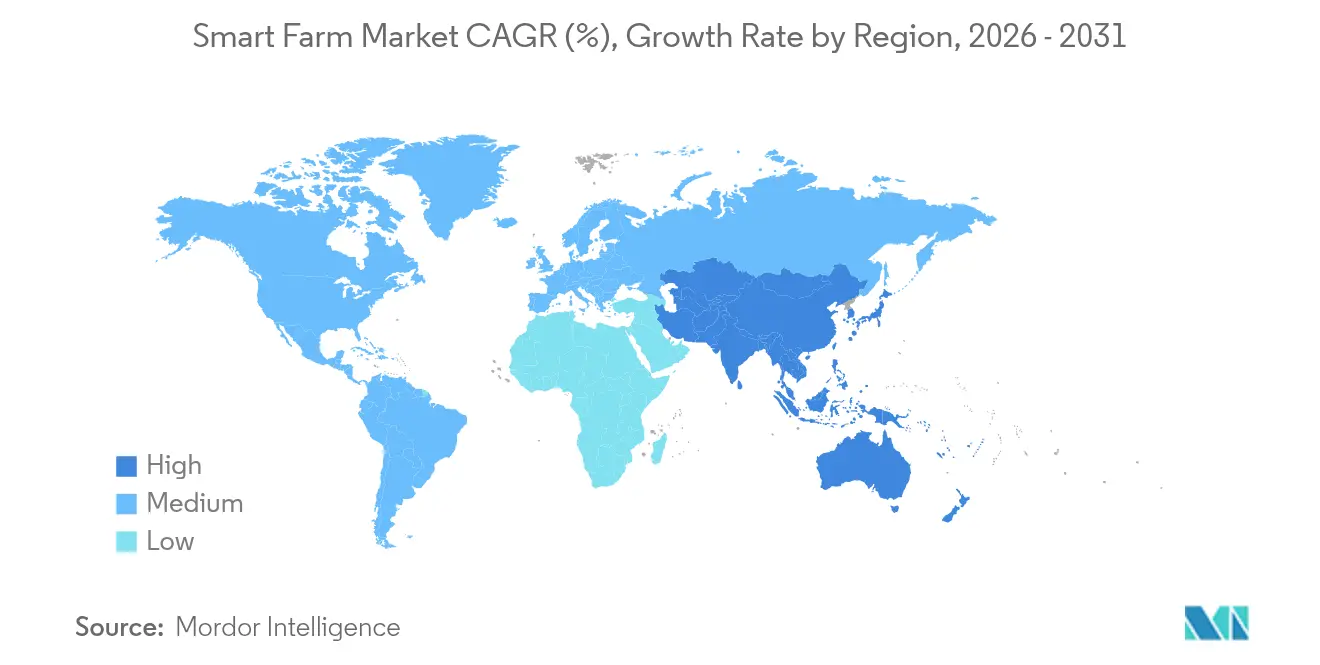
| Fastest Growing Market | Asia Pacific |
| Largest Market | North America |
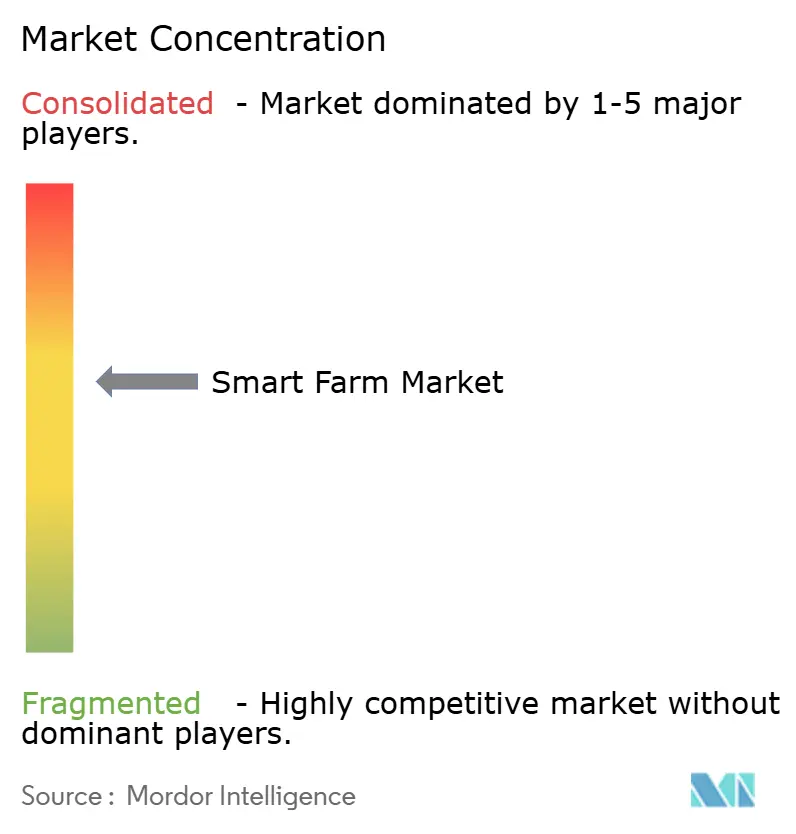
| Market Concentration | Medium |
Major Players *Disclaimer: Major Players sorted in no particular order Image © Mordor Intelligence. Reuse requires attribution under CC BY 4.0. | |
Smart Farm Market Analysis by Mordor Intelligence
The smart farm market size was valued at USD 18.25 billion in 2025 and estimated to grow from USD 20.42 billion in 2026 to reach USD 36.22 billion by 2031, at a CAGR of 12.15% during the forecast period (2026-2031). Hardware accounted for 51.8% revenue in 2024, yet demand is tilting toward service-based, outcome-driven models as growers seek guaranteed yield and sustainability gains. Precision farming applications led with a 41.6% slice of the smart farm market, but smart greenhouse solutions are pacing the field at a 17.3% CAGR thanks to urban agriculture and controlled-environment systems. Satellite IoT’s 29.4% forecast CAGR is set to disrupt cellular connectivity’s 46.7% 2024 lead, extending digital tools to previously unserved rural acres. Asia-Pacific is expanding at 14.8% annually, narrowing North America’s 34.5% hold as governments fund digitalization to shore up food security.[1]U.S. Department of Agriculture, “Partnerships for Climate-Smart Commodities,” usda.gov
Key Report Takeaways
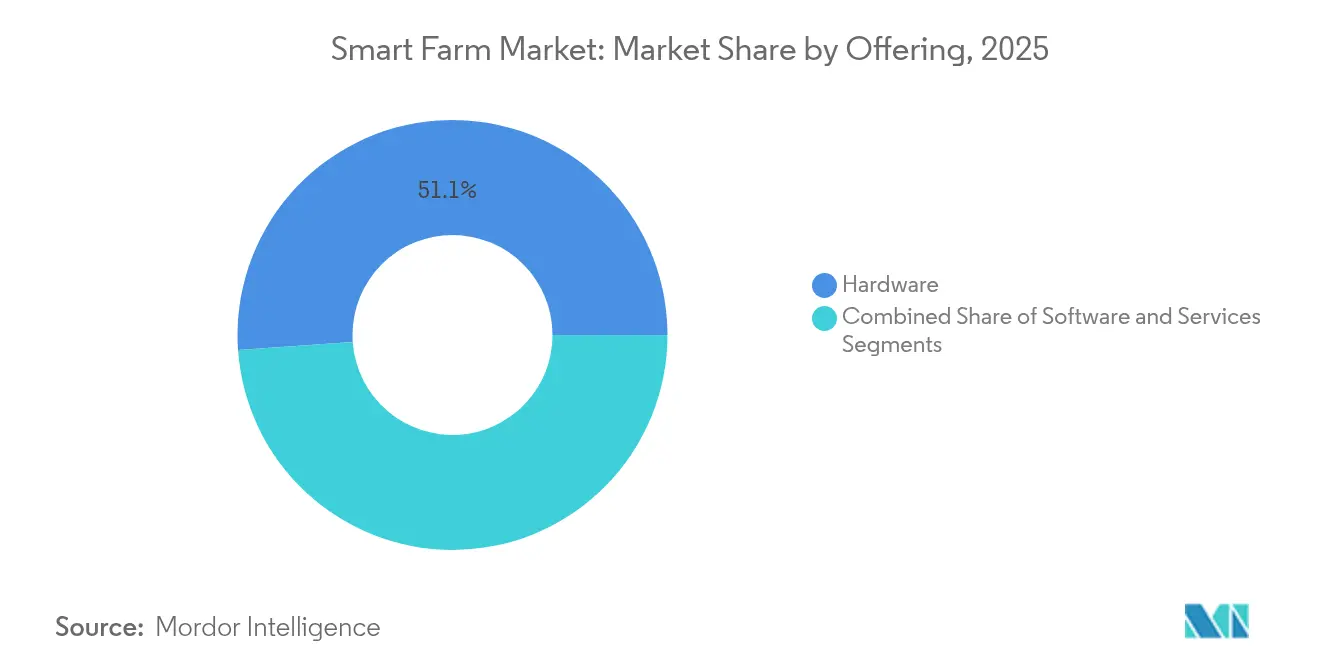
- By offering, hardware led with 51.12% of the smart farm market share in 2025, services are projected to post the fastest 14.21% CAGR through 2031.
- By application, precision farming held 41.05% of the smart farm market size in 2025, whereas smart greenhouse solutions are advancing at 16.45% CAGR to 2031.
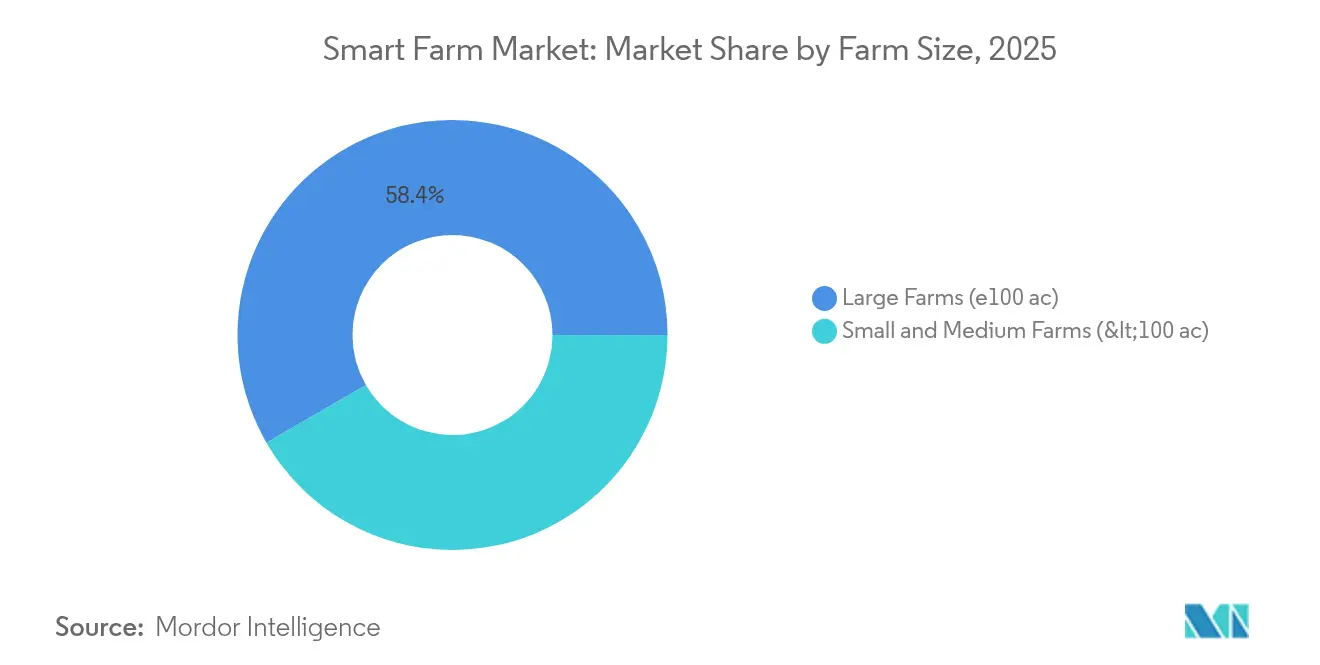
- By farm size, operations over 100 acres controlled 58.35% of the smart farm market share in 2025, while small and medium farms are set to grow at a 12.78% CAGR.
- By connectivity, cellular IoT commanded 46.15% of 2025 revenue, yet satellite IoT is forecast to expand at 28.10% CAGR.
- Regionally, North America accounted for 34.15% revenue in 2025; Asia-Pacific registers the fastest 14.25% CAGR.
Note: Market size and forecast figures in this report are generated using Mordor Intelligence’s proprietary estimation framework, updated with the latest available data and insights as of 2026.
Global Smart Farm Market Trends and Insights
Drivers Impact Analysis*
| Driver | (~) % Impact on CAGR Forecast | Geographic Relevance | Impact Timeline |
|---|---|---|---|
| Rapid adoption of IoT- and AI-enabled farm equipment | +3.2% | Global, with North America and Europe leading | Medium term (2-4 years) |
| Expanding government subsidy pools for farm digitalization | +2.8% | Global, strongest in APAC and North America | Short term (≤ 2 years) |
| Acute ag-labour shortages are accelerating automation demand | +2.1% | North America and Europe primarily | Short term (≤ 2 years) |
| Rising demand for traceable and data-rich produce supply chains | +1.9% | Global, with premium markets in developed regions | Medium term (2-4 years) |
| LEO-satellite connectivity unlocking rural broadband coverage | +1.7% | Global, critical for remote agricultural regions | Long term (≥ 4 years) |
| Carbon-credit monetization linked to high-resolution field data | +1.5% | North America and Europe, expanding to APAC | Long term (≥ 4 years) |
| Source: Mordor Intelligence | |||
Rapid adoption of IoT- and AI-enabled farm equipment
John Deere’s autonomous tractor—equipped with 16 cameras and LiDAR—demonstrated continuous, human-free operation across 500 acres per day, proving that predictive algorithms can raise yields 15-20% and cut inputs 25-30%. AGCO’s USD 2 billion PTx Trimble joint venture underlined how established machinery makers are pivoting toward data-centric offerings that deliver field-level insights. Kubota’s CES-award-winning KATR robot illustrated the move toward multi-function autonomy capable of hauling 530 pounds while executing diverse tasks. Combined with high-resolution satellite imagery, these platforms shift growers from reactive to predictive operations, aligning production with sustainability mandates.
Expanding government subsidy pools for farm digitalization
The USDA earmarked USD 3.1 billion for climate-smart commodities, covering 141 projects that subsidize remote-sensing and variable-rate technologies on smaller holdings. California’s workforce program funded sustainability training with USD 499,500 to mitigate labour gaps. In Australia, a USD 10 million Digital Agriculture scheme backed 372 projects, with 99% of participants reporting measurable benefits. Such incentives de-risk adoption and compress payback periods, propelling the smart farm market across farm sizes.
Acute ag-labour shortages are accelerating automation demand
North America logged 70,000 vacant farm roles in 2024, compelling investment in robotics and autonomous systems. Carbon Robotics secured USD 70 million for its Laser Weeder that removes weeds via AI-guided lasers, sidestepping chemical herbicides. Monarch Tractor’s USD 133 million round advanced autonomous electric tractors capable of 24/7 duty cycles. University programs such as Mississippi State’s Agricultural Autonomy Institute are training operators to manage fleets of robotic assets, cementing automation as an enduring fixture rather than a stopgap.
Rising demand for traceable and data-rich produce supply chains
Trimble’s Connected Climate Exchange began linking farm-level emissions data with corporate buyers seeking verified sustainability claims, opening new revenue via carbon credits. The USDA’s 2025 interim rule created a uniform method for reporting greenhouse-gas profiles of biofuel feedstocks, baking data transparency into future market access. Retailers now require end-to-end provenance—covering water, pesticide, and carbon metrics—driving blockchain adoption and aligning premiums with demonstrable stewardship.
Restraints Impact Analysis*
| Restraint | (~) % Impact on CAGR Forecast | Geographic Relevance | Impact Timeline |
|---|---|---|---|
| High upfront capex and uncertain ROI for smallholders | -2.3% | Global, most severe in developing regions | Short term (≤ 2 years) |
| Data-privacy / ownership concerns among growers | -1.8% | North America and Europe primarily | Medium term (2-4 years) |
| Fragmented agro-telecom spectrum regulation | -1.2% | Global, varies by regulatory framework | Long term (≥ 4 years) |
| Siloed vendor ecosystems lacking interoperability standards | -1.1% | Global, affects all technology segments | Medium term (2-4 years) |
| Source: Mordor Intelligence | |||
High upfront capex and uncertain ROI for smallholders
A German study showed that only farms earning above EUR 100,000 (USD 113,000) achieved positive net present values from precision tools, whereas smaller operations struggled with cost justification despite clear efficiency gains. Beyond equipment, recurring software fees can absorb 15–20% of annual budgets. Even Taylor Farms pursued grant aid for a USD 15 million sensor network to validate water savings and yield gains. Weather variability and volatile crop prices further stretch payback timelines, widening the tech gap between large and small growers.
Data-privacy / ownership concerns among growers
Research found 55% of farmers worried about the misuse of agronomic data, stalling full-stack adoption. Many platform terms allow broad provider access to soil, yield, and financial data, potentially eroding competitive advantage. Farmonaut responded with end-to-end encryption and user-controlled sharing, yet a universal privacy framework remains absent. Emerging GDPR-style rules add compliance costs for vendors, especially startups, slowing innovation and uptake.
*Our forecasts treat driver/restraint impacts as directional, not additive. The impact forecasts reflect baseline growth, mix effects, and variable interactions.
Segment Analysis
By Offering: Hardware dominance meets services disruption
Hardware held 51.12% of 2025 revenue, securing the single largest slice of the smart farm market share through tangible assets with residual value. Software formed the analytical bridge, while services advanced briskly at 14.21% CAGR. The smart farm market size for services is expected to accelerate alongside outcome-based contracts that guarantee yield uplift or emission reduction. Farmers gravitated to retrofitted sensor suites that breathe new life into existing machinery, lowering capex while keeping fleets current.
A parallel pivot unfolded as suppliers bundled data interpretation, remote equipment tuning, and compliance reporting into subscription packages. AGCO forecast precision agriculture revenue to climb from USD 850 million in 2024 to USD 2 billion by 2029 as its PTx platform expands professional services. This re-orientation suggests hardware sales will plateau while service revenue compounds, changing competitive calculus for manufacturers and pure-play software firms alike.


By Application: Precision leadership meets greenhouse momentum
Precision farming controlled 41.05% of 2025 revenue, but smart greenhouses are poised for a 16.45% CAGR that could redraw rankings by 2031. The smart farm market size for smart greenhouse solutions is projected to escalate as megacities pursue year-round, climate-proof food systems. Meanwhile, the livestock monitoring niche benefits from continuous health data that curbs antibiotics usage and raises feed efficiency.
Smart greenhouse investments in the United States were expected to rise from USD 360.92 million in 2023 to USD 606.37 million by 2029, mirroring urban demand and climatic volatility. In open fields, drones and multispectral imaging refine variable-rate inputs, improving margins under tight commodity prices. Field-mapping suites merge ground sensors with satellite data to flag stress zones days before visual symptoms appear, while labour-management apps allocate scarce workers to the highest-value tasks.
By Farm Size: Large operations lead, while small farms accelerate
Operations above 100 acres delivered 58.35% of 2025 sales, leveraging scale for full-stack deployments. Yet small and medium farms are growing at 12.78% annually, underpinned by declining sensor costs and targeted subsidy schemes. The smart farm market size attributed to smallholders is expanding as co-operatives share capital and technical staff.
The USDA earmarked dedicated funds for underserved producers, lowering entry barriers to soil probes, imagery subscriptions, and autonomous sprayers. Large enterprises continued system-wide integrations—combining variable-rate irrigation, autonomous tractors, and carbon-monitoring tools—to lock in cost advantages. Vendors followed suit with modular offerings that let smaller farms add functionality incrementally, democratizing advanced agronomy.
By Connectivity Technology: Cellular dominance challenged by satellite revolution
Cellular IoT held 46.15% of 2025 revenue, thanks to mature networks and low latency. Satellite IoT, however, is set to post a 28.10% CAGR, highlighting unmet connectivity in remote regions. The smart farm market size tied to satellite connectivity will expand as low-earth-orbit constellations drop bandwidth costs.
CNH Industrial’s tie-up with Starlink enabled real-time telemetry in regions lacking terrestrial broadband. LPWAN tools such as LoRa excel where power efficiency trumps throughput, servicing soil sensors that transmit hourly. Short-range links like Wi-Fi and Bluetooth sync tractor implements, ensuring centimetre-level row accuracy. Hybrid modules from Giesecke + Devrient now auto-switch between cellular and satellite, shielding operations from network outages.
Geography Analysis
North America’s 34.15% share in 2025 reflected early adoption, robust subsidy pipelines, and top-tier OEM ecosystems. Canadian producers expanded smart irrigation to balance water quotas, while Mexican growers installed traceability tags to secure export contracts. Public-private pilots under the USDA climate-smart initiative pulled small operators into digital platforms, enlarging the regional smart farm market.
Europe accelerated adoption under Green Deal rules that tie subsidy eligibility to emission cuts. German research indicated farms above EUR 100,000 revenue met ROI hurdles, pushing suppliers to devise leasing and service models for smaller holdings. France led drone-enabled crop diagnostics, and the United Kingdom incubated carbon accounting startups to monetize regenerative practices. Eastern Europe modernized its fleets to compete within the common market, driving demand for retrofit guidance kits.
Asia-Pacific logged a 14.25% CAGR, becoming the fastest-growing smart farm market. China up-scaled drone spraying and AI crop analytics for staple grains. India rolled out low-cost sensor bundles through state-run cooperatives, addressing 86% of smallholder domination. Japan’s robotics solved acute labour gaps, while Australia’s vast stations relied on satellite IoT for livestock tracking across millions of hectares. Southeast Asia invested in controlled-environment facilities to ensure year-round fruit exports, further bolstering regional momentum.

Competitive Landscape
The arena displayed moderate consolidation. John Deere, AGCO, and CNH Industrial layered data services atop machinery portfolios, pursuing vertical integration to lock in lifecycle revenue. AGCO’s PTx dealership expansion to 50 additional outlets across the U.S. and Canada aimed to mainstream guidance tech by end-2025.[4]Agriculture.com, “AGCO Adds 50 PTx Locations,” agriculture.com CNH Industrial’s Starlink deal solved connectivity pain points that once limited autonomous deployments.
Specialists carved niches: Carbon Robotics targeted weed elimination, Trimble enabled carbon credit marketplaces, and Gevo bought CultivateAI to deepen emissions auditing. Interoperability gaps remained, leaving openings for middleware firms that harmonize multi-vendor ecosystems. Patent filings centered on AI vision, path planning, and multisensor fusion suggest continued R&D intensity aimed at labour automation and resource precision.
Smart Farm Industry Leaders
Deere & Company
Trimble Inc.
AGCO Corporation
DJI Technology Co.
CNH Industrial
- *Disclaimer: Major Players sorted in no particular order

Recent Industry Developments
- May 2025: AGCO expanded its PTx dealership network to 50+ additional North American outlets to speed precision guidance adoption.
- May 2025: CNH Industrial partnered with Starlink to deliver broadband for autonomous equipment in underserved zones.
- April 2025: PTx Trimble launched the NAV-960 guidance controller with centimetre-level GNSS accuracy.
- January 2025: Kubota unveiled the KATR robot, Smart Autonomous Sprayer, and Agri Concept 2.0 electric tractor at CES 2025.


Research Methodology Framework and Report Scope
Market Definitions and Key Coverage
Our study defines the smart farm market as all global revenues derived from connected hardware, purpose-built software, and data-enabled services that allow growers to monitor, analyze, and direct crops, livestock, and greenhouse assets through digital networks and autonomous equipment. According to Mordor Intelligence, the model captures sales made by manufacturers, platform vendors, and integrators across open-field, indoor, and mixed-production systems.
Scope Exclusion: Conventional farm machinery or services that do not transmit, store, or act on digital data are outside the study scope.
Segmentation Overview
- By Offering
- Hardware
- Software
- Services
- By Application
- Precision Farming
- Livestock Monitoring
- Smart Greenhouse
- Field Mapping
- Farm Labour Management
- Others
- By Farm Size
- Small and Medium Farms (<100 ac)
- Large Farms (≥100 ac)
- By Connectivity Technology
- Cellular IoT (3G/4G/5G)
- LPWAN (LoRa, Sigfox)
- Satellite IoT
- Short-Range (Bluetooth, Zigbee, Wi-Fi)
- By Geography
- North America
- United States
- Canada
- Mexico
- Europe
- Germany
- France
- United Kingdom
- Italy
- Spain
- Rest of Europe
- Asia-Pacific
- China
- India
- Japan
- South Korea
- Southeast Asia
- Australia and New Zealand
- Rest of Asia-Pacific
- South America
- Brazil
- Argentina
- Rest of South America
- Middle East and Africa
- Middle East
- Saudi Arabia
- UAE
- Turkey
- Rest of Middle East
- Africa
- South Africa
- Nigeria
- Kenya
- Rest of Africa
- Middle East
- North America
Detailed Research Methodology and Data Validation
Primary Research
Multiple interviews and structured surveys were conducted with agronomists, input dealers, farm-management platform providers, and regional ag-extension officers in North America, Europe, Asia-Pacific, and Latin America. Their insights validated sensor penetration rates, typical service fee structures, and expected yield-improvement paybacks, which were crucial for calibrating adoption curves and cost assumptions.
Desk Research
Mordor analysts first mapped the universe of smart-farm technologies by reviewing tier-one public sources such as FAO statistical yearbooks, USDA ERS IoT adoption surveys, Eurostat agri-tech datasets, and World Bank rural broadband indicators. Trade associations, including the Association for Uncrewed Vehicle Systems and the International Dairy Federation, offered equipment shipment and herd-health benchmarks that grounded device and livestock monitoring cuts. We then mined company 10-Ks, investor decks, and certified customs data for pricing cues, while proprietary feeds from D&B Hoovers and Dow Jones Factiva provided cross-checks on vendor revenue mixes. The sources cited above illustrate the breadth consulted; many additional references informed category splits, price bands, and regional shares.
Market-Sizing & Forecasting
We applied a blended top-down and bottom-up framework. A top-down revenue pool was reconstructed from national agricultural output values, smart-equipment import-export records, and farm-area penetration ratios; these totals were then pressure-tested via selective bottom-up roll-ups of supplier shipments and sampled average selling prices. Key variables in the model include arable land under digital monitoring, average smart-sensor spend per hectare, cellular-IoT coverage, fertilizer price trends, and regional capital-expenditure credit flows. Forecasts to 2030 were produced with multivariate regression that links the above factors, after which scenario analysis adjusted for weather volatility and subsidy shifts. Data gaps in device volumes were bridged by proportional allocation using published precision-farming acreage and verified with channel checks.
Data Validation & Update Cycle
Outputs undergo variance scans against parallel datasets, followed by a two-step peer review within the analyst team before sign-off. Reports refresh yearly, and mid-cycle updates are triggered when policy changes, macro-shocks, or material mergers alter baseline drivers. A final pre-delivery sweep ensures clients receive the most current view.
Why Mordor's Smart Farm Baseline Earns Decision-Makers' Trust
Published estimates often diverge because each firm selects unique scopes, pricing ladders, and refresh cadences.
Key gap drivers include differing inclusion of subscription software, variance in hardware average selling prices, alternative adoption-rate assumptions in emerging regions, and currency conversions that lag actual exchange movements. Mordor's page sets 2025 as the base year, tracks only digitally connected products, and updates exchange rates quarterly, which explains the contrast with external figures shown below.
Benchmark comparison
| Market Size | Anonymized source | Primary gap driver |
|---|---|---|
| USD 18.25 B (2025) | Mordor Intelligence | - |
| USD 20.25 B (2025) | Regional Consultancy A | Includes precision forestry and aquaculture devices not in Mordor scope |
| USD 15.70 B (2025) | Global Consultancy B | Applies conservative ASPs and omits cloud-service revenues |
| USD 28.51 B (2025) | Industry Journal C | Uses installed-base replacement value rather than annual sales |
The comparison shows that once scope alignment, price realism, and update cadence are harmonized, Mordor's disciplined approach offers a balanced, transparent baseline that investors and policymakers can replicate and trust.


Key Questions Answered in the Report
What is driving the rapid growth of the smart farm market through 2031?
Accelerated adoption of IoT- and AI-enabled machinery, generous government subsidies, and urgent labour shortages are pushing the market to a 12.15% CAGR.
Which segment is growing fastest within the smart farm market?
Smart greenhouse applications are projected to lead with a 16.45% CAGR as cities invest in controlled-environment agriculture to secure local food supply.
How are small farms overcoming the high upfront costs of smart farming technologies?
Targeted subsidy programs, modular retrofit kits, and cooperative purchasing models are lowering capex and shortening payback periods for smallholders.
Why is satellite IoT gaining ground over cellular connectivity on farms?
Low-earth-orbit constellations extend broadband to remote fields where cellular coverage is patchy, enabling real-time data flow for autonomous equipment.
What role do data privacy concerns play in smart farm technology adoption?
Roughly 55% of growers cite data-ownership issues, prompting vendors to enhance encryption and user-controlled sharing to build trust and boost uptake.
Which region is expected to contribute the most to future smart farm market growth?
Asia-Pacific, expanding at 14.25% annually, is poised to add the largest incremental revenue thanks to large-scale modernization initiatives and food-security priorities.
Page last updated on:


