
Hearing Aids Market Size and Share
Market Overview
| Study Period | 2020 - 2031 |
|---|---|
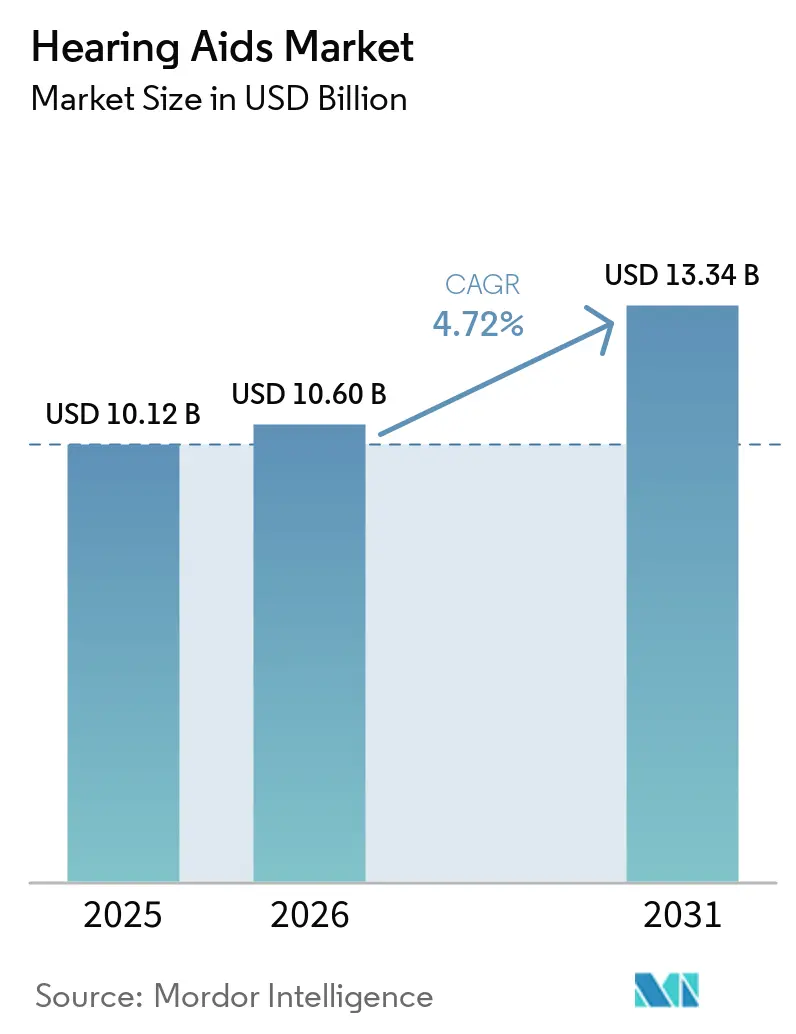
| Market Size (2026) | USD 10.60 Billion |
| Market Size (2031) | USD 13.34 Billion |
| Growth Rate (2026 - 2031) | 4.72 % |
| Fastest Growing Market | Asia Pacific |
| Largest Market | North America |
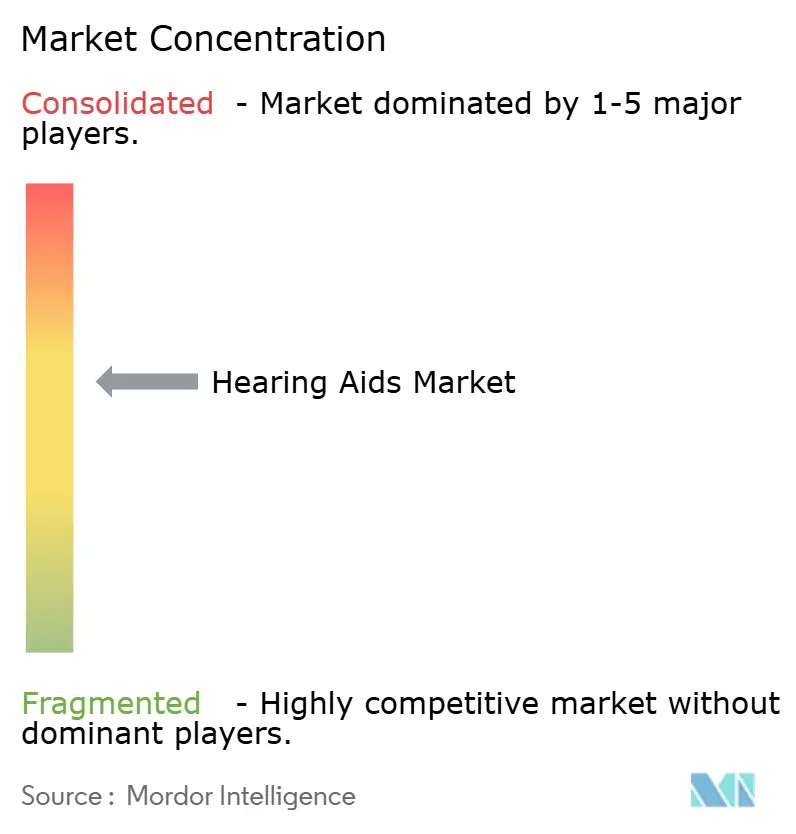
| Market Concentration | Medium |
Major Players *Disclaimer: Major Players sorted in no particular order Image © Mordor Intelligence. Reuse requires attribution under CC BY 4.0. | |
Hearing Aids Market Analysis by Mordor Intelligence
The hearing aids market size is expected to grow from USD 10.12 billion in 2025 to USD 10.6 billion in 2026 and is forecast to reach USD 13.34 billion by 2031 at 4.72% CAGR over 2026-2031. Direct-to-consumer access, artificial intelligence sound-processing advances, and the entry of consumer-electronics brands are together redrawing competitive rules. Premium manufacturers now position rechargeable, AI-enabled models as wellness wearables that integrate with smartphones and health platforms, a strategy that both supports higher average selling prices and broadens appeal to tech-savvy users. Meanwhile, U.S. OTC legalization compresses traditional audiology margins yet expands the addressable base among consumers with mild-to-moderate loss. Demographic pressure from longer life expectancy and rising noise exposure sustains a steady replacement cycle and opens opportunities for subscription and service-based revenue models.
Key Report Takeaways
- By product type, Behind-the-Ear solutions led with 44.88% of hearing aids market share in 2025, while Receiver-in-Canal devices are poised for the fastest 6.98% CAGR through 2031.
- By technology, digital platforms held 85.10% of the hearing aids market size in 2025, and AI-enabled variants are advancing at 10.22% CAGR.
- By patient type, adults accounted for 73.10% of demand in 2025, whereas pediatric fittings are forecast to climb at 8.25% CAGR.
- By type of hearing loss, sensorineural held 85.20% revenue share in 2025, while mixed segment is forecast to grow at an 6.93% CAGR.
- By device design, disposable battery led with 54.10% of market share in 2025; rechargeable lithium-ion is advancing at a 9.68% CAGR to 2031.
- By distribution channel, prescription channels retained 64.95% share in 2025 but OTC retail is expanding at 8.88% CAGR.
- By geography, North America commanded 38.40% revenue in 2025 and Asia-Pacific is the fastest-growing geography at 7.86% CAGR.
Note: Market size and forecast figures in this report are generated using Mordor Intelligence’s proprietary estimation framework, updated with the latest available data and insights as of 2026.
Market Trends and Insights
Drivers Impact Analysis of Hearing Aids Market*
| Driver | (~) % Impact on CAGR Forecast | Geographic Relevance | Impact Timeline |
|---|---|---|---|
| Rising Burden Of Hearing Loss | +1.2% | Global, with concentration in aging populations | Long term (≥ 4 years) |
| Aging Population & Prolonged Life-Expectancy | +1.0% | North America, Europe, Japan | Long term (≥ 4 years) |
| Technological Advances (Digital, AI, Connectivity) | +0.8% | Global, led by developed markets | Medium term (2-4 years) |
| OTC Legalization & Broader Access | +0.6% | North America, with spillover to other regions | Short term (≤ 2 years) |
| Smart-Wearable Convergence: Health Monitoring Biosensors | +0.4% | North America, Europe, Asia-Pacific urban centers | Medium term (2-4 years) |
| Hearables Ecosystem Pull From Consumer-Audio Brands | +0.3% | Global, consumer electronics penetration markets | Short term (≤ 2 years) |
| Source: Mordor Intelligence | |||
Rising Burden of Hearing Loss
Global prevalence climbed to 430 million people in 2024 and is projected to touch 700 million by 2050, placing sustained upward pressure on demand. Urban noise exposure, ototoxic medication use and chronic diseases such as diabetes amplify lifetime risk, reinforcing the importance of preventive screening and early amplification. Governments now integrate hearing health into healthy-aging policy frameworks, enabling partial reimbursement and tax credits that foster device uptake. Manufacturers respond with value-tier digital models priced below USD 1,000 to reach first-time users in emerging markets. The strategy supports volume expansion without fully cannibalizing premium lines and therefore lifts overall revenue mix.
Aging Population and Prolonged Life Expectancy
Japan, Italy and Germany each report median ages above 45 years, and individuals are living longer with higher expectations for active social participation. Clinical data linking untreated loss to cognitive decline has sparked physician referrals and insurer interest in preventive amplification. Medicare Advantage plans in the United States now bundle hearing benefits in 97% of offerings, creating a reimbursement runway that underpins steady unit growth. Device makers counter longer life spans with more durable housings, moisture protection and software updates that keep older hardware compatible with new phones. These adaptations lengthen product life cycles yet entice upgrades through iterative AI firmware releases.
Technological Advances in Digital, AI and Connectivity
Phonak’s DEEPSONIC chip executes trillions of operations per second, improving speech-in-noise performance by 10 dB and cutting listening effort by 45%[1]Sonova, “Phonak elevates sound quality with real-time AI,” sonova.com. GN’s ReSound Vivia and Oticon Intent extend the arms race with on-device neural networks and multi-sensor fusion that infer user intent from head and body movement. Full Bluetooth LE Audio support plus Auracast broadcast reception makes hearing aids integral to public-venue sound systems, unlocking new use cases in theaters, airports and lecture halls. The result is stronger differentiation at the top end, higher attach rates for cloud-based fitting services and growing subscription revenue from remote firmware upgrades.
OTC Legalization and Broader Access
The United States finalized the OTC category in late 2023, triggering the launch of pharmacy and online devices priced between USD 200 and 1,500. Early entrants such as Eargo and Lexie now use cloud-audiometry apps for self-fitting, though return rates remain higher than in the prescription channel. Big-box retailers and pharmacy chains leverage national footprints to supply affordable starter devices while upselling batteries and accessories. Traditional brands hedge by partnering with mass retailers under white-label arrangements, preserving margin and service revenue through in-store kiosks and remote audiologist support. Regulations in Canada, Australia and parts of Europe are under review, suggesting spill-over liberalization that could add incremental units over the next two years.
Restraints Impact Analysis of Hearing Aids Market*
| Restraint | (~) % Impact on CAGR Forecast | Geographic Relevance | Impact Timeline |
|---|---|---|---|
| High Device Cost & Presence Of Cheaper Substitutes | -0.7% | Global, acute in emerging markets | Medium term (2-4 years) |
| Patchy Insurance / Reimbursement Coverage | -0.5% | Global, varying by healthcare system | Long term (≥ 4 years) |
| Social Stigma & Low Adoption In Emerging Markets | -0.3% | Emerging markets, rural areas | Long term (≥ 4 years) |
| Lithium-Ion Supply-Chain Volatility For Rechargeables | -0.2% | Global manufacturing, Asia-Pacific supply base | Short term (≤ 2 years) |
| Source: Mordor Intelligence | |||
High Device Cost and Cheaper Substitutes
Traditional prescription pairs retail between USD 2,400 and 6,150, a price band that leaves 85% of adults with hearing difficulty untreated. OTC and personal sound amplification products, including hearing amplifiers, offer lower-cost entry but often underperform in complex listening environments, leading to early abandonment and negative word-of-mouth. As smart earbuds such as Apple’s AirPods Pro 2 receive FDA clearance for hearing aid functionality at USD 250, pricing pressure cascades through mid-tier segments. Manufacturers mitigate erosion by bundling tele-audiology, extended warranties and software upgrades, reframing the sale as an ongoing service rather than a one-time purchase. Emerging market governments explore bulk tenders and local assembly incentives to curb import costs, but semiconductor and lithium-ion inputs limit deep discounts.
Patchy Insurance and Reimbursement Coverage
Original Medicare in the United States still excludes standard hearing aids, forcing many retirees toward private pay or Medicare Advantage, where benefit generosity varies by plan and county[2]Centers for Medicare & Medicaid Services, “Audiology Services,” cms.gov. European single-payer systems reimburse up to 100% of basic digital models, yet premium receivers often require co-pays that deter upgrades. In low- and middle-income countries, national health insurance either excludes hearing aids or limits reimbursement to children, shrinking adult penetration. Veterans Affairs bulk purchasing lowers prices but creates brand lock-in, complicating post-service refitting when veterans relocate outside the VA network. Fragmented funding dampens adoption among price-sensitive cohorts despite clear clinical benefit.
*Our forecasts treat driver/restraint impacts as directional, not additive. The impact forecasts reflect baseline growth, mix effects, and variable interactions.
Hearing Aids Market Segment Analysis
By Product Type:
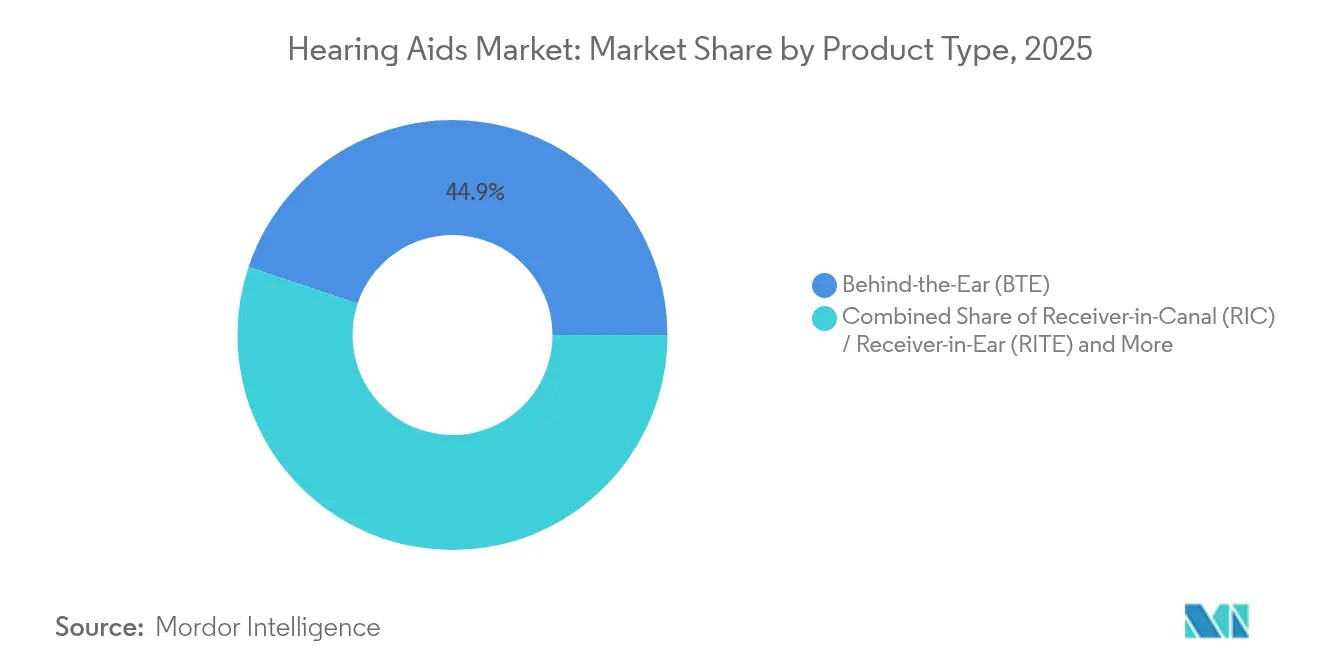
RIC Acceleration Challenges BTE LeadershipBehind-the-Ear models held 44.88% of hearing aids market share in 2025 because larger casings accommodate multi-core processors, telecoils and high-capacity batteries that extend daily runtime. The form factor also simplifies pediatric fittings due to replaceable ear hooks that adjust with growth. Receiver-in-Canal devices are set to log a 6.98% CAGR through 2031, propelled by slimmer profiles, Bluetooth streaming and color palettes that blend with hair and skin. Users favor the discreet look, while audiologists appreciate easier receiver replacement during maintenance. The hearing aids market sees complementary momentum in In-the-Ear and Completely-in-Canal segments among consumers seeking invisible solutions, though acoustic feedback control remains a design challenge in tiny shells. Cochlear and bone-anchored implants together target severe loss and are projected to reach USD 986.4 million by 2031, corresponding to 9.15% of hearing aids market size within surgical indications.
Innovation revolves around energy management and universal connectivity. Signia’s Pure Charge&Go BCT IX combines Bluetooth Classic and LE Audio to ensure compatibility with older smartphones while future-proofing for Auracast broadcasts. The model secures 36 hours of operation on a single charge and implements adaptive beamforming that prioritizes speech from the wearer’s focal direction. Competitive products integrate MEMS inertial sensors to trigger automatic program switches when users walk, drive or enter a crowded venue. These enhancements reinforce the transition from single-purpose amplifiers to multifunctional wearables, widening the addressable audience inside the hearing aids market.



By Technology:
AI Upshifts Digital DominanceDigital architecture already commands 85.10% of 2025 revenue, relegating analog circuits to niche, ultra-low-cost propositions. Layering artificial intelligence onto established DSP creates a premium stratum forecast to expand at a 10.22% CAGR, lifting the overall hearing aids market trajectory. Phonak’s Infinio platform integrates a neural accelerator that cuts latency to under 10 milliseconds and delivers 10 dB better speech-in-noise ratio. GN’s ReSound Vivia extends machine learning to wind noise prediction, while Oticon’s Intent uses head-motion sensors to infer listening intent. Cloud-connected apps push real-time language translation, fall detection and heart-rate trends to smartphones, positioning hearing aids as broader wellness nodes.
Analog offerings persist where reimbursement ceilings or consumer budgets limit digital upgrades, especially in some Latin American and African markets. However, declining microcontroller costs and open-source firmware ecosystems narrow the price delta, and many entry-level products now ship with basic AI noise suppression. As a result, the hearing aids market is likely to reach near-total digital saturation before the end of the decade. The spread of LE Audio further democratizes connectivity, allowing multi-stream sharing in classrooms and conference rooms without specialized infrastructure.
By Type of Hearing Loss:
Sensorineural Core With Mixed-Case UpsideSensorineural loss applications represented 85.20% of 2025 unit volume, reflecting widespread age-related and noise-induced cochlear damage across industrialized economies. Devices for conductive and mixed losses gain relevance as diagnostic imaging and tympanometry improve differential assessment, enabling audiologists to prescribe combined acoustic and bone-conduction solutions. Mixed loss fittings are projected to rise at 6.93% CAGR, benefiting from crossover products that merge air and bone pathways in a single shell. Research from Wake Forest University demonstrates micro-epidermal actuators that bypass obstructions, signalling future non-surgical options. Such breakthroughs could gradually migrate from clinical trials to commercial lines, expanding the hearing aids market size across complex pathologies.
Manufacturers diversify transducer arrays to address asymmetrical profiles, introducing programmable CROS and BiCROS modes that route sound from the poorer ear to the better cochlea without occlusion. Algorithmic advances now compensate for head shadow and localization deficits, improving spatial awareness for unilateral users. Pediatric protocols increasingly screen for auditory neuropathy and hidden hearing loss, giving rise to early bilateral fittings that prevent language development delays. These dynamics support a robust pipeline in accessories and software, from remote microphone companions to school-age classroom transmitters.
By Patient Type:
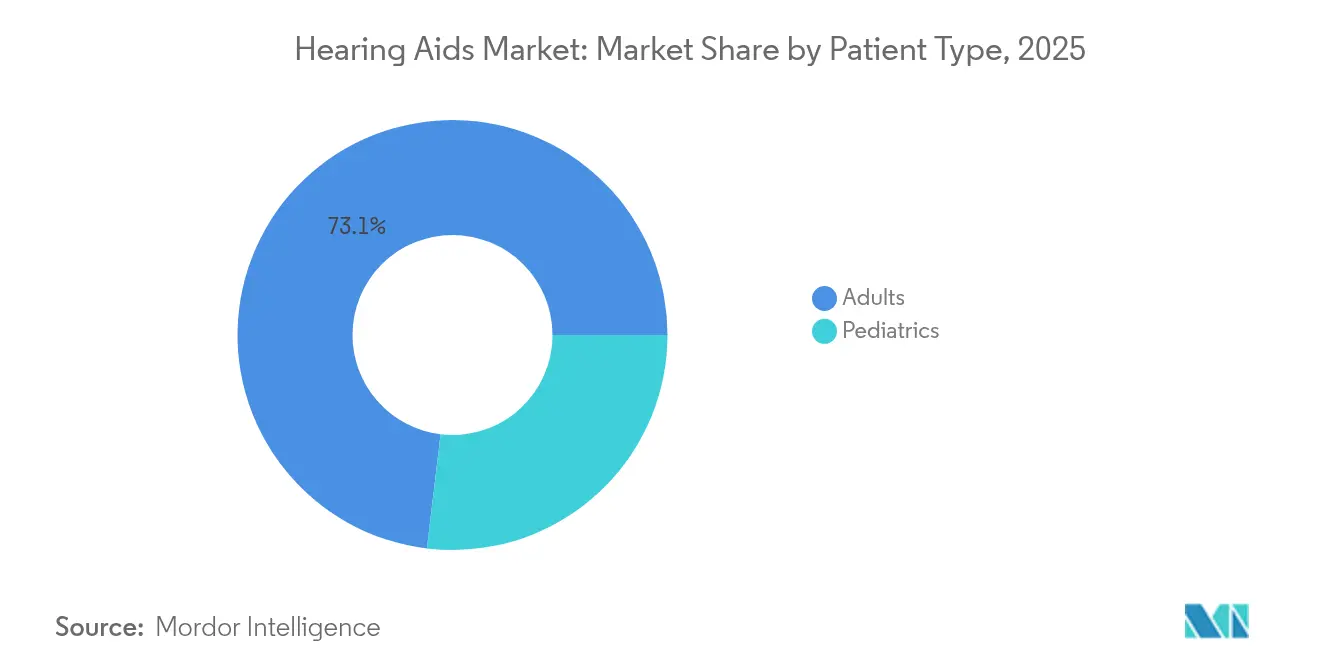
Adult Steadiness Versus Pediatric MomentumAdults made up 73.10% of 2025 purchasers, driven by workplace communication requirements and the clinical link between hearing care and cognitive health maintenance. The ACHIEVE study found that amplification reduces cognitive decline risk, motivating physicians to recommend screenings during routine check-ups. Older adults increasingly select rechargeable models to avoid dexterity challenges posed by tiny zinc-air batteries. Meanwhile, pediatric fittings are expanding at 8.25% CAGR through earlier newborn screening and relaxed cochlear implant candidacy criteria.
Children require tamper-proof battery doors, water-resistant housings and brightly colored shells for compliance monitoring. Frequent earmold replacements accommodate growth, creating a recurring revenue stream for audiology clinics inside the hearing aids market. Educational accommodations such as FM systems and classroom soundfield amplification also boost accessory sales. Non-profit programs and public tenders foster access in low-income regions, though global chip shortages have periodically delayed pediatric device deliveries, highlighting the need for diversified supply chains.
By Distribution Channel:
Clinical Prescriptions Confront Omnichannel ModelsPrescription routes commanded 64.95% of sales in 2025 on the strength of audiologist expertise, real-ear measurements and follow-up services that optimize long-term outcomes. Yet the regulatory opening for OTC devices fuels a 8.88% CAGR in retail pharmacies and e-commerce storefronts GAO. Hybrid tele-audiology platforms weave together online hearing tests, curbside device pickup and video counseling, blending convenience with clinical oversight. The Interstate Compact for Audiologists aims to expand cross-state practice, facilitating tele-fitting for rural populations.
Consumer electronics firms leverage vast app ecosystems to offer firmware updates and data visualization dashboards unavailable on many legacy prescription models. In response, incumbents launch subscription bundles that include loss-replacement insurance, unlimited remote tuning and yearly firmware upgrades. Price transparency rises as online marketplaces list feature-by-feature comparisons, pressuring margins yet enlarging the total hearing aids market pie by engaging first-time buyers who once ignored professional channels.
By Device Design:
Rechargeable Uptake Re-shapes User ExpectationsDisposable zinc-air batteries retained 54.10% share in 2025, but rechargeable lithium-ion formats grew 9.68% and already account for 80% of U.S. sales. Starkey’s Genesis AI delivers 51 hours of continuous use, addressing anxieties over charge longevity. Signia’s rechargeable completely-in-canal model extends the technology to the smallest form factor, broadening adoption among image-conscious users. Wireless charging docks and pocket power banks convert battery life into a lifestyle differentiator, mirroring smartphone accessory ecosystems.
R&D labs experiment with piezoelectric and thermoelectric harvesters that convert jaw motion, body heat and ambient light into trickle energy, aiming for fully self-powered hearing aids over the long term. While commercial launch remains distant, proof-of-concept prototypes showcase feasibility. Supply-chain resilience enters the strategic agenda as geopolitical tension tightens lithium availability; manufacturers now allocate 3-5% of revenue to supply-chain services for battery and semiconductor continuity. These steps help stabilize production volumes and protect the hearing aids market from component shocks.
Geography Analysis
North America Hearing Aids Market
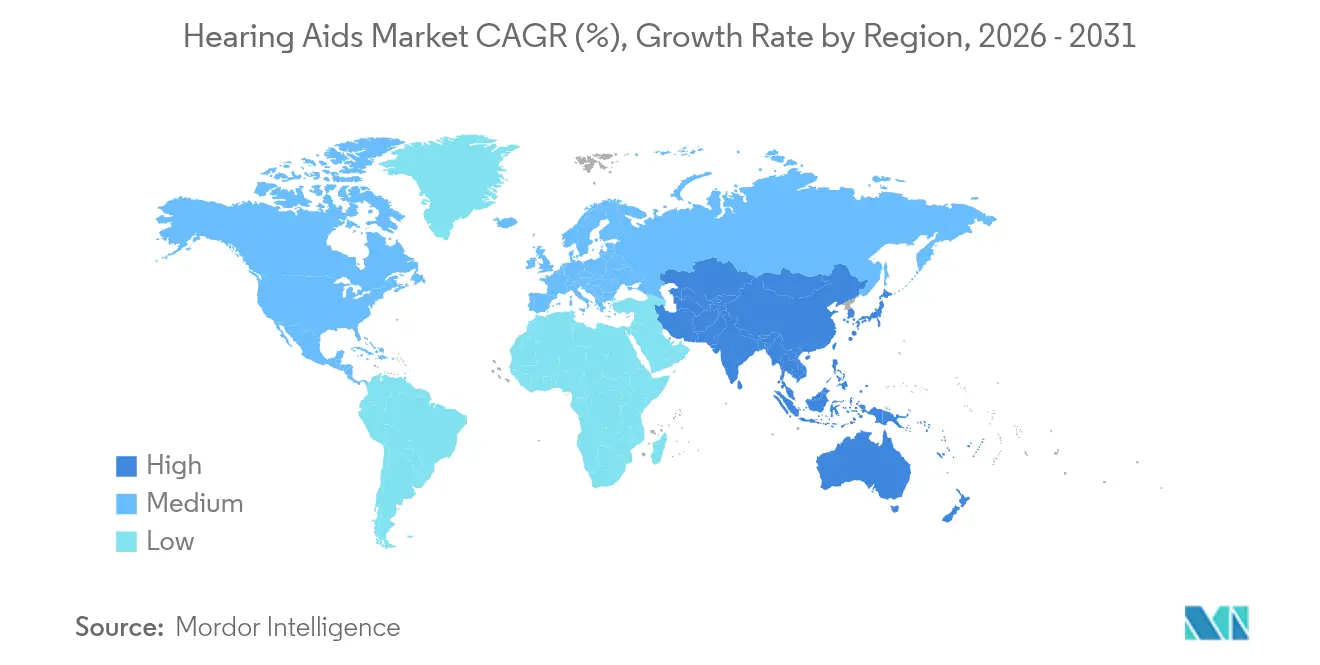
North America contributed 38.40% of global revenue in 2025, supported by Medicare Advantage coverage, Veterans Affairs volume and tech-forward consumers who embrace Apple’s FDA-cleared AirPods Pro 2 hearing aid function. High household income and insurance penetration enable premium ASPs, especially for AI-based receivers with health-monitoring add-ons. Canada’s single-payer system reimburses basic models, while private plans cover upgrades, sustaining a balanced public-private mix. Mexico records rising uptake through public tender programs and mid-tier private clinics targeting urban middle-class professionals.
Europe Hearing Aids Market
Europe maintains a solid presence through universal coverage and Medical Device Regulation harmonization. Germany leads unit volume under statutory health insurance that subsidizes entry-level digital aids, yet consumers often co-pay for rechargeable or Bluetooth-enabled options. The United Kingdom faces dual regulatory pathways post-Brexit, requiring CE and UKCA marks that raise compliance costs. Italy and Spain continue to modernize aging audiology centers with tele-fitting tools, while France expands occupational hearing conservation, creating upstream screening demand.
APAC and Oceania Hearing Aids Market
Asia-Pacific is the fastest-growing hub at 7.86% CAGR, led by Japan where fashionable designs overcome stigma and benefit from strong yen purchasing power. China’s Healthy Elderly 2030 plan reimburses digital aids for low-income seniors, expanding public funding. India sees private chain hospitals entering tier-2 cities with bundled ENT and audiology services, although GST adds cost pressure. South Korea pioneers 5G-enabled cloud fitting, and Australia broadens its Hearing Services Program to cover remote indigenous communities. Southeast Asia benefits from rising middle-class incomes and corporate insurance packages that include hearing benefits.
Mordor Intelligence provides coverage of the hearing aids market across other key regional markets. Detailed country-level analysis extends to Denmark incorporating local coverage and market participation, as required.

Competitive Landscape
The hearing aids market is moderately concentrated around GN Store Nord and other major companies, which together control signficant global revenue. Vertical integration from R&D to branded retail enables rapid rollout of flagship platforms and firmware updates that keep installed bases current. These leaders invest 6-8% of sales into R&D, with focus on neural processing, energy harvesting and miniaturized antennas.
Convergence with consumer electronics raises competitive heat. Apple leverages its existing earbud franchise to introduce low-cost, software-defined amplification that undercuts traditional ASPs. Bose and Sony pursue similar certification paths, while EssilorLuxottica fuses eyewear and audio through Nuance Audio smart glasses. Such entrants boast strong brand recognition and distribution, forcing incumbents to defend share through concierge-style service and insurance partnerships.
M&A activity underscores the race for scale and technology assets. Eargo’s merger with hearX to form LXE Hearing brings USD 100 million in capital to expand OTC distribution. Demant’s acquisition of GN’s retail chain strengthens its cross-channel presence in Scandinavia. Meanwhile, supply-chain resilience drives dual-sourcing of semiconductors and lithium-ion cells to mitigate geopolitical risk, with manufacturers earmarking 3-5% of revenue for logistics diversification.
Hearing Aids Industry Leaders
Audina Hearing Instruments, Inc.
Amplifon SpA
Cochlear Ltd
Horentek Hearing Diagnostics
GN Store Nord A/S
- *Disclaimer: Major Players sorted in no particular order
Hearing Aids Market Companies Covered in this Report
- Sonova
- Demant A/S (Oticon)
- GN Store Nord A/S (ReSound, Jabra Enhance)
- WS Audiology (Signia, Widex)
- Starkey Hearing Technologies
- Cochlear
- MED-EL
- Amplifon
- Eargo Inc
- Rexton
- Phonak
- Audina Hearing Instruments Inc
- Horentek Hearing Diagnostic
- Vivtone
- Elehear
- Nuheara Ltd
- Lively Hearing / Jabra Enhance
- Audicus
- Bose Corporation (SoundControl)
- Sony Corporation (CRE-C10)
- Apple Inc (AirPods-hearing features)

Market Opportunities and Future Outlook
Consolidation and vertical integration are reshaping market dynamics in the hearing aids space. Amplifon S.p.A.'s March 2026 definitive agreement to acquire GN Hearing (ReSound and Beltone) for DKK 17 billion, alongside Demant A/S completing the KIND Group acquisition in December 2025 (adding about 650 clinics, taking its network to over 4,500 clinics), highlights how leading players are building tighter control over both device access and downstream care pathways. These moves support expanded service bundles (remote fine-tuning, loss-and-damage protection, and subscription-style upgrades) that address price sensitivity and reduce abandonment in OTC and entry-level segments.
Interoperability and standards-led upgrades are a second opportunity area, as hearing aids integrate deeper into public-venue audio and smartphone ecosystems. The April 2026 draft of IEC 60118-17 for 2.4 GHz audio broadcasting systems for hearing aids and the February 2025 amendment EN 61669:2016/A1:2025 on real-ear acoustical performance measurement reflect a shift toward measurable, real-world performance and wireless broadcast compatibility. With Bluetooth LE Audio and Auracast becoming practical differentiators, manufacturers and venue operators have room to expand assistive listening deployments (airports, theaters, lecture halls) and to monetize software-enabled features tied to AI sound processing and cloud-connected fitting, while maintaining clear separation from non-medical PSAP offerings within the reports scope.
Recent Industry Developments in Hearing Aids Market
- July 2026: Cochlear announced US FDA clearance of the Osia 3 Sound Processor, adding a rechargeable lithium-ion battery and Bluetooth LE Audio streaming. The upgrade strengthens Cochlear's bone conduction ecosystem and aligns implantable solutions with the same connectivity expectations shaping premium external hearing devices. Commercial availability in the United States was scheduled for early fall 2026.
- June 2026: Amplifon signed a EUR 1.35 billion senior loan to support its planned acquisition of GN Hearing, following an equity raise completed in May 2026. The financing package underpins a large vertical integration move that combines a global retail platform with major hearing-aid brands (ReSound and Beltone), reshaping bargaining power across procurement, distribution, and aftercare services.
- April 2024: GN Hearing expanded its product portfolio with a major new model line and enhanced Bluetooth LE Audio compatibility, broadening its reach in premium and mid-range segments across key markets.


Hearing Aids Market Report Scope and Research Methodology
Market Definition and Coverage
This market covers hearing aid devices sold for hearing loss management, including externally worn formats and implantable solutions, and it is measured as revenue generated from product sales across end users and channels.
Scope exclusions: We exclude personal sound amplification products (PSAPs) and purely diagnostic audiology equipment because they follow different demand signals and pricing logic.
Segments Covered in This Report
- By Product Type
- Behind-the-Ear (BTE)
- Receiver-in-Canal (RIC) / Receiver-in-Ear (RITE)
- In-the-Ear (ITE)
- Completely-in-Canal (CIC)
- Implantable (Cochlear, Bone-anchored)
- Other Hearing Aids
- By Technology
- Conventional Analog
- Digital
- AI-enabled / Smart
- By Type of Hearing Loss
- Sensorineural
- Conductive
- Mixed
- Single-sided Deafness
- By Patient Type
- Adults
- Pediatrics / Children
- By Distribution Channel
- Prescription (Hearing-care professionals)
- OTC Retail Pharmacies
- Online Direct-to-Consumer
- Hybrid Tele-audiology
- By Device Design
- Disposable Battery
- Rechargeable Lithium-ion
- Energy-harvesting / Solar
- Geography
- North America
- United States
- Canada
- Mexico
- Europe
- Germany
- United Kingdom
- France
- Italy
- Spain
- Rest of Europe
- Asia-Pacific
- China
- Japan
- India
- South Korea
- Australia
- Rest of Asia-Pacific
- Middle East and Africa
- GCC
- South Africa
- Rest of Middle East and Africa
- South America
- Brazil
- Argentina
- Rest of South America
- North America
Data Sources, Market Sizing, and Validation
Desk Research
Desk work starts by building a clean fact base on hearing loss burden, access to hearing care, and device adoption patterns. We refer to public sources such as the World Health Organization, the US FDA, the US CDC, and the National Institutes of Health, along with OECD health statistics where available, to ground the demand pool and policy context.
Next, we sharpen the commercial view using company filings and investor presentations, audited annual reports, reputable press coverage, and association websites that discuss dispensing channels and product trends. We also run supporting checks using patent databases (to track feature shifts like signal processing) and an import and export shipment level database when trade flows help explain unit movement in specific countries. The sources listed here are illustrative, and additional public references were also used for data collection, validation, and clarification during the work.
Primary Interviews and Surveys
Primary discussions were run with a mix of manufacturers, distributors, clinic level stakeholders, and hearing care professionals to validate adoption drivers and the practical pricing ranges seen in the field. For a global market, inputs were balanced across APAC, EMEA, and the Americas so reimbursement realities, channel splits, and consumer buying behavior could be stress tested before finalizing assumptions.
Distribution of primary research fieldwork respondents
| Company type | Respondent position | Region |
|---|---|---|
| Top tier: 28% | CXOs: 15% | APAC: 44% |
| Mid tier: 57% | Functional/Unit leaders: 38% | EMEA: 37% |
| Smaller Players: 15% | Managers: 47% | Americas: 19% |
Market-Sizing & Forecasting
Sizing is built using a top-down approach where prevalence, treatment seeking behavior, and country level access indicators are converted into an addressable user pool, and then translated into value using typical replacement cycles and average selling prices by major device formats. Once the demand pool is shaped, totals are cross checked with selective bottom-up approximations, such as sampling unit volumes through channel checks and applying realistic ASP bands, followed by supplier and distributor sanity checks where gaps remain.
A few practical inputs keep the model tied to reality, including the share of elderly population, diagnosed hearing loss rates, fitted patient volumes, replacement frequency, reimbursement coverage signals, and price mix shifts as digital features expand. Since not every country has complete public series, missing points are filled using peer country proxies, then adjusted using primary feedback on local dispensing intensity.
For forecasting, scenario analysis is used to reflect policy and channel uncertainty, and the year to year curve is guided by expert consensus on variables like aging rates, adoption of OTC pathways where relevant, and expected ASP movement. When key assumptions diverge from observed trends, they are revised and rerun so the forecast stays reproducible and explainable on a client call.
Data Validation & Update Cycle
Validation happens in layers so that obvious and subtle errors are caught before numbers are finalized. We compare outputs against independent signals such as procedure and fitting indicators, trade movement where relevant, and the implied per patient spend, then run variance checks to confirm that growth does not jump without a clear driver.
Any anomaly triggers a deeper review of the input series and, when needed, a re-contact with interviewees to confirm whether a change is structural or temporary. The work is reviewed by multiple analysts before sign-off, reports are refreshed annually, and interim updates are made when material events shift pricing, regulation, or access. Before delivery, a final pass is completed so clients receive the most current view available at that time.
Mordor Intelligence's Hearing Aids Market Size Measured Against Other Published Estimates
Published market values for hearing aids can differ even when they appear to cover the same topic, because each estimate can follow a different product scope, year mapping, and pricing assumptions. The spread usually comes from what is counted as a hearing aid, how implants are treated, and whether the model leans more on demand indicators or on shipment style proxies.
In practice, the biggest gap drivers are scope boundaries (for example, including PSAP type amplifiers or bundling audiology services), different base year currency conversion timing, and how ASP change is handled as premium features grow. Some figures also assume faster adoption in emerging channels, while others stay conservative, and differences can be amplified when refresh cadence does not keep up with policy changes or reimbursement updates.
In the Mordor Intelligence approach, the 2025 number stays traceable to clear steps by keeping PSAPs and stand-alone diagnostic equipment outside the total and by tying volumes back to fitted patient and replacement logic, using a consistent modeling sequence.
Benchmark comparison
| Source | Market Size | Gaps in Research Methodology |
|---|---|---|
| Mordor Intelligence | USD 10.12 B (2025) | |
| Global Consultancy A | USD 9.74 B (2024) | Uses a different base year and can mix device value with adjacent hearing implant framing, which shifts the year-on-year bridge and the implied ASP path. |
| Industry Publisher B | USD 8.30 B (2024) | Often reflects a narrower country set and a more conservative channel mix, and it may exclude certain implantable solutions or price tiers that lift total value. |
The table shows that the gap is mostly explained by year selection and what is kept inside the market, then by how pricing and channel shifts are carried forward.


Key Questions Answered in the Report
What is the current size of the hearing aids market and how fast is it growing?
The market is valued at USD 10.6 billion in 2026 and is forecast to rise to USD 13.34 billion by 2031 at a 4.72% CAGR.
Which product category holds the largest revenue share today?
Behind-the-Ear devices lead with 44.88% of global revenue in 2025.
What region is expected to record the fastest expansion through 2031?
Asia-Pacific is projected to advance at an 7.86% CAGR, outpacing all other regions.
How are over-the-counter (OTC) regulations affecting distribution models?
U.S. OTC legalization is spurring a 8.88% CAGR for retail pharmacies and e-commerce channels while compressing traditional audiology margins.
What role do rechargeable batteries play in user adoption?
Rechargeable lithium-ion models now make up 80% of U.S. unit sales and are growing globally at 9.68% CAGR thanks to longer runtime and convenience.
Page last updated on:




