Self-Service Kiosk Market Size and Share
Market Overview
| Study Period | 2020 - 2031 |
|---|---|
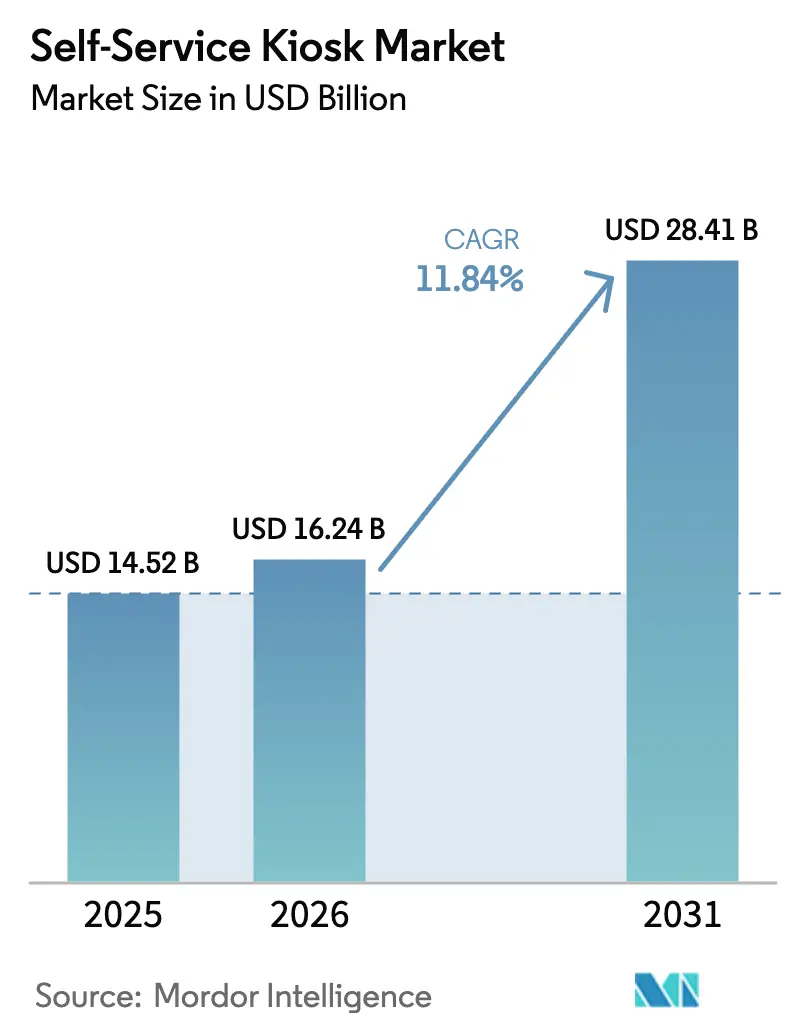
| Market Size (2026) | USD 16.24 Billion |
| Market Size (2031) | USD 28.41 Billion |
| Growth Rate (2026 - 2031) | 11.84% CAGR |
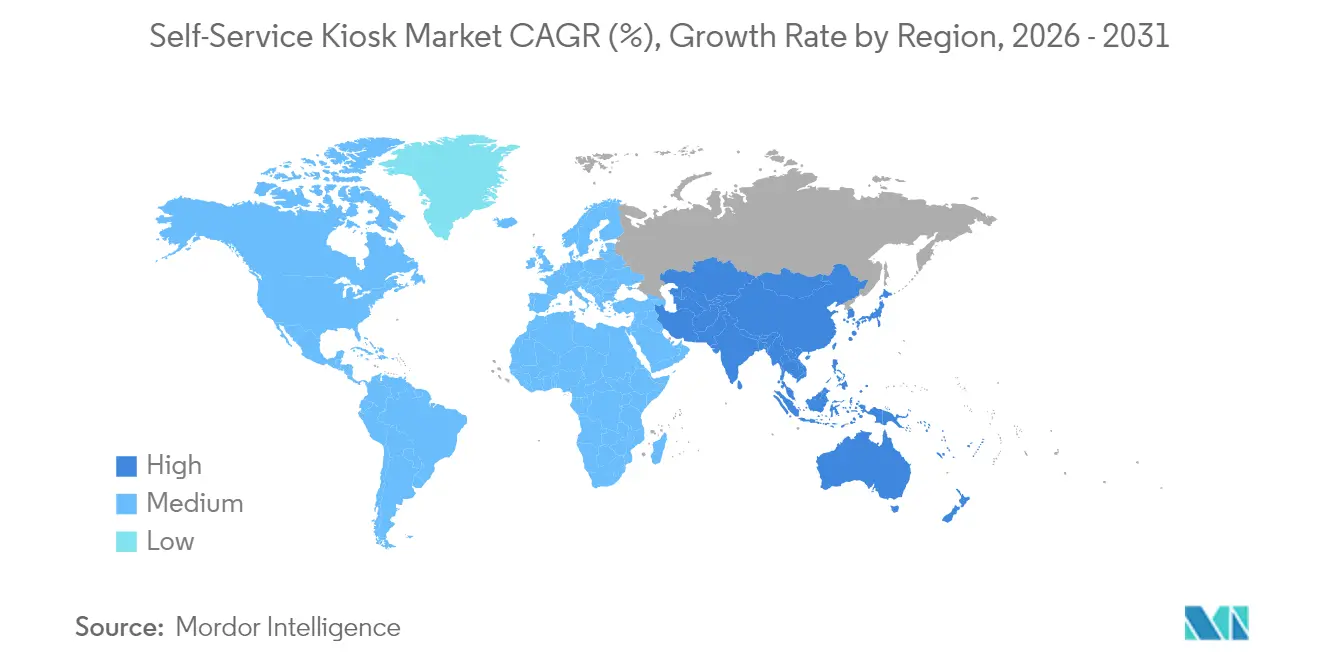
| Fastest Growing Market | Asia Pacific |
| Largest Market | North America |
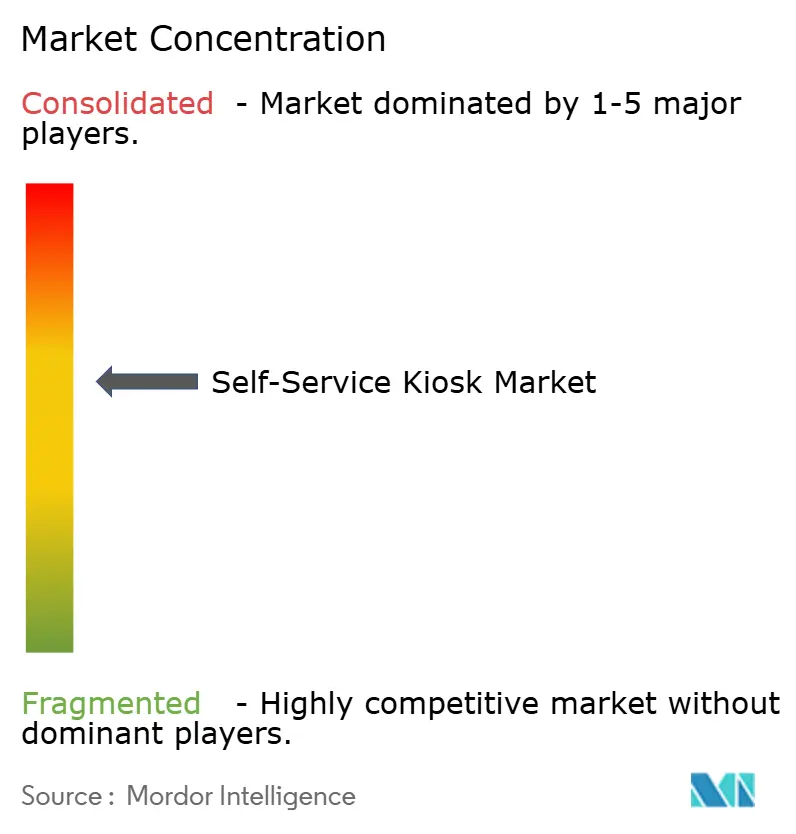
| Market Concentration | Medium |
Major Players *Disclaimer: Major Players sorted in no particular order Image © Mordor Intelligence. Reuse requires attribution under CC BY 4.0. | |
Self-Service Kiosk Market Analysis by Mordor Intelligence
The self-service kiosk market size is expected to grow from USD 14.52 billion in 2025 to USD 16.24 billion in 2026 and is forecast to reach USD 28.41 billion by 2031 at 11.84% CAGR over 2026-2031. Growth is being propelled by contactless service expectations, continuing labor shortages, broadening digital payments, and the steady integration of artificial intelligence into kiosk platforms. Hardware continues to account for the majority of deployments, yet the pace of software upgrades signals a shift from simple transaction points toward cloud-connected, analytics-enabled engagement hubs. Expansion is especially apparent in retail, hospitality, and healthcare settings where kiosks accelerate throughput while maintaining service consistency. The competitive field shows incumbent hardware suppliers adding managed service layers, enabling subscription models that lower capital barriers and bolster recurring revenue.
Key Report Takeaways
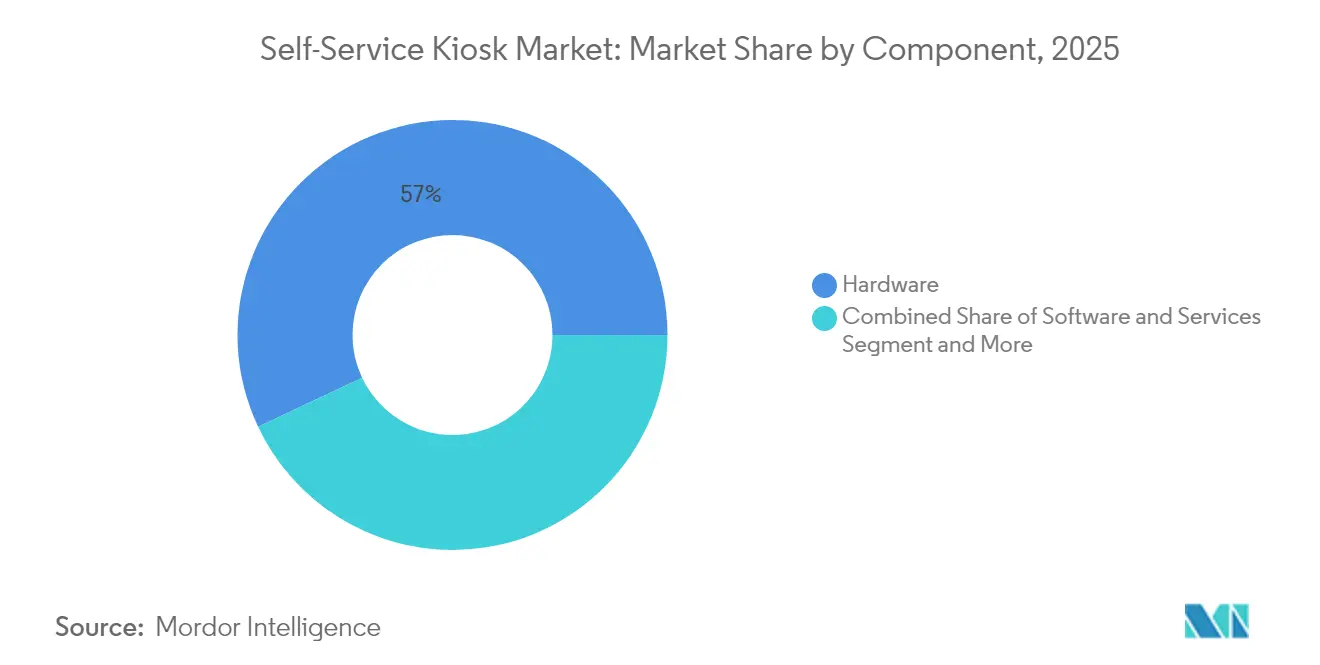
- By component, hardware held 57.02% revenue share of the self-service kiosk market in 2025 while software is forecast to grow at 13.78% CAGR through 2031.
- By type, banking and financial kiosks led with 28.12% of self-service kiosk market share in 2025; retail self-checkout kiosks are projected to register a 15.62% CAGR to 2031.
- By end-user vertical, retail and e-commerce commanded 29.34% share of the self-service kiosk market in 2025, whereas hospitality and quick-service restaurants are expanding at 15.12% CAGR to 2031.
- By geography, North America accounted for 38.74% of global revenue in 2025, while Asia-Pacific is poised for the fastest growth at 17.46% CAGR through 2031.
Note: Market size and forecast figures in this report are generated using Mordor Intelligence’s proprietary estimation framework, updated with the latest available data and insights as of 2026.
Global Self-Service Kiosk Market Trends and Insights
Drivers Impact Analysis*
| Driver | (~) % Impact on CAGR Forecast | Geographic Relevance | Impact Timeline |
|---|---|---|---|
| Rising consumer preference for contactless interactions | +3.2% | Global; strongest in North America and Europe | Short term (≤ 2 years) |
| Digital payment ecosystem expansion | +2.8% | Asia-Pacific core, extending to MEA and Latin America | Medium term (2-4 years) |
| AI-driven personalization and analytics integration | +2.1% | North America and Europe leading | Medium term (2-4 years) |
| Labour-cost inflation boosting ROI | +1.9% | Global; acute in developed markets | Short term (≤ 2 years) |
| Rapid deployment across retail, hospitality, healthcare | +1.4% | Global, sector-specific variance | Medium term (2-4 years) |
| Kiosk-as-a-Service subscription adoption | +0.8% | North America and Europe first movers | Long term (≥ 4 years) |
| Source: Mordor Intelligence | |||
Rising consumer preference for contactless interactions
Pandemic-era habits reset service expectations, turning no-touch journeys into a lasting norm. Retailers, restaurants, and health providers now benchmark convenience by how little staff interaction is required. Counties such as Webb in Texas introduced telehealth kiosks so residents could consult clinicians without waiting rooms, demonstrating the appeal in public-sector care settings.[1]Webb County, “Commissioners Court Launches Telehealth Kiosk,” co.webb.tx.us Younger cohorts reinforce the trend; Gen Z and Millennial diners overwhelmingly select eateries offering self-ordering, ensuring a durable demand pipeline. As more operators deploy kiosks to stay competitive, customer familiarity multiplies, embedding contactless journeys into mainstream service design.
Digital payment ecosystem expansion
Mobile wallets, QR codes, and biometric authentication are converging around kiosks, making them essential acceptance points wherever cashless spend is rising. In Asia-Pacific, contactless tap-and-go drove Elo to release a kiosk line that integrates NFC modules for Apple Pay, Google Pay, and regional wallets, letting merchants accept diverse instruments from a single terminal.[2]Elo Touch Solutions, “Elo Self-Service Platform Data Sheet,” elotouch.com In markets with limited branch networks, the same form factor doubles as a mini-bank for bill pay and remittances, widening the addressable base beyond retail.
AI-driven personalization and analytics integration
Machine-learning models now sit inside kiosk software stacks, turning static interfaces into adaptive concierges. Partner Tech’s Paula uses computer vision to tailor menus based on demographic cues and past orders, while capturing granular behavior logs for operators. Computer-vision scanning from NCR Voyix’s Halo Checkout eliminates individual barcode scans by identifying up to 20 products at once, compressing checkout time and reducing mis-scans.[3]NCR Voyix, “Halo Checkout Product Overview,” ncrvoyix.com The data-rich feedback loop lets businesses refine layouts, pricing, and promotions in near real time.
Labour-cost inflation boosting ROI
Rising wages intensify the math favoring automation. Restaurant operators deploying two ordering kiosks report labor re-allocation savings that cut payback to well under a year. Cuboh, a food-service technology provider, prices kiosks at USD 100 monthly plus hardware, demonstrating how predictable subscription costs offset unpredictable payroll spikes. Upselling prompts embedded in software further lift average tickets, pairing cost relief with incremental revenue.
Restraints Impact Analysis*
| Restraint | (~) % Impact on CAGR Forecast | Geographic Relevance | Impact Timeline |
|---|---|---|---|
| High maintenance and upgrade costs | -1.8% | Global; sharper in cost-sensitive markets | Medium term (2-4 years) |
| Cyber-security and fraud concerns | -1.2% | Global; heightened in financial services | Short term (≤ 2 years) |
| Consumer resistance and lack of interoperability | -0.9% | Varies; higher in traditional markets | Medium term (2-4 years) |
| Emerging e-waste compliance pressures | -0.4% | Europe and North America first adopters | Long term (≥ 4 years) |
| Source: Mordor Intelligence | |||
High maintenance and upgrade costs
Annual service contracts, component swaps, and firmware revisions can add 10-15% of initial outlay each year, eroding total-cost-of-ownership savings. Synchronizing updates across dispersed fleets strains small chains that lack in-house IT. Subscription offerings shift expense from capex to opex but may raise lifetime spend, forcing buyers to model trade-offs carefully. Providers that embed predictive maintenance analytics are gaining traction by lowering truck-roll frequency and downtime, yet those capabilities still command premium fees.
Cyber-security and fraud concerns
Unattended endpoints create attractive targets for card skimming and credential theft. Academic reviews note that kiosk operating systems often lag behind desktop patch cycles, widening exploit windows. Financial-service deployers face stringent PCI and regional data-protection mandates, adding encryption modules and remote wipe features that raise integration complexity. Balancing frictionless UX with multi-factor safeguards remains an industry tension; too many authentication steps can depress throughput, whereas lax controls expose operators to fines and reputational damage.
*Our forecasts treat driver/restraint impacts as directional, not additive. The impact forecasts reflect baseline growth, mix effects, and variable interactions.
Segment Analysis
By Component: Hardware Dominance Meets Software Innovation
The component split of the self-service kiosk market shows hardware at 57.02% revenue in 2025, reflecting ongoing demand for ruggedized displays, printers, payment readers, and enclosures. Software’s narrower revenue base is expanding at 13.78% CAGR, propelled by cloud orchestration, content-management suites, and analytics dashboards. Platform software that unifies fleet monitoring across thousands of endpoints is becoming indispensable as retailers roll out enterprise-wide standards. Application layers add differentiation through targeted upselling logic, loyalty integration, and adaptive user interfaces. Services—installation, break-fix, and remote monitoring—mirror deployment momentum; integrators offering turnkey packages see rising attach rates as buyers seek single-throat accountability.
Ecosystem players are responding with modular designs. Zebra Technologies unveiled a kiosk line that shares core compute modules across form factors, reducing spares inventory and simplifying field swaps. Such standardization shortens mean-time-to-repair and supports circular-economy ambitions by enabling component-level recycling. As software upgrades unlock new functionality, operators can extend asset life without wholesale unit replacement, aligning capex cycles with rapidly changing consumer expectations.


By Type: Banking Leadership Challenged by Retail Innovation
Banking and financial kiosks commanded 28.12% revenue in 2025 on the back of ATM replacement programs and branch downsizing. Self-service check deposit, cash recycling, and video-assisted advisory keep the format integral to omnichannel banking strategies. Yet the retail self-checkout wave is advancing fastest, with a projected 15.62% CAGR that could narrow the gap in absolute spend by 2031. The self-service kiosk market size for retail self-checkout is forecast to climb above USD 9.3 billion within the outlook period, reflecting grocers’ and mass-merchants’ rollouts.
Transport ticketing remains steady as smart-city mobility initiatives fund rail and subway expansions. Casinos leverage kiosks for loyalty enrollment and cashless wallet top-ups, supporting regulatory tightening around AML reporting. Healthcare registration units are accelerating as providers digitize front-of-house workflows and comply with privacy rules. Intelligent vending, moving from snacks to electronics and PPE, gains traction in corporate campuses, airports, and hospitals, proving that the vending form factor can stretch into micro-fulfillment. Hospitality check-in/out kiosks now layer AI-powered wayfinding and concierge content, expanding revenue per guest while trimming lobby queues.
By End-User Vertical: Retail Dominance Amid Hospitality Surge
Retail and e-commerce retained 29.34% revenue in 2025, anchored by large grocery chains enhancing front-end throughput. Many retailers repurpose kiosks for endless-aisle browsing, price checks, and returns, widening use cases beyond tendering cash. Hospitality operators, experiencing double-digit wage inflation, are adopting counter-order and drive-through kiosks, pushing the vertical to a 15.12% CAGR. The self-service kiosk market share for hospitality could exceed 20.00% by 2031 if current momentum persists.
Financial-services institutions deploy kiosks for routine banking tasks, freeing tellers to handle advisory. Transportation stakeholders exploit kiosks for integrated check-in, baggage tag print, and wayfinding, critical to managing post-pandemic passenger volumes. Healthcare uses extend from patient-intake to telehealth, particularly in rural clinics that lack specialist staff on site. Entertainment venues rely on kiosks for ticketing and concessions, integrating real-time inventory and seating maps to optimize upsells. Government agencies and utilities embed kiosks in civic centers for bill pay, permit applications, and form submission, broadening service hours without staffing increases.
Geography Analysis
North America led the self-service kiosk market with 38.74% revenue in 2025. Mature retail ecosystems, fast adoption of EMV and tap-to-pay, and ADA-driven design standards underpin sustained deployments. The United States alone hosts multi-thousand-unit fleets across big-box retail, airports, and QSR chains. Canada shows elevated healthcare kiosk penetration as provincial systems seek triage automation and remote-care intake, while Mexico benefits from cross-border technology imports and rising card issuance supporting unattended payments.
Asia-Pacific is forecast to deliver the highest regional CAGR at 17.46% through 2031. Urbanization and smartphone wallet usage create fertile ground for kiosk-enabled micro-payments, transport ticketing, and parcel collection. Chinese retailers expanding convenience footprints increasingly combine smart shelving with kiosk check-out to streamline store formats, while India leverages kiosks as “digital grams” to extend government services and banking to rural residents. Japan and South Korea pioneer robotics-enabled kiosks that cook, bag, or dispense items autonomously, setting performance benchmarks that are slowly globalizing.

Competitive Landscape
The self-service kiosk market remains moderately fragmented though consolidation is accelerating. Traditional hardware specialists NCR Voyix and Diebold Nixdorf dominate retail and banking niches respectively, yet emerging integrators and software-first entrants are eroding share by wrapping devices in data-rich platforms. NCR Voyix’s portfolio spans self-checkout, computer-vision basket recognition, and SaaS analytics, giving retailers a single-vendor stack for store modernization. Diebold Nixdorf leans on financial-grade security credentials, recently rolling Vynamic cloud middleware across credit-union fleets to enable video assistance and centralized monitoring.
Strategic moves show a pivot to subscription pricing. Cuboh’s USD 100 monthly model positions kiosks as an operational expense for restaurants rather than capital equipment, easing entry for independents. DynaTouch’s acquisition of KioWare combines kiosk hardware with lockdown and content-management software, enhancing end-to-end control for government and healthcare clients. Meanwhile, Zebra Technologies reported Q4 2024 net sales of USD 1,334 million, with Enterprise Visibility and Mobility—home to its kiosk and handheld lines—up 32.2% year over year, evidencing robust demand in vertical-specific mobility.
Self-Service Kiosk Industry Leaders
Diebold Nixdorf, Incorporated
NCR Voyix Corporation
KIOSK Information Systems
VeriFone Systems, Inc.
Zebra Technologies Corporation
- *Disclaimer: Major Players sorted in no particular order

Recent Industry Developments
- October 2024: Diebold Nixdorf equipped America First Credit Union with cloud-native ATM technology featuring Vynamic Transaction Middleware and real-time video assistance.
- July 2024: Diebold Nixdorf installed self-service checkouts with automatic age verification at Dorfladen Freckenfeld grocery, enabling 24/7 operation.
- June 2024: Olea introduced the Boulder Outdoor Kiosk, engineered for extreme weather and remote deployments.
- June 2024: Toshiba Tec reported consolidated net sales of JPY 548,135 million for FY 2024, with Retail Solutions revenue of JPY 311,004 million.


Global Self-Service Kiosk Market Report Scope
A self-service kiosk is an interactive tablet or touchscreen computer that allows a customer to access information or services without directly interacting with a person. Implementing self-service kiosks can allow a business to scale operations more quickly and efficiently while at the same time reducing costs.
The self-service kiosk market is segmented by component (hardware, software, service), by type (casino, check-in, banking, ticketing, other types), by end-user vertical (BFSI, retail, entertainment and media, transportation, other end-user verticals), by geography (North America, Europe, Asia-Pacific, Latin America, Middle East and Africa). The market sizes and forecasts are provided in terms of value (USD) for all the above segments.
| Hardware | Displays and Touchscreens |
| Enclosures and Housings | |
| Printers and Scanners | |
| Card and Cash-handling Modules | |
| Software | Platform / OS |
| Application and Analytics | |
| Services |
| Banking / Financial |
| Check-in / Hospitality |
| Retail Self-Checkout |
| Ticketing (Transport and Events) |
| Casino and Gaming |
| Healthcare Registration |
| Vending and Food Ordering |
| BFSI |
| Retail and e-Commerce |
| Transportation (Air/Rail/Bus) |
| Hospitality and QSR |
| Healthcare |
| Entertainment and Media |
| Government and Utilities |
| North America | United States | |
| Canada | ||
| Mexico | ||
| South America | Brazil | |
| Argentina | ||
| Rest of South America | ||
| Europe | United Kingdom | |
| Germany | ||
| France | ||
| Italy | ||
| Spain | ||
| Russia | ||
| Rest of Europe | ||
| Asia-Pacific | China | |
| Japan | ||
| India | ||
| South Korea | ||
| Australia and New Zealand | ||
| Rest of Asia-Pacific | ||
| Middle East and Africa | Middle East | Saudi Arabia |
| UAE | ||
| Turkey | ||
| Rest of Middle East | ||
| Africa | South Africa | |
| Nigeria | ||
| Kenya | ||
| Rest of Africa | ||
| By Component | Hardware | Displays and Touchscreens | |
| Enclosures and Housings | |||
| Printers and Scanners | |||
| Card and Cash-handling Modules | |||
| Software | Platform / OS | ||
| Application and Analytics | |||
| Services | |||
| By Type | Banking / Financial | ||
| Check-in / Hospitality | |||
| Retail Self-Checkout | |||
| Ticketing (Transport and Events) | |||
| Casino and Gaming | |||
| Healthcare Registration | |||
| Vending and Food Ordering | |||
| By End-user Vertical | BFSI | ||
| Retail and e-Commerce | |||
| Transportation (Air/Rail/Bus) | |||
| Hospitality and QSR | |||
| Healthcare | |||
| Entertainment and Media | |||
| Government and Utilities | |||
| By Geography | North America | United States | |
| Canada | |||
| Mexico | |||
| South America | Brazil | ||
| Argentina | |||
| Rest of South America | |||
| Europe | United Kingdom | ||
| Germany | |||
| France | |||
| Italy | |||
| Spain | |||
| Russia | |||
| Rest of Europe | |||
| Asia-Pacific | China | ||
| Japan | |||
| India | |||
| South Korea | |||
| Australia and New Zealand | |||
| Rest of Asia-Pacific | |||
| Middle East and Africa | Middle East | Saudi Arabia | |
| UAE | |||
| Turkey | |||
| Rest of Middle East | |||
| Africa | South Africa | ||
| Nigeria | |||
| Kenya | |||
| Rest of Africa | |||


Key Questions Answered in the Report
What is the current value of the self-service kiosk market?
The market is valued at USD 16.24 billion in 2026.
How fast is the self-service kiosk market expected to grow?
It is projected to register a 11.84% CAGR, reaching USD 28.41 billion by 2031.
Which component segment is growing fastest?
Software is expanding at 13.78% CAGR as operators seek cloud control, analytics, and personalized UX.
Why are restaurants investing in kiosks?
Labor-cost inflation and order-value uplift from AI-driven upselling shorten ROI, making kiosks attractive for QSRs.
Page last updated on:


