Gesture Recognition In Retail Market Size and Share
Market Overview
| Study Period | 2019 - 2030 |
|---|---|
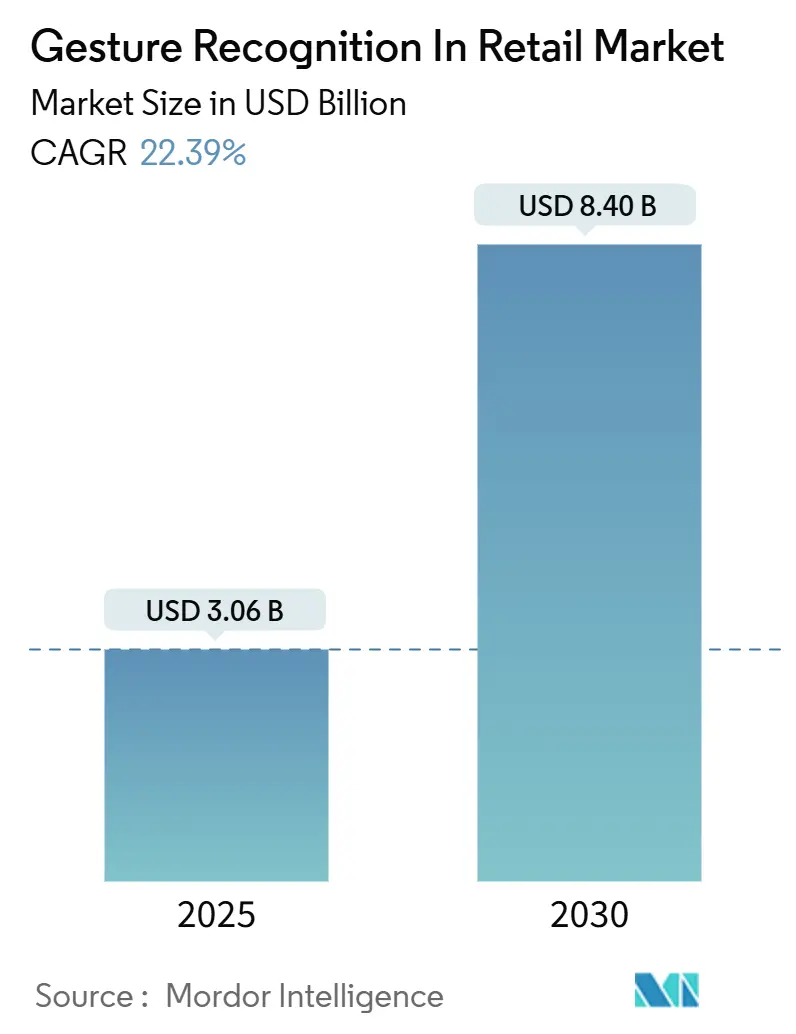
| Market Size (2025) | USD 3.06 Billion |
| Market Size (2030) | USD 8.40 Billion |
| Growth Rate (2025 - 2030) | 22.39% CAGR |
| Fastest Growing Market | Asia Pacific |
| Largest Market | North America |
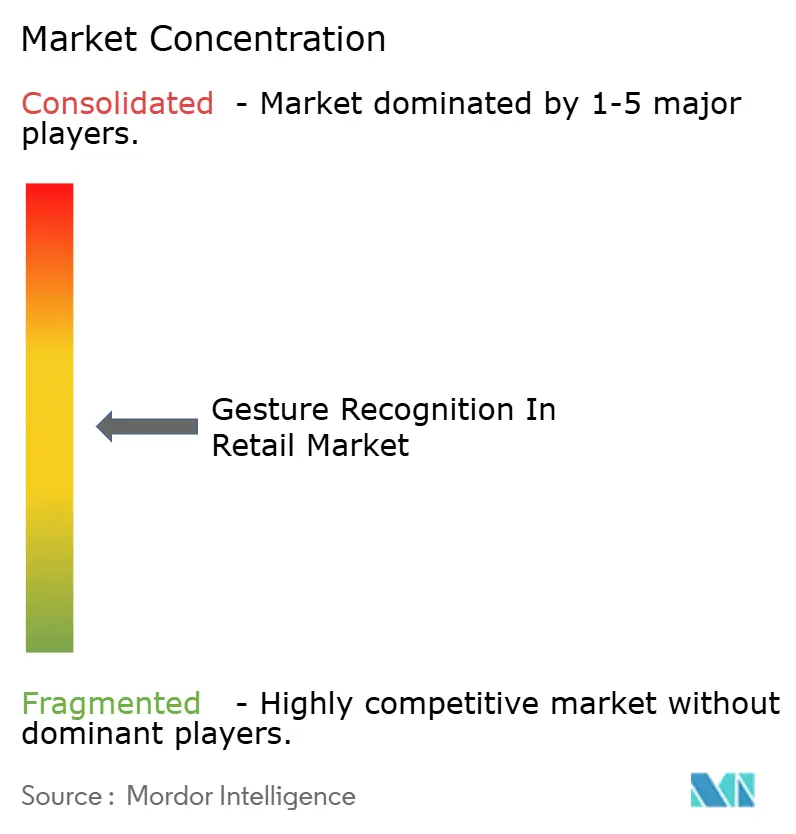
| Market Concentration | Medium |
Major Players *Disclaimer: Major Players sorted in no particular order Image © Mordor Intelligence. Reuse requires attribution under CC BY 4.0. | |
Gesture Recognition In Retail Market Analysis by Mordor Intelligence
The Gesture Recognition In Retail Market size is estimated at USD 3.06 billion in 2025, and is expected to reach USD 8.40 billion by 2030, at a CAGR of 22.39% during the forecast period (2025-2030). Rising labor shortages, sustained demand for contact-free journeys, and the integration of edge AI with millimeter-wave radar now enable through-shelf gesture detection that operates without a direct camera view.[1]Intel Corporation, “Edge AI Vision Accelerates Retail Innovation,” intel.com Retailers gain richer in-aisle analytics, while consumer packaged goods brands monetize the resulting behavioral data streams. Hardware costs continue to fall as 3-D sensing and AI chipsets integrate into mainstream point-of-sale devices. Regulatory clarity in major markets and the maturation of privacy-preserving architectures further de-risk large-scale rollouts. Collectively, these dynamics support sustained double-digit expansion for gesture recognition in the retail market through the decade.
Key Report Takeaways
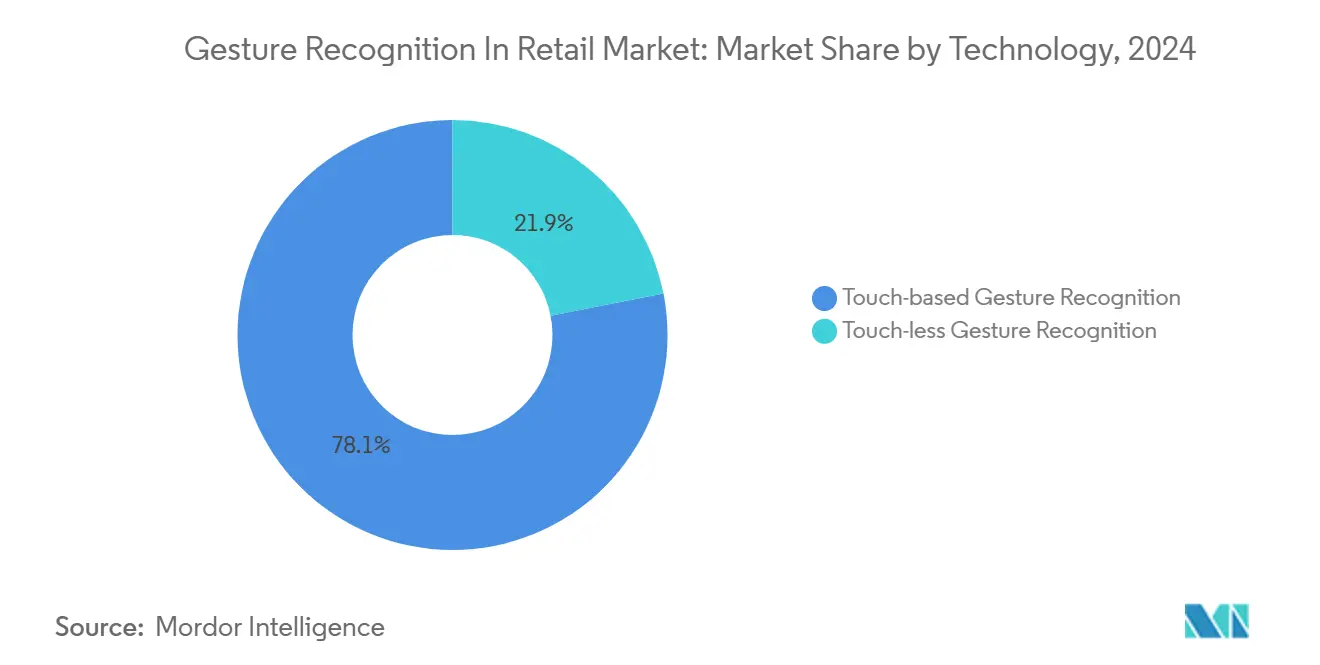
- By technology, touch-based systems held 78.1% of the gesture recognition in retail market share in 2024, whereas touch-less platforms are projected to expand at a 24.1% CAGR to 2030.
- By interaction mode, hand and finger gestures accounted for a 66.8% share of the gesture recognition in retail market size in 2024; full-body recognition is poised for a 23.4% CAGR growth through 2030.
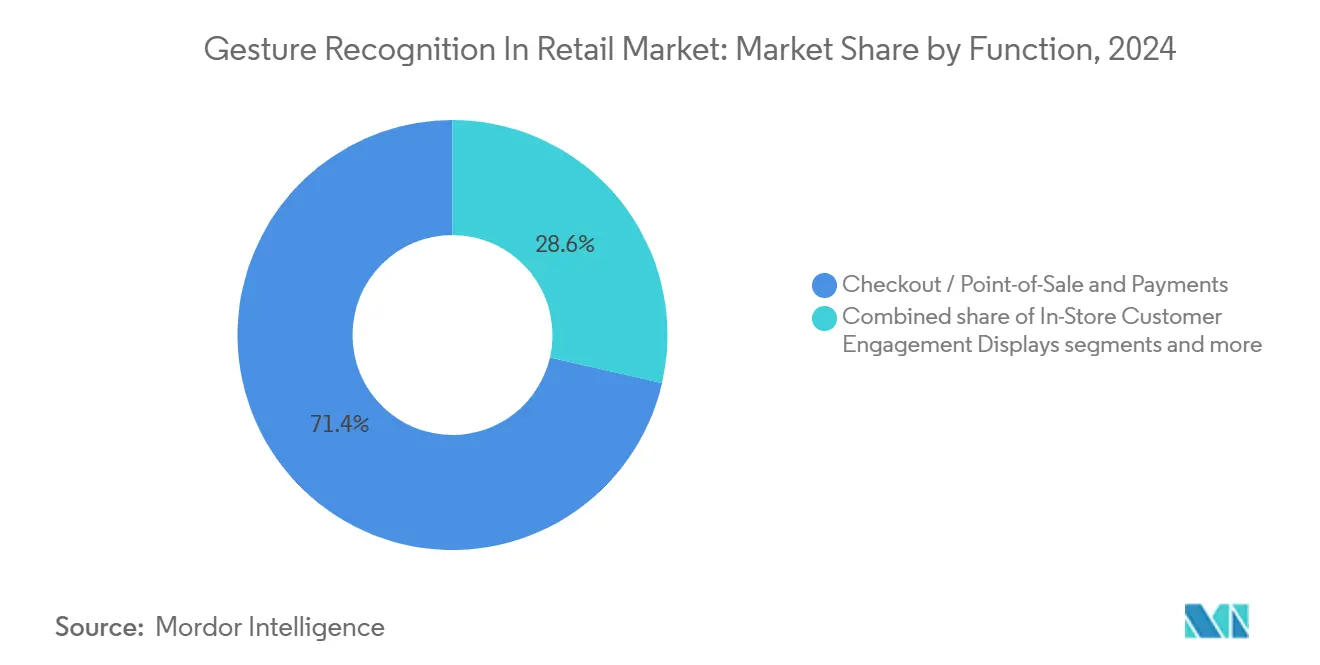
- By function, checkout and point-of-sale solutions commanded 71.4% of the gesture recognition in retail market size in 2024, while customer engagement displays are advancing at a 23.7% CAGR.
- By retail format, supermarkets and hypermarkets led with a 62.3% revenue share in 2024; apparel and department stores registered the fastest growth at a 23.0% CAGR from 2024 to 2030.
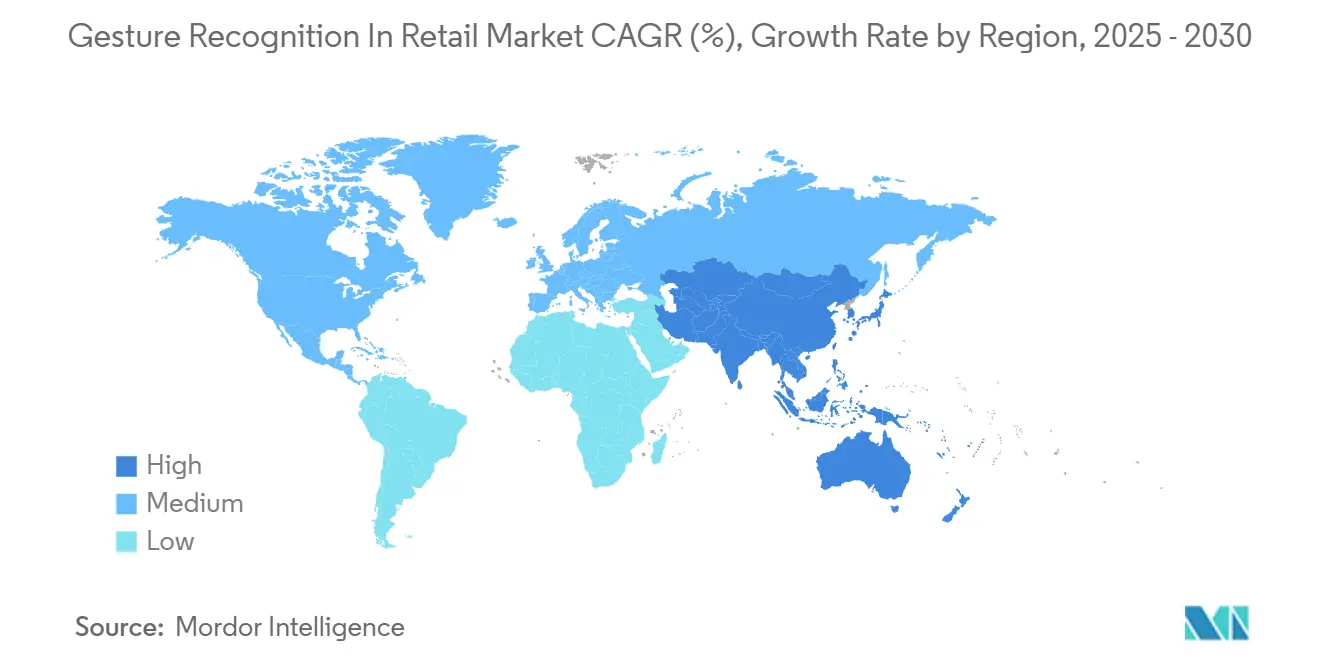
- By geography, North America captured 36.5% of the gesture recognition in retail market share in 2024, whereas Asia-Pacific registers the highest 22.8% CAGR through 2030.
Global Gesture Recognition In Retail Market Trends and Insights
Drivers Impact Analysis*
| Driver | (~) % Impact on CAGR Forecast | Geographic Relevance | Impact Timeline |
|---|---|---|---|
| Rising demand for contact-free shopping | +4.2% | Global, strongest in North America and Europe | Short term (≤ 2 years) |
| 3-D sensing and AI chips in retail devices | +3.8% | Core in Asia-Pacific, spill-over to North America and Europe | Medium term (2-4 years) |
| Smart-retail and autonomous-store expansion | +3.5% | Global, early in China, Japan, Germany | Medium term (2-4 years) |
| mm-wave & UWB radar for through-shelf use | +2.9% | North America and EU, expanding to Asia-Pacific | Long term (≥ 4 years) |
| In-aisle gesture analytics monetization | +2.1% | Developed markets | Medium term (2-4 years) |
| AR smart-glasses integration | +1.8% | North America and Europe, pilot projects in Asia-Pacific | Long term (≥ 4 years) |
| Source: Mordor Intelligence | |||
Rising Demand for Contact-Free Shopping Experiences
Pandemic-era behaviors have solidified consumer expectations for touchless journeys, and major European grocers have validated the full-scale implementation of computer-vision supermarkets, with footprints exceeding 1,000 m². Retailers report measurable reductions in average checkout times and increased customer throughput, resulting in higher basket sizes and repeat visits. Competitive pressure now pushes even mid-tier chains to evaluate gesture-enabled front-end redesigns. As more operators deploy privacy-preserving edge architectures, adoption accelerates without added cloud fees. These developments reinforce the near-term growth outlook for gesture recognition in retail market.
Increasing Penetration of 3-D Sensing and AI Chips in Retail Devices
Edge silicon now executes real-time gesture inference locally, removing bandwidth constraints and cutting latency.[2]Synaptics Inc., “Astra AI-Native Platform Overview,” synaptics.com Recent prototypes that pair 3-D depth sensors with dedicated machine-learning cores have demonstrated 99.8% gesture accuracy across 18 classes, even under variable lighting conditions. Asian OEMs leverage scale manufacturing to push unit prices below USD 20, opening access for regional grocers and convenience stores. Lower cost of ownership and ease of retrofitting existing lanes help broaden the reachable base of the gesture recognition in retail market. Joint reference designs from chip suppliers and solution integrators also reduce integration effort for retailers with limited in-house engineering talent.
Expansion of Smart-Retail and Autonomous-Store Formats
Chinese, Japanese, and European pilots have transitioned into multi-store chains that rely on gesture recognition for frictionless entry, product identification, and exit-based payment. Operators cite labor savings exceeding 30% and shrinkage reduction through real-time anomaly alerts. Brand owners participate by sponsoring interactive end-caps that respond to consumer gestures, generating incremental advertising revenue. As capex norms converge with those of traditional self-checkout lanes, autonomous formats become commercially viable for community supermarkets and travel-retail outlets, further expanding the gesture recognition in retail market footprint.
Advancements in mm-wave and UWB Radar Enabling Through-Shelf Gestures
Millimeter-wave radar now tracks hand movement through standard shelving with 95.2% precision, while preserving customer anonymity, as only motion point clouds are processed. The addition of ultra-wideband ranging enables directional pointing and spatial anchoring, allowing shoppers to pull product data onto nearby displays without needing to touch screens. Technology vendors seek patents covering radar-based interaction for premium retail fixtures, hinting at forthcoming flagship deployments. These breakthroughs unlock new zones inside aisles where optical cameras are blocked, enlarging the serviceable area of the gesture recognition in retail market.
Restraints Impact Analysis*
| Restraint | (~) % Impact on CAGR Forecast | Geographic Relevance | Impact Timeline |
|---|---|---|---|
| Algorithmic complexity in live stores | -2.8% | Global, highest in demographically diverse markets | Short term (≤ 2 years) |
| Privacy and regulatory push-back | -2.1% | Europe and North America, spreading worldwide | Medium term (2-4 years) |
| Edge-network latency at busy checkouts | -1.6% | Global, acute where connectivity is limited | Short term (≤ 2 years) |
| Electromagnetic interference from dense IoT | -1.2% | North America and Europe, extending to Asia-Pacific metros | Medium term (2-4 years) |
| Source: Mordor Intelligence | |||
Algorithmic Complexity and Accuracy Variance in Live-Store Environments
Retail settings introduce occlusions, reflective surfaces, and crowd density, which reduce gesture accuracy compared to lab results, particularly for customers carrying bags or wearing gloves. Bias across age groups and body mobility persists in computer-vision models, raising concerns about inclusion. Continuous re-training regimes and larger annotated data sets drive deployment costs upward. Merchants must tune sensor layouts per store to maintain acceptable performance, which complicates multi-format rollouts. Until middleware platforms abstract this complexity, some chains remain cautious, tempering the short-term expansion of gesture recognition in retail market.
Privacy and Regulatory Push-Back on Continuous Vision Tracking
Europe’s AI Act bans the inference of emotions in workplaces, directly affecting camera-based analytics that track dwell time or facial expressions. United States state-level biometric statutes add consent requirements and introduce significant statutory penalties. Retailers, therefore, shift toward on-device processing and federated-learning architectures that avoid raw image transmission. Implementation of these safeguards raises capex by double-digit percentages and may delay procurement cycles, dampening near-term growth for gesture recognition in retail market.
*Our forecasts treat driver/restraint impacts as directional, not additive. The impact forecasts reflect baseline growth, mix effects, and variable interactions.
Segment Analysis
By Technology: Touch-less Innovation Accelerates Despite Touch-Based Dominance
Touch-based platforms represented 78.1% of the gesture recognition in retail market share in 2024 as retailers favored proven systems bolted onto legacy lanes. Even so, the touchless segment is set to record a 24.1% CAGR through 2030, underscoring a shift toward hygienic and seamlessly integrated store journeys. Pilots by big-box clubs that clear members via camera recognition at exits illustrate how touchless can replace manual receipt checks. Hardware vendors now integrate radar sensors alongside RGB-D cameras, trimming the bill of materials and closing the precision gap that once favored touch-based panels. As deployment confidence rises, the gesture recognition in retail market size tied to touch-less offerings is projected to exceed USD 3 billion by 2030, doubling its 2024 base.
Retailers are increasingly viewing touchless gesture recognition as a brand differentiator that elevates the experience, especially in high-margin segments such as luxury fashion and consumer electronics showrooms. Meanwhile, touch-based platforms remain relevant for use cases that demand pinpoint accuracy, such as signature capture or build-to-order kiosks. Those dual pathways indicate a coexistence model rather than outright substitution, allowing suppliers to position modular solutions that scale with client needs. Continued iterations of neural processing units will likely lower latency to sub-30 milliseconds, preserving intuitive interactions and encouraging further penetration of the gesture recognition in retail market.


By Interaction Mode: Full-Body Recognition Emerges as Growth Engine
Hand and finger inputs dominated, accounting for 66.8% of the gesture recognition in retail market size in 2024, thanks to consumers already conditioned by smartphones. Full-body systems, however, are projected to register a 23.4% CAGR to 2030, as faster GPUs in edge boxes decode skeletal movement for immersive display walls and aisle-level analytics. Head-centric micro-gestures found early adoption in convenience stores and petrol marts where hands are busy handling goods. Research prototypes combining voice and gesture score higher for intent accuracy, implying a multimodal trajectory for the gesture recognition in retail market.
Wearable bands that detect neural or muscle signals introduce an additional interaction layer for differently abled shoppers, thereby broadening accessibility. Retailers use full-body heat maps to pinpoint hotspots and redesign aisles, demonstrating that gesture data can unlock operations value beyond front-end checkout. The expanding use-case set underscores why the gesture recognition in retail industry continues to invest in advanced pose estimation algorithms despite the higher compute requirement.
By Function: Customer Engagement Displays Drive Innovation Beyond Checkout
Checkout solutions retained 71.4% share of the gesture recognition in retail market size in 2024 because the ROI from faster transactions and reduced staffing resonates universally. Yet, interactive engagement displays advance at a 23.7% CAGR as merchants discover that revenue per square foot increases when shoppers receive personalized offers triggered by gestures.[3]Intel Corporation, “Edge AI Vision Accelerates Retail Innovation,” intel.com Hands-free inventory screens in back-of-house settings streamline cycle counts, a boon for foodservice and pharmacy formats where hygiene rules restrict touch.
Marketing departments now own budgets for in-aisle kiosks that recommend related products when a shopper pauses. Analytics generated from these encounters feeds into dynamic planogram revisions, tightening replenishment cycles. By moving beyond payment, the gesture recognition in retail market taps budget pools previously unavailable to point-of-sale vendors, diversifying revenue streams across the retail organization.
By Retail Format: Department Stores Lead Digital Transformation
Supermarkets and hypermarkets captured 62.3% of 2024 revenue due to the widespread deployment of autonomous checkout systems, but growth moderates as penetration levels approach a plateau in developed economies. Department and apparel stores are projected to log the fastest 23.0% CAGR to 2030, driven by virtual try-on mirrors and gesture-controlled thematic windows that integrate online and in-store brand storytelling. Convenience players exploit unmanned micro-store blueprints for transport hubs where 24-hour availability outweighs capex.
Luxury boutiques deploy gesture-guided product journeys that replace staffed counters, freeing associates to focus on high-value consultations. Specialty jewelers integrate controlled gestures for secure cabinet access, enhancing both experience and shrink mitigation. These varied roll-outs illustrate how widening retail format coverage underpins sustained expansion of the gesture recognition in retail market.
Geography Analysis
North America, with a 36.5% share of the gesture recognition in retail market size in 2024, benefits from early adopter big-box chains and a comparatively permissive biometric regime. Federal guidelines remain less restrictive than Europe’s, enabling chain-wide pilots that rapidly scale when ROI is proven. Over 500 grocery sites now run camera-only exit checkout, reinforcing the region’s leadership.
The Asia-Pacific region posts the highest 22.8% CAGR through 2030, as Chinese payment ecosystems and Japanese unmanned formats integrate gesture recognition into end-to-end store automation. Government retail-digitization grants lower upfront cost barriers, while consumers show strong acceptance of biometric processes. Local hardware manufacturing density shortens supply chains and accelerates iteration cycles, further catalyzing uptake.
Europe follows with privacy-compliant architectures that integrate edge processing and encrypted cloud synchronization to meet the requirements of the EU AI Act. Multinational grocers are testing gesture-enabled mega-stores across Germany, France, and the Nordics, providing blueprints for pan-European roll-outs. Emerging regions in Latin America and the Middle East start from smaller bases but see double-digit adoption as global vendors introduce turnkey packages targeted at mid-sized supermarket groups. This cascade effect supports a geographically diversified enlargement of the gesture recognition in retail market.

Competitive Landscape
The gesture recognition in retail market features moderate fragmentation. Technology majors such as Apple, Google, Microsoft, and Intel combine vast research and development spend with integrated hardware-software stacks. These incumbents leverage patent portfolios to secure platform stickiness, for instance, Google’s electrical-impedance hand reconstruction patent that could embed gesture input into everyday devices.
Specialist challengers fill niche gaps: Veesion applies skeletal analysis to real-time loss-prevention use cases and recently raised EUR 53 million (USD 61.01 million) to speed global expansion. PreAct’s acquisition of Gestoos fused flash LiDAR with gesture models, sharpening object-level recognition for shelf interactions. Cross-industry alliances are growing as retailers demand turnkey bundles; Synaptics’ USD 198 million acquisition of a Broadcom wireless unit bolsters edge connectivity that underpins gesture data backhaul.
Price pressure intensifies at the mid-market where commoditized sensors meet open-source inference engines. Vendors differentiate via compliance toolkits that audit datasets and enable federated retraining to satisfy privacy statutes. White-label platforms are gaining ground among regional system integrators who localize user interfaces and language models, thereby expanding the overall addressable base of the retail market for gesture recognition.
Gesture Recognition In Retail Industry Leaders
Apple Inc.
Cognitec Systems GmbH
Google LLC
Infineon Technologies AG
Sony Corporation
- *Disclaimer: Major Players sorted in no particular order

Recent Industry Developments
- June 2025: FairPrice Group launched “Store of Tomorrow” with Google Cloud to roll out smart carts featuring AI-guided navigation and gesture-driven recommendations.
- May 2025: Veesion secured EUR 53 million (USD 61.01 million) to advance gesture-based shoplifting prevention analytics.
- May 2025: AVITA and Fainders.AI began Japan-Korea collaboration on avatar-assisted unmanned stores leveraging vision AI for gesture interaction.
- March 2025: Kende Retail Operation and Coca-Cola HBC opened Hungary’s first autonomous convenience store using computer-vision cart tracking.


Global Gesture Recognition In Retail Market Report Scope
The Gesture Recognition in Retail Market Report is Segmented by Technology (Touch-Based Gesture Recognition and Touch-less Gesture Recognition), Interaction Mode (Hand and Finger Gestures, Head / Nod Gestures, Full-Body Gestures, and Multimodal (Gesture and Voice)), Function (In-Store Customer Engagement Displays, Checkout / Point-of-Sale and Payments, and Store Operations, Inventory and Analytics), Retail Format (Supermarkets and Hypermarkets, Convenience Stores, Apparel and Department Stores, and Specialty Retailers), and Geography (North America, Europe, Asia Pacific, South America, and Middle East and Africa). The Market Forecasts are Provided in Terms of Value (USD).
| Touch-based Gesture Recognition |
| Touch-less Gesture Recognition |
| Hand and Finger Gestures |
| Head / Nod Gestures |
| Full-Body Gestures |
| Multimodal (Gesture and Voice) |
| In-Store Customer Engagement Displays |
| Checkout / Point-of-Sale and Payments |
| Store Operations, Inventory and Analytics |
| Supermarkets and Hypermarkets |
| Convenience Stores |
| Apparel and Department Stores |
| Specialty Retailers |
| North America | United States | |
| Canada | ||
| Mexico | ||
| Europe | Germany | |
| United Kingdom | ||
| France | ||
| Italy | ||
| Spain | ||
| Rest of Europe | ||
| Asia-Pacific | China | |
| Japan | ||
| India | ||
| South Korea | ||
| Australia | ||
| Rest of Asia-Pacific | ||
| South America | Brazil | |
| Argentina | ||
| Rest of South America | ||
| Middle East and Africa | Middle East | Saudi Arabia |
| United Arab Emirates | ||
| Turkey | ||
| Rest of Middle East | ||
| Africa | South Africa | |
| Egypt | ||
| Nigeria | ||
| Rest of Africa | ||
| By Technology | Touch-based Gesture Recognition | ||
| Touch-less Gesture Recognition | |||
| By Interaction Mode | Hand and Finger Gestures | ||
| Head / Nod Gestures | |||
| Full-Body Gestures | |||
| Multimodal (Gesture and Voice) | |||
| By Function | In-Store Customer Engagement Displays | ||
| Checkout / Point-of-Sale and Payments | |||
| Store Operations, Inventory and Analytics | |||
| By Retail Format | Supermarkets and Hypermarkets | ||
| Convenience Stores | |||
| Apparel and Department Stores | |||
| Specialty Retailers | |||
| Geography | North America | United States | |
| Canada | |||
| Mexico | |||
| Europe | Germany | ||
| United Kingdom | |||
| France | |||
| Italy | |||
| Spain | |||
| Rest of Europe | |||
| Asia-Pacific | China | ||
| Japan | |||
| India | |||
| South Korea | |||
| Australia | |||
| Rest of Asia-Pacific | |||
| South America | Brazil | ||
| Argentina | |||
| Rest of South America | |||
| Middle East and Africa | Middle East | Saudi Arabia | |
| United Arab Emirates | |||
| Turkey | |||
| Rest of Middle East | |||
| Africa | South Africa | ||
| Egypt | |||
| Nigeria | |||
| Rest of Africa | |||


Key Questions Answered in the Report
What is the current size of the gesture recognition in retail market?
The gesture recognition in retail market size is USD 3.06 billion in 2025 and is forecast to grow to USD 8.40 billion by 2030.
Which technology segment is growing fastest?
Touch-less gesture platforms post the strongest 24.1% CAGR as retailers prioritize contact-free journeys.
Which retail format leads adoption?
Supermarkets and hypermarkets hold 62.3% of 2024 revenue owing to extensive autonomous checkout deployments.
Why is Asia-Pacific witnessing the highest growth rate?
Aggressive roll-outs of contactless payment systems, supportive digitalization policies, and domestic sensor manufacturing push Asia-Pacific to a 22.8% CAGR.
What are the main restraints on wider deployment?
Algorithmic accuracy in crowded stores and tightening biometric privacy regulations in Europe and North America are the two largest headwinds.
How fragmented is the competitive landscape?
No single vendor exceeds 10% share, and the top five combined hold under 30%, indicating a low-concentration market with significant room for new entrants.
Page last updated on:


