
Market Overview
| Study Period | 2020 - 2031 |
|---|---|
| Market Size (2026) | USD 31.07 Billion |
| Market Size (2031) | USD 47.23 Billion |
| Growth Rate (2026 - 2031) | 8.74 % |
| Fastest Growing Market | Asia-Pacific |
| Largest Market | Asia Pacific |
| Market Concentration | Medium |
Major Players *Disclaimer: Major Players sorted in no particular order Image © Mordor Intelligence. Reuse requires attribution under CC BY 4.0. | |
Professional Cloud Services Market Analysis by Mordor Intelligence
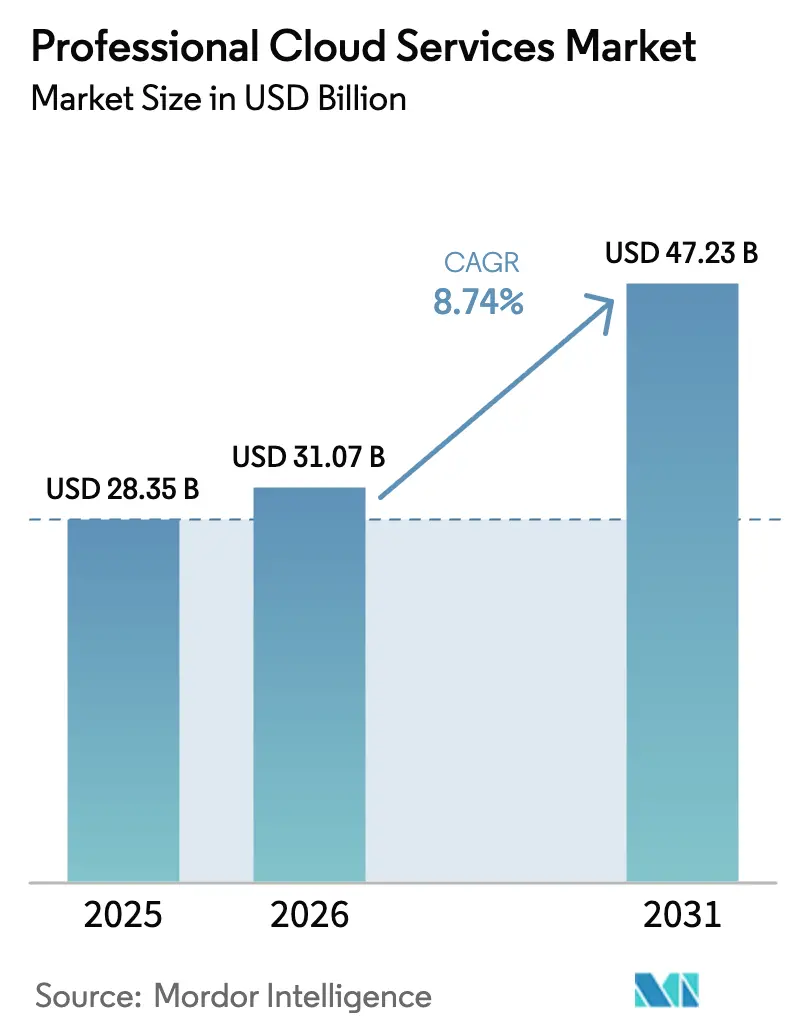
The Professional Cloud Services Market size is estimated at USD 31.07 billion in 2026, and is expected to reach USD 47.23 billion by 2031, at a CAGR of 8.74% during the forecast period (2026-2031). This growth reflects a steady shift away from capital-intensive on-premises infrastructure and toward consumption-based models that enable enterprises to match operating expenditures with business outcomes. Price-performance gains unlocked by custom silicon, rising demand for generative artificial intelligence (AI) workloads, and expanding sovereign-cloud mandates are widening the addressable customer base that views elastic compute and storage as strategic enablers rather than experimental pilots. Vendors are localizing data residency to comply with national regulations even as they scale globally, while edge computing is redefining the perimeter of the cloud services market by linking hyperscaler regions to factory floors and retail outlets. Competitive intensity continues to rise as hyperscalers vertically integrate into networking, security, and application layers, pressuring the margins of independent software vendors and system integrators, and prompting a shift to outcome-based contracts that tie fees to client business metrics.
Key Report Takeaways
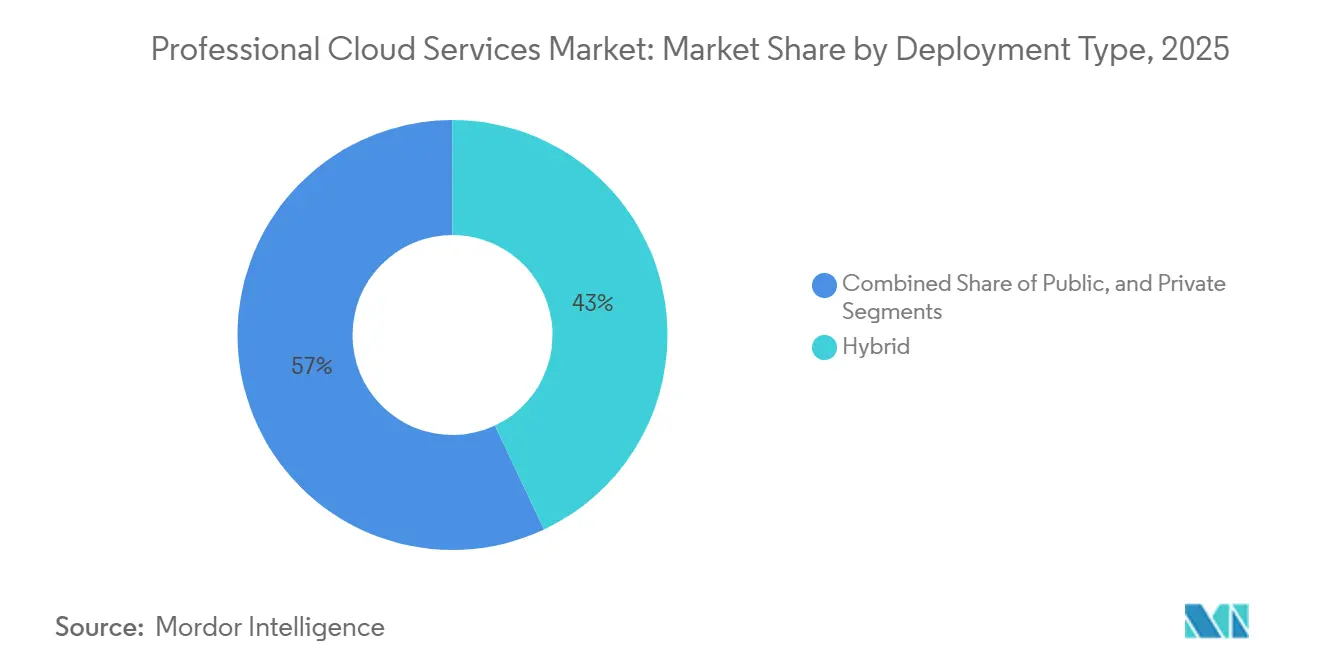
- By deployment type, hybrid configurations held 43% of the cloud services market share in 2025, while public cloud is set to register the fastest 9.02% CAGR through 2031.
- By service model, Infrastructure as a Service accounted for 35% of the cloud services market in 2025, whereas Software as a Service is forecast to grow at a 9.31% CAGR through 2031.
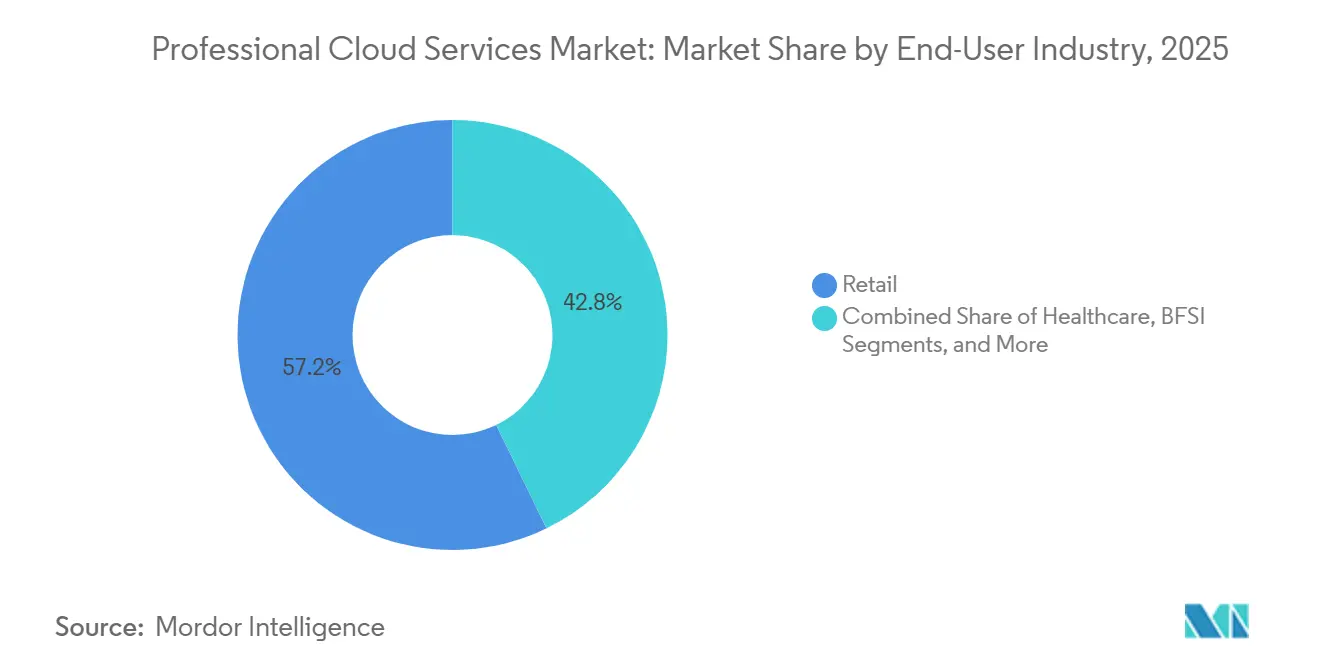
- By end-user industry, retail led with 57.2% revenue share in 2025, and healthcare is advancing at the highest 10.09% CAGR through 2031.
- By organization size, large enterprises captured 55.1% of 2025 spending, yet small and medium enterprises are projected to expand at a 10.54% CAGR over the forecast period.
- By geography, Asia-Pacific commanded 28.3% of 2025 revenue while registering the highest 8.93% CAGR through 2031.
Note: Market size and forecast figures in this report are generated using Mordor Intelligence’s proprietary estimation framework, updated with the latest available data and insights as of January 2026.
Global Professional Cloud Services Market Trends and Insights
Drivers Impact Analysis*
| Driver | (~) % Impact on CAGR Forecast | Geographic Relevance | Impact Timeline |
|---|---|---|---|
| Hyperscaler Price-Performance Gains | +1.6% | Global, strongest in North America and Asia-Pacific | Medium term (2-4 years) |
| Generative AI Workload Surge | +1.9% | Global, concentrated in North America, Europe, and China | Short term (≤ 2 years) |
| Sovereign-Cloud Mandates | +1.3% | Europe and Asia-Pacific, spill-over to Middle East | Medium term (2-4 years) |
| Edge-to-Cloud Integration | +1.1% | Global, early gains in Asia-Pacific and Europe manufacturing hubs | Medium term (2-4 years) |
| Shift to Outcome-Based Contracts | +1.1% | North America and Europe, early adoption in Asia-Pacific | Long term (≥ 4 years) |
| Cloud FinOps Tools | +1.0% | Global, strongest in multi-cloud enterprises | Short term (≤ 2 years) |
| Source: Mordor Intelligence | |||
Hyperscaler Price-Performance Gains Accelerate Cloud Migration
Custom silicon is reducing compute cost per transaction by roughly one-third, encouraging enterprises to move even batch workloads into public regions. AWS Graviton4, Azure Maia 100, and Google Cloud TPU v5 all launched in 2024-2025, improving performance while lowering total monthly bills and cutting the payback period for migrations from three years to under 18 months.[1]Amazon Web Services, “AWS Graviton4 Processors,” aws.amazon.com Price visibility and quicker returns are expanding the professional cloud services market among cost-sensitive verticals, such as manufacturing and logistics, where cloud adoption has historically lagged.
Generative AI Workload Surge Demands Specialized Cloud Expertise
Training and inference for large language models require high-bandwidth networking, low-latency storage, and elastic clusters that most corporate data centers cannot supply. OpenAI’s GPT-4 consumed about 25,000 GPUs in 2024, while Anthropic’s Claude 3 added multimodal inputs in 2025, driving enterprises toward turnkey platforms that bundle vector databases, prompt-engineering tools, and managed model hosting. Integrators capable of orchestrating these stacks are commanding premium consulting rates, adding momentum to the professional cloud services market.
Sovereign-Cloud Mandates Fragment Global Scale
Data-localization laws such as the European Union Data Act and India’s Digital Personal Data Protection Act force hyperscalers to operate region-specific infrastructure and governance frameworks. AWS launched dedicated Local Zones in Germany, France, and Italy in 2025, and Microsoft committed USD 3 billion to add regions in Chennai and Hyderabad by 2027. These investments create compliance-bound enclaves that expand the professional cloud services market but raise capital requirements and architectural complexity for providers.
Edge-to-Cloud Integration Enables Low-Latency Applications
Factory automation, retail checkout, and connected-vehicle scenarios need sub-10-millisecond response times. Vendors are pairing regional data centers with micro-edge locations to orchestrate workloads across the continuum, enabling autonomous robots, real-time pricing engines, and predictive maintenance solutions. Vapor IO’s edge-colocation sites in 36 U.S. metros by 2025 illustrate how distributed footprints are becoming critical extensions of the professional cloud services market.
Restraints Impact Analysis*
| Restraint | (~) % Impact on CAGR Forecast | Geographic Relevance | Impact Timeline |
|---|---|---|---|
| Talent Shortage in Advanced Specializations | -1.1% | Global, most acute in North America and Europe | Medium term (2-4 years) |
| Escalating Egress and Inter-Cloud Transfer Costs | -0.9% | Global, disproportionately affecting multi-cloud adopters | Short term (≤ 2 years) |
| Fragmented Regional Compliance Frameworks | -0.8% | Europe, Asia-Pacific, and Middle East | Long term (≥ 4 years) |
| Inflation-Driven Opex Scrutiny in SMEs | -0.7% | Global, centered in South America, Africa, Southeast Asia | Short term (≤ 2 years) |
| Source: Mordor Intelligence | |||
Talent Shortage in Advanced Cloud Specializations
While demand for cloud FinOps engineers rose 85% year-over-year in 2025, supply grew only 22%, creating a structural skills gap and inflating salaries for multi-cloud architects above USD 200,000 in North America. Enterprises struggling to recruit talent rely heavily on external consultants, adding cost and stretching project timelines across the professional cloud services market.
Escalating Egress and Inter-Cloud Transfer Costs
Hyperscalers charge up to USD 0.09 per gigabyte for data leaving their networks, which can push egress fees to as much as one-quarter of total cloud spend for multi-cloud users. Moving 100 terabytes from AWS to Azure incurs approximately USD 9,000 in egress costs alone, discouraging portability and increasing vendor lock-in.[2]Cloud Infrastructure Services Providers in Europe, “Egress Fees and Cloud Market Competition,” cispe.cloud These economics temper the pace of workload re-platforming within the professional cloud services market.
*Our forecasts treat driver/restraint impacts as directional, not additive. The impact forecasts reflect baseline growth, mix effects, and variable interactions.
Segment Analysis
By Deployment Type: Hybrid Configurations Anchor Enterprise Strategies
Hybrid deployments accounted for 43% of 2025 revenue, underscoring enterprises’ wish to preserve existing capital investments while tapping public elasticity. Public cloud, however, is poised to advance at a 9.02% CAGR, the fastest within the professional cloud services market, as cost transparency and variable pricing attract new adopters. Private cloud retains traction in strictly regulated sectors such as banking and government, though its share is slowly eroding thanks to isolated tenancy options offered by hyperscalers.
Kubernetes is leveling the differences among deployment models by making workloads portable. In 2025 the Cloud Native Computing Foundation reported that 78% of enterprises ran Kubernetes in production, leading firms to shift applications between private and public clouds based on cost and performance considerations. This portability is commoditizing infrastructure and pushing competition into higher-value services like managed databases and AI platforms, elements now decisive in the professional cloud services market.



By Service Model: SaaS Embeds Industry Workflows
Infrastructure as a Service held 35% of the market share in 2025 because compute-intensive workloads still need granular control. Software as a Service is expected to grow the fastest, at a 9.31% CAGR, as vendors package industry workflows into pre-integrated suites, shortening deployment from months to weeks. Salesforce, Microsoft Dynamics, and Oracle Fusion now embed generative AI features, delivering outcomes without clients managing the underlying infrastructure.
The rise of AI is redrawing service-model boundaries. Training requires IaaS-level GPU clusters, whereas deployment favors SaaS offerings that bundle pre-trained models. OpenAI’s ChatGPT Enterprise illustrates this duality by providing turnkey conversational AI while delegating infrastructure concerns to hyperscalers. As the professional cloud services market matures, vendors that combine stack depth with vertical functionality are best positioned for sustained growth.
By End-User Industry: Retail Dominates, Healthcare Accelerates
Retail accounted for 57.2% of spending in 2025, driven by omnichannel personalization, inventory optimization, and real-time fraud detection. Healthcare is forecast to post the highest 10.09% CAGR as regulatory clarity around patient data encourages migration to cloud-hosted electronic health records. Walmart reported a 12% reduction in out-of-stock incidents after modernizing its inventory system, translating to roughly USD 1.5 billion in incremental sales. Similar success stories fuel confidence in the professional cloud services market across consumer-facing sectors.
Healthcare momentum is reinforcing cloud’s accreditation as mission-critical infrastructure. Epic Systems’ decision to offer its platform on AWS and Azure gave hundreds of hospital networks a compliant path to SaaS delivery. As telemedicine and AI-driven diagnostics become standard, healthcare’s share of the professional cloud services market is set to expand rapidly.
By Organization Size: SMEs Embrace Pay-Per-Use Models
Large enterprises accounted for 55.1% of revenue in 2025, reflecting sizable IT budgets and legacy workloads. Small and medium enterprises, however, are on course for a 10.54% CAGR because pay-per-use pricing removes upfront capital hurdles. Shopify hosted 2.5 million active merchants in 2025, most of them SMEs who relied on its SaaS platform to handle commerce tasks without hiring IT staff. Currency volatility and inflation slow uptake in some regions, yet digital commerce trends continue to draw SMEs into the professional cloud services market.
Large organizations are moving from lift-and-shift migrations to cloud-native rebuilds. JPMorgan Chase aims to have 70% of its applications on cloud platforms by 2027, targeting annual savings of USD 1.2 billion. Consulting and managed-service providers that can guide these complex journeys occupy a pivotal role across the professional cloud services market size spectrum.
Geography Analysis
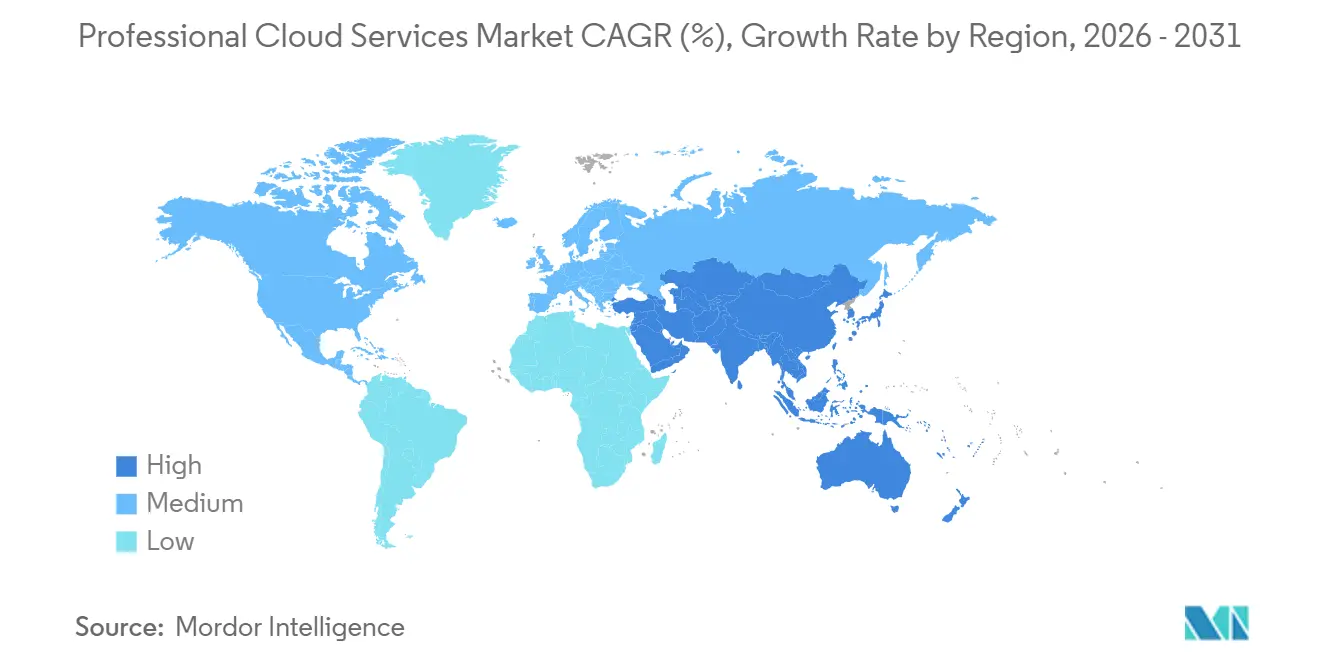
Asia-Pacific held 28.3% of the professional cloud services market share in 2025 and is projected to rise at an 8.93% CAGR through 2031. Digital-transformation mandates in India, Indonesia, and Vietnam, together with China’s drive for domestic hyperscaler dominance, are widening regional demand. India’s Digital India initiative earmarked USD 10 billion for public cloud procurement, anchoring adoption that spills over into private enterprise.
North America remains a major market, but growth is moderating as enterprises optimize existing estates rather than migrate new workloads. In the United States, the FedRAMP program’s rigorous certification timeline limits the number of authorized providers, slowing federal-sector expansion. Canada’s Personal Information Protection and Electronic Documents Act steers enterprises toward local data centers, but cross-border collaboration tools still benefit from hyperscaler footprints.
Europe’s sovereign-cloud ambitions, led by Gaia-X and national data-localization policies, are fragmenting the regional market. AWS introduced its European Sovereign Cloud in 2025 to address local compliance demands, while French and German strategies privilege domestic providers, raising costs and narrowing service breadth. The United Kingdom adopted a more pragmatic stance, allowing hyperscaler participation provided security standards are met.
The Middle East and Africa are following a public-sector-first trajectory. Saudi Arabia’s Vision 2030 allocated USD 6.4 billion to digital infrastructure, triggering partnerships that bring hyperscaler regions into the kingdom. The United Arab Emirates and South Africa enforce data-protection laws that steer sensitive workloads to in-country data centers. Across Africa, Nigeria’s 2024 cloud guidelines signal government willingness to lead by example.
South America’s outlook is mixed. Currency depreciation in Brazil and triple-digit inflation in Argentina raise the cost of dollar-denominated services, slowing near-term adoption. Nonetheless, e-commerce expansion and fintech innovation underpin a gradual increase in regional professional cloud services market penetration.

Regulatory Landscape
Regulation is increasingly shaped by data sovereignty and AI governance requirements, which influence where workloads run and how professional cloud services are delivered and documented. In the European Union, the AI Act adds compliance duties for providers and deployers of AI systems, with enforcement powers taking effect on 2 August 2026, raising the bar for transparency and controls around high-risk and general-purpose AI used in cloud-delivered services.
Cross-border market access is also being influenced by procurement and assurance schemes that favor in-country infrastructure and operations. The US Government Accountability Office (GAO) noted in June 2026 that the Federal Acquisition Regulation (FAR) still lacks a formal definition of cloud computing despite amendments in 2025, complicating consistent procurement requirements. At the country level, South Korea's Cloud Security Assurance Program (CSAP) and Colombia's June 2025 Resolution 372 reinforce localization incentives by linking eligibility or scoring to local data centers, domestic operations, and approved security controls, shaping delivery models for global providers and their integration partners.
Value Chain Analysis
The value chain covers hyperscalers and regional cloud providers across infrastructure and platform layers, system integrators and managed service providers focused on migration, modernization, and operations, independent software vendors providing SaaS and cloud-native tools, and enterprise customers consuming bundled AI, security, and FinOps capabilities. Upstream inputs center on data center capacity (land, power, cooling), specialized hardware (GPUs, high-bandwidth networking), and software foundations (Kubernetes, observability, security tooling), while downstream activities include solution design, data migration, application refactoring, governance, and ongoing managed operations tied to outcome-based contracts.
Physical infrastructure constraints are a key linkage across the chain, especially for AI-heavy workloads that drive high-density deployments. As of early-to-mid 2026, industry reporting highlighted power equipment and grid access as gating factors, with high-voltage transformer lead times reaching 115 to 140 weeks and grid connection queues stretching multiple years in some markets, delaying data center energization and, in turn, professional services project timelines. At the same time, ecosystem partnerships that bundle platform software with regional compute show how providers package vertically integrated delivery, including T-Systems commissioning a Munich-based Industrial AI Cloud facility (10,000 NVIDIA Blackwell GPUs) and then partnering with SupplyOn in June 2026 to integrate supply chain applications into that cloud environment for procurement, logistics, and supplier management automation.
Competitive Landscape
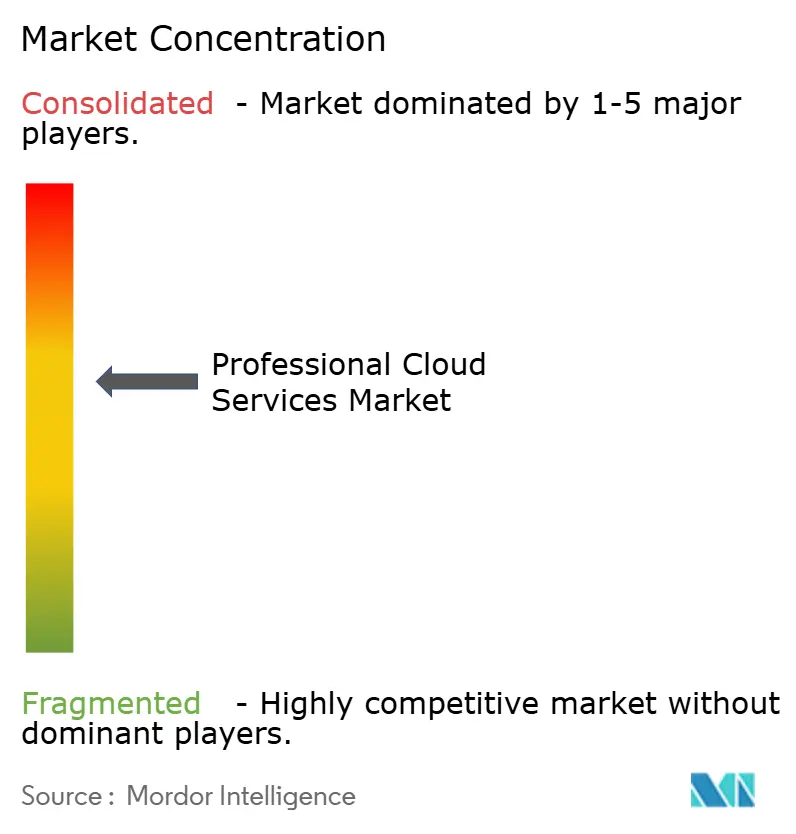
The professional cloud services market exhibits moderate concentration: Amazon Web Services, Microsoft Azure, and Google Cloud collectively hold about 65% of global infrastructure and platform revenue. Hyperscalers are integrating vertically into networking, security, and applications, compressing margins for independent software and system-integration firms. AWS’s acquisition of secure-messaging firm Wickr and Microsoft’s purchase of Activision Blizzard illustrate moves to capture workloads at the content and collaboration layers.
System integrators, such as Accenture, Tata Consultancy Services, and Capgemini, are pivoting to outcome-based contracts that tie fees to client business metrics, thereby securing recurring revenue and sharing risk. Accenture disclosed that 15% of its 2025 cloud revenue came from such agreements, a trend likely to reshape partner ecosystems across the cloud services industry.
Niche providers are finding success in edge, sovereign, and FinOps niches. Vapor IO offers edge colocation for latency-sensitive applications. Oracle has introduced Sovereign Regions for governments, and FinOps platforms, such as CloudHealth, help enterprises cut cloud spending by up to 30%, indirectly slowing hyperscaler top-line expansion.[3]Oracle Corporation, “Oracle Cloud Infrastructure Sovereign Regions,” oracle.com Open-source standards like Kubernetes and OpenStack are reducing switching costs, while regulators in the European Union and the United States scrutinize egress fees and bundling, signaling possible policy shifts that could further rebalance power in the professional cloud services market.
Professional Cloud Services Industry Leaders
Accenture plc
Amazon Web Services, Inc.
Microsoft Corporation
IBM Corporation
Tata Consultancy Services Limited
- *Disclaimer: Major Players sorted in no particular order

Market Opportunities and Future Outlook
A major whitespace is forming around AI-ready, compliant cloud delivery that combines infrastructure planning (power, cooling, GPU clusters) with migration, security, and operations expertise, as capacity constraints and sovereignty rules increase execution complexity for customers. Amazon's March 2026 signal to increase its Spain investment to EUR 33.7 billion to expand data center infrastructure in Aragon (including AI/ML capabilities) and the International Finance Corporation's June 2026 financing package with Sify to develop 103 MW of AI-ready, green-certified data center capacity in Navi Mumbai and Chennai create pull-through demand for professional services across site-to-cloud architectures, regulated data residency setups, and production-grade MLOps stacks.
A second opportunity area is sovereign and industry-specific platforms where providers and integrators can capture longer-lived managed services revenue through localized control planes, procurement compliance, and sector templates. In India, Microsoft publicly committed USD 3 billion to add Azure regions in Chennai and Hyderabad by 2027, while HCLTech announced in July 2026 a planned investment of INR 3,500 crore to build a 50 MW full-stack facility positioned for sovereign AI use cases. Beyond these capacity and localization programs, multi-cloud economics and governance pain points such as egress and inter-cloud transfer costs continue to surface, supporting service-led offerings including FinOps, workload placement optimization, and contract structures that tie modernization fees to measurable business outcomes rather than one-time migration milestones.
Recent Industry Developments
- July 2026: HCLTech announced entry into the sovereign AI data center segment with a planned investment of INR 3,500 crore to build a 50 MW full-stack facility in India. The move adds a new supply-side player to AI-ready infrastructure buildout and expands the addressable partner ecosystem for cloud modernization, managed services, and compliance-led delivery in a major data-residency market.
- June 2026: Nokia and Amazon Web Services expanded their collaboration to run Nokia's Autonomous Network Fabric on AWS, targeting Level 4 network autonomy for telecom operators. This strengthens hyperscaler-led delivery of cloud-native networking and automation, creating additional implementation and managed-operations scope for professional cloud services providers supporting telco transformation programs.
- March 2026: Amazon announced an additional EUR 18 billion investment in Spain, bringing its planned total to EUR 33.7 billion to expand data center infrastructure in Aragon, including AI/ML capabilities and associated operations. The expansion increases regional capacity and creates downstream demand for migration, security, and application modernization services tied to new cloud regions and localized workloads.


Research Methodology Framework and Report Scope
Market Definition and Coverage
This market covers paid services delivered by external providers to help organizations plan, migrate, implement, integrate, and optimize cloud environments across public, private, and hybrid setups.
Scope exclusions: We exclude the cloud infrastructure or software subscription value itself, and we also exclude standalone telecom connectivity and pure hardware resale.
Segmentation Overview
- By Type of Deployment
- Public
- Private
- Hybrid
- By Service Model
- Software as a Service (SaaS)
- Platform as a Service (PaaS)
- Infrastructure as a Service (IaaS)
- By End-User Industry
- Government and Public Sector
- Healthcare
- Banking, Finance, Services and Insurance (BFSI)
- Retail
- IT and Telecommunications
- Media and Entertainment
- Other End-User Industries
- By Organization Size
- Large Enterprises
- Small and Medium Enterprises
- By Geography
- North America
- United States
- Canada
- Mexico
- South America
- Brazil
- Argentina
- Rest of South America
- Europe
- United Kingdom
- Germany
- France
- Italy
- Spain
- Russia
- Rest of Europe
- Asia-Pacific
- China
- Japan
- India
- South Korea
- Australia
- Rest of Asia-Pacific
- Middle East
- Saudi Arabia
- United Arab Emirates
- Turkey
- Rest of Middle East
- Africa
- South Africa
- Nigeria
- Egypt
- Rest of Africa
- North America
Data Sources, Market Sizing, and Validation
Desk Research
Desk research was used to set the outer guardrails for demand and spending, before assumptions were tested in interviews. We reviewed public sources such as IT spending releases from the World Bank and OECD, digital economy and cloud policy publications from ITU, cybersecurity and cloud guidance from NIST, and technical adoption signals from NIST and ISO aligned standards documents and peer-reviewed journals.
To make the model practical for professional cloud services, we also used company filings, annual reports, investor presentations, and reputable press coverage to understand shifts in service mix (for example, more advisory versus deployment) and delivery capacity changes over time. In parallel, we referenced paid subscriptions that provide company financials and market intelligence, plus patent databases to track where cloud migration and modernization work is concentrating. These desk sources are not exhaustive, and additional public and paid references were used for data collection, validation, and clarification.
Primary Interviews and Surveys
Primary work focused on validating what portion of cloud adoption spending is captured as professional services revenue, and how pricing moves when delivery models change (for example, staffing intensity and delivery location). We spoke with a mix of service providers, cloud practice leaders, system integrators, and enterprise buyers across APAC, EMEA, and the Americas to close gaps from desk inputs and check assumptions against real project patterns.
Distribution of primary research fieldwork respondents
| Company type | Respondent position | Region |
|---|---|---|
| Top tier: 32% | CXOs: 13% | APAC: 45% |
| Mid tier: 54% | Functional/Unit leaders: 33% | EMEA: 36% |
| Smaller Players: 14% | Managers: 54% | Americas: 19% |
Market-Sizing & Forecasting
Sizing starts with a top-down reconstruction of the demand pool by linking cloud adoption activity to the services layer that typically sits around it, then applying penetrations and service intensity factors by region. To keep it grounded, the totals are stress-tested with selective bottom-up approximations, such as sampled project volumes times typical billing rates, and provider revenue splits where disclosures allow.
Key inputs in the model include cloud migration and modernization activity levels, the mix of public versus hybrid deployments, average project duration and staffing intensity, the share of work delivered remotely versus on-site, and regional wage-rate direction that impacts delivery pricing. We also use indicators such as regulatory compliance lift (data residency and sector rules) and the growth of cloud-native programs, since both tend to raise advisory and integration hours. Where bottom-up checks have gaps, we scale from comparable service lines and apply conservative ranges that are then reviewed in interviews.
Forecasting is run using scenario analysis anchored on a small set of drivers that are repeatedly confirmed by experts, including cloud workload expansion, enterprise modernization cycles, and IT services budget sensitivity. Scenarios are translated into yearly growth paths and then reconciled back to the demand indicators to avoid unrealistic step-changes.
Data Validation & Update Cycle
Outputs are validated through triangulation across multiple checkpoints so that one noisy data series does not drive the final number. We compare totals against independent signals like IT services spending direction, cloud adoption momentum, and changes in delivery mix, then investigate outliers before sign-off.
A multi-step analyst review is used for variance checks across regions and for consistency of implied pricing and volume. If a key driver moves unexpectedly, such as a sharp rate change or a large demand slowdown, the team re-contacts sources to confirm whether the shift is temporary or structural. Reports are refreshed annually, and an interim update is triggered when material events can change assumptions, followed by a final pre-delivery pass to ensure the latest view is reflected.
Mordor Intelligence's Global Market for Professional Cloud Services Market Size Versus Other Published Estimates
Published estimates for professional cloud services often differ because the counted service basket is not always the same, and because firms make different choices on base year, currency timing, and how they treat managed and ongoing optimization work.
Some sources expand the scope to include broader managed cloud operations and adjacent outsourcing, which can lift the total quickly. In Mordor Intelligence, the value is counted only when it is tied to cloud-focused professional services work (planning, migration, implementation, integration, and optimization), and the infrastructure or software subscription value is kept out of the calculation.
Benchmark comparison
| Source | Market Size | Gaps in Research Methodology |
|---|---|---|
| Mordor Intelligence | USD 31.07 B (2026) | |
| Industry Research Publisher A | USD 30.64 B (2024) | Uses an earlier base year and can capture a different spending cycle, and the service mix emphasis can tilt toward advisory-heavy definitions that do not map cleanly to project-plus-optimization revenue. |
| Industry Research Publisher B | USD 36.32 B (2025) | Often bundles a wider set of ongoing managed and governance activities into the same total, and the year and currency assumptions can push the reported value upward even if underlying project volume is similar. |
The table indicates that timing and scope are two practical reasons for the spread across published values. By keeping the service definition tied to cloud-specific professional work and checking the implied pricing and volume against interview feedback, the estimate stays traceable to clear drivers and repeatable steps.


Key Questions Answered in the Report
How large is the professional cloud services market in 2026?
The professional cloud services market size stands at USD 31.07 billion in 2026.
What is the expected growth rate for cloud services through 2031?
The market is forecast to expand at an 8.74% CAGR, reaching USD 47.23 billion by 2031.
Which deployment model will grow the fastest over the forecast period?
Public cloud is projected to register the highest 9.02% CAGR due to its elastic scaling and transparent pricing.
Which industry vertical is set to accelerate the most?
Healthcare is forecast to grow at a 10.09% CAGR as clarity around patient-data regulation improves.
Why are sovereign-cloud mandates important?
National data-localization laws require in-country processing, forcing providers to build regional infrastructure and creating compliance-driven demand.
How are egress fees affecting enterprises?
Egress and inter-cloud transfer costs can represent up to 25% of total cloud spend for multi-cloud users, discouraging workload portability and increasing vendor lock-in.
Page last updated on:


 Your data is secure and never sold or shared.


