Technology, Media and Telecom
5th MayPricing Strategy for Semiconductor Components
3 Min Read
The Kiosk Market Report is Segmented by Component (Hardware, Software, and Services), Type (Bank / Financial Kiosks, Gaming and Casino Kiosks, and More), Location (Indoor and Outdoor), Screen Size (less Than or Equal To 15", 15–32”, and More), End-User Industry (Healthcare, Retail, Banking and Financial Services, and More), and Geography
Market Overview
| Study Period | 2019 - 2030 |
|---|---|
| Market Size (2025) | USD 34.16 Billion |
| Market Size (2030) | USD 65.91 Billion |
| Growth Rate (2025 - 2030) | 14.50 % CAGR |
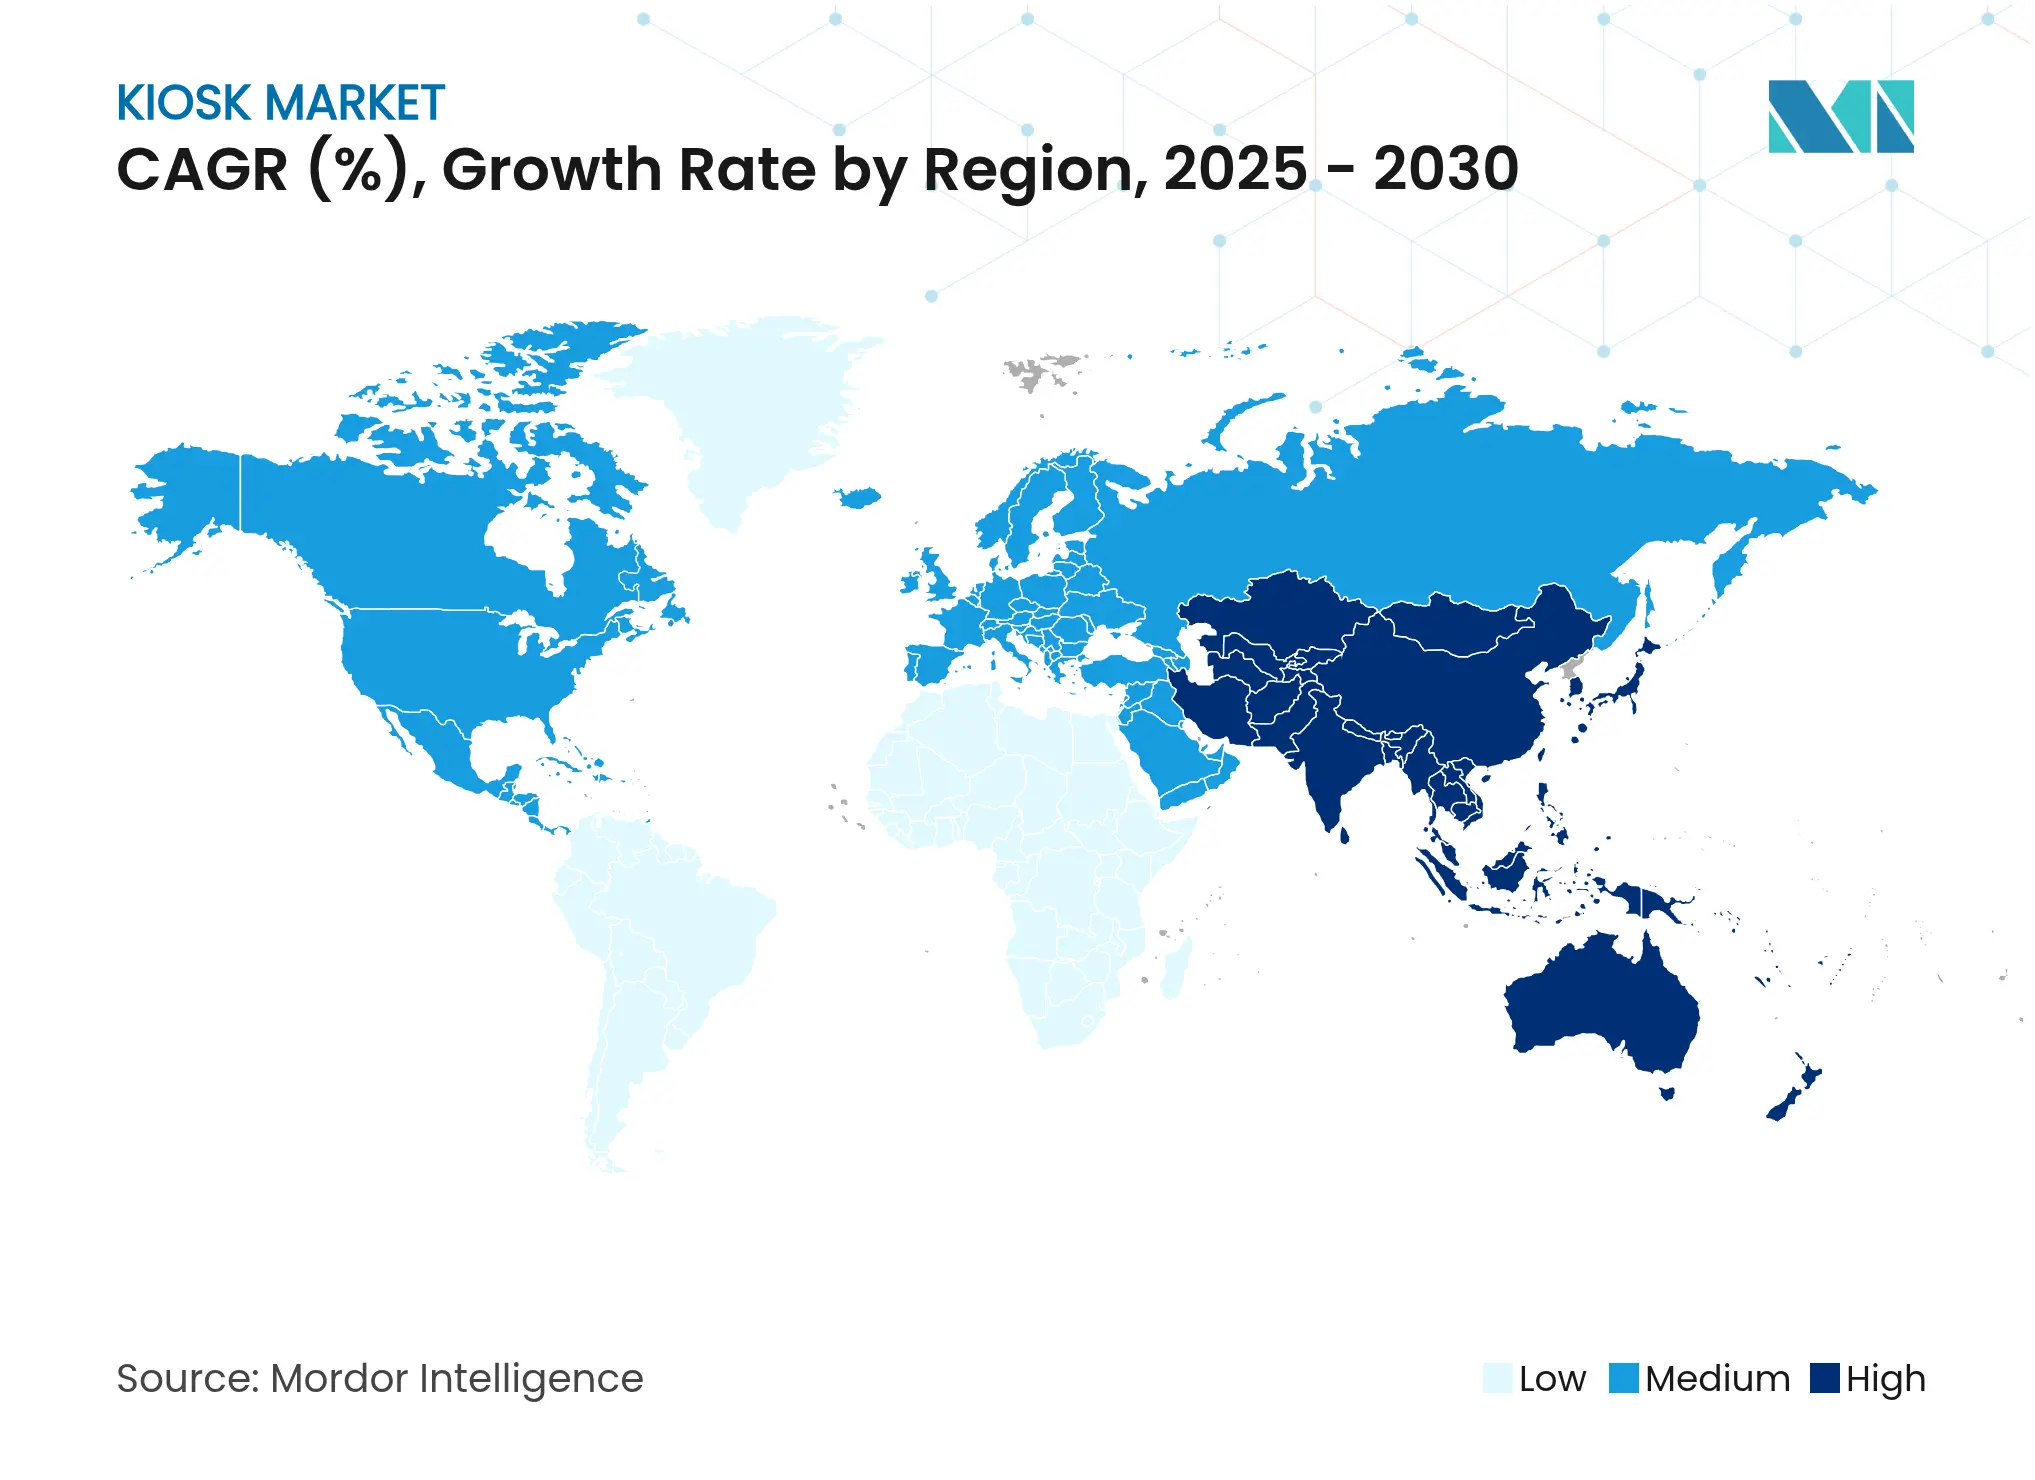
| Fastest Growing Market | Asia Pacific |
| Largest Market | Asia Pacific |
| Market Concentration | Medium |
Major Players *Disclaimer: Major Players sorted in no particular order. Image © Mordor Intelligence. Reuse requires attribution under CC BY 4.0. |
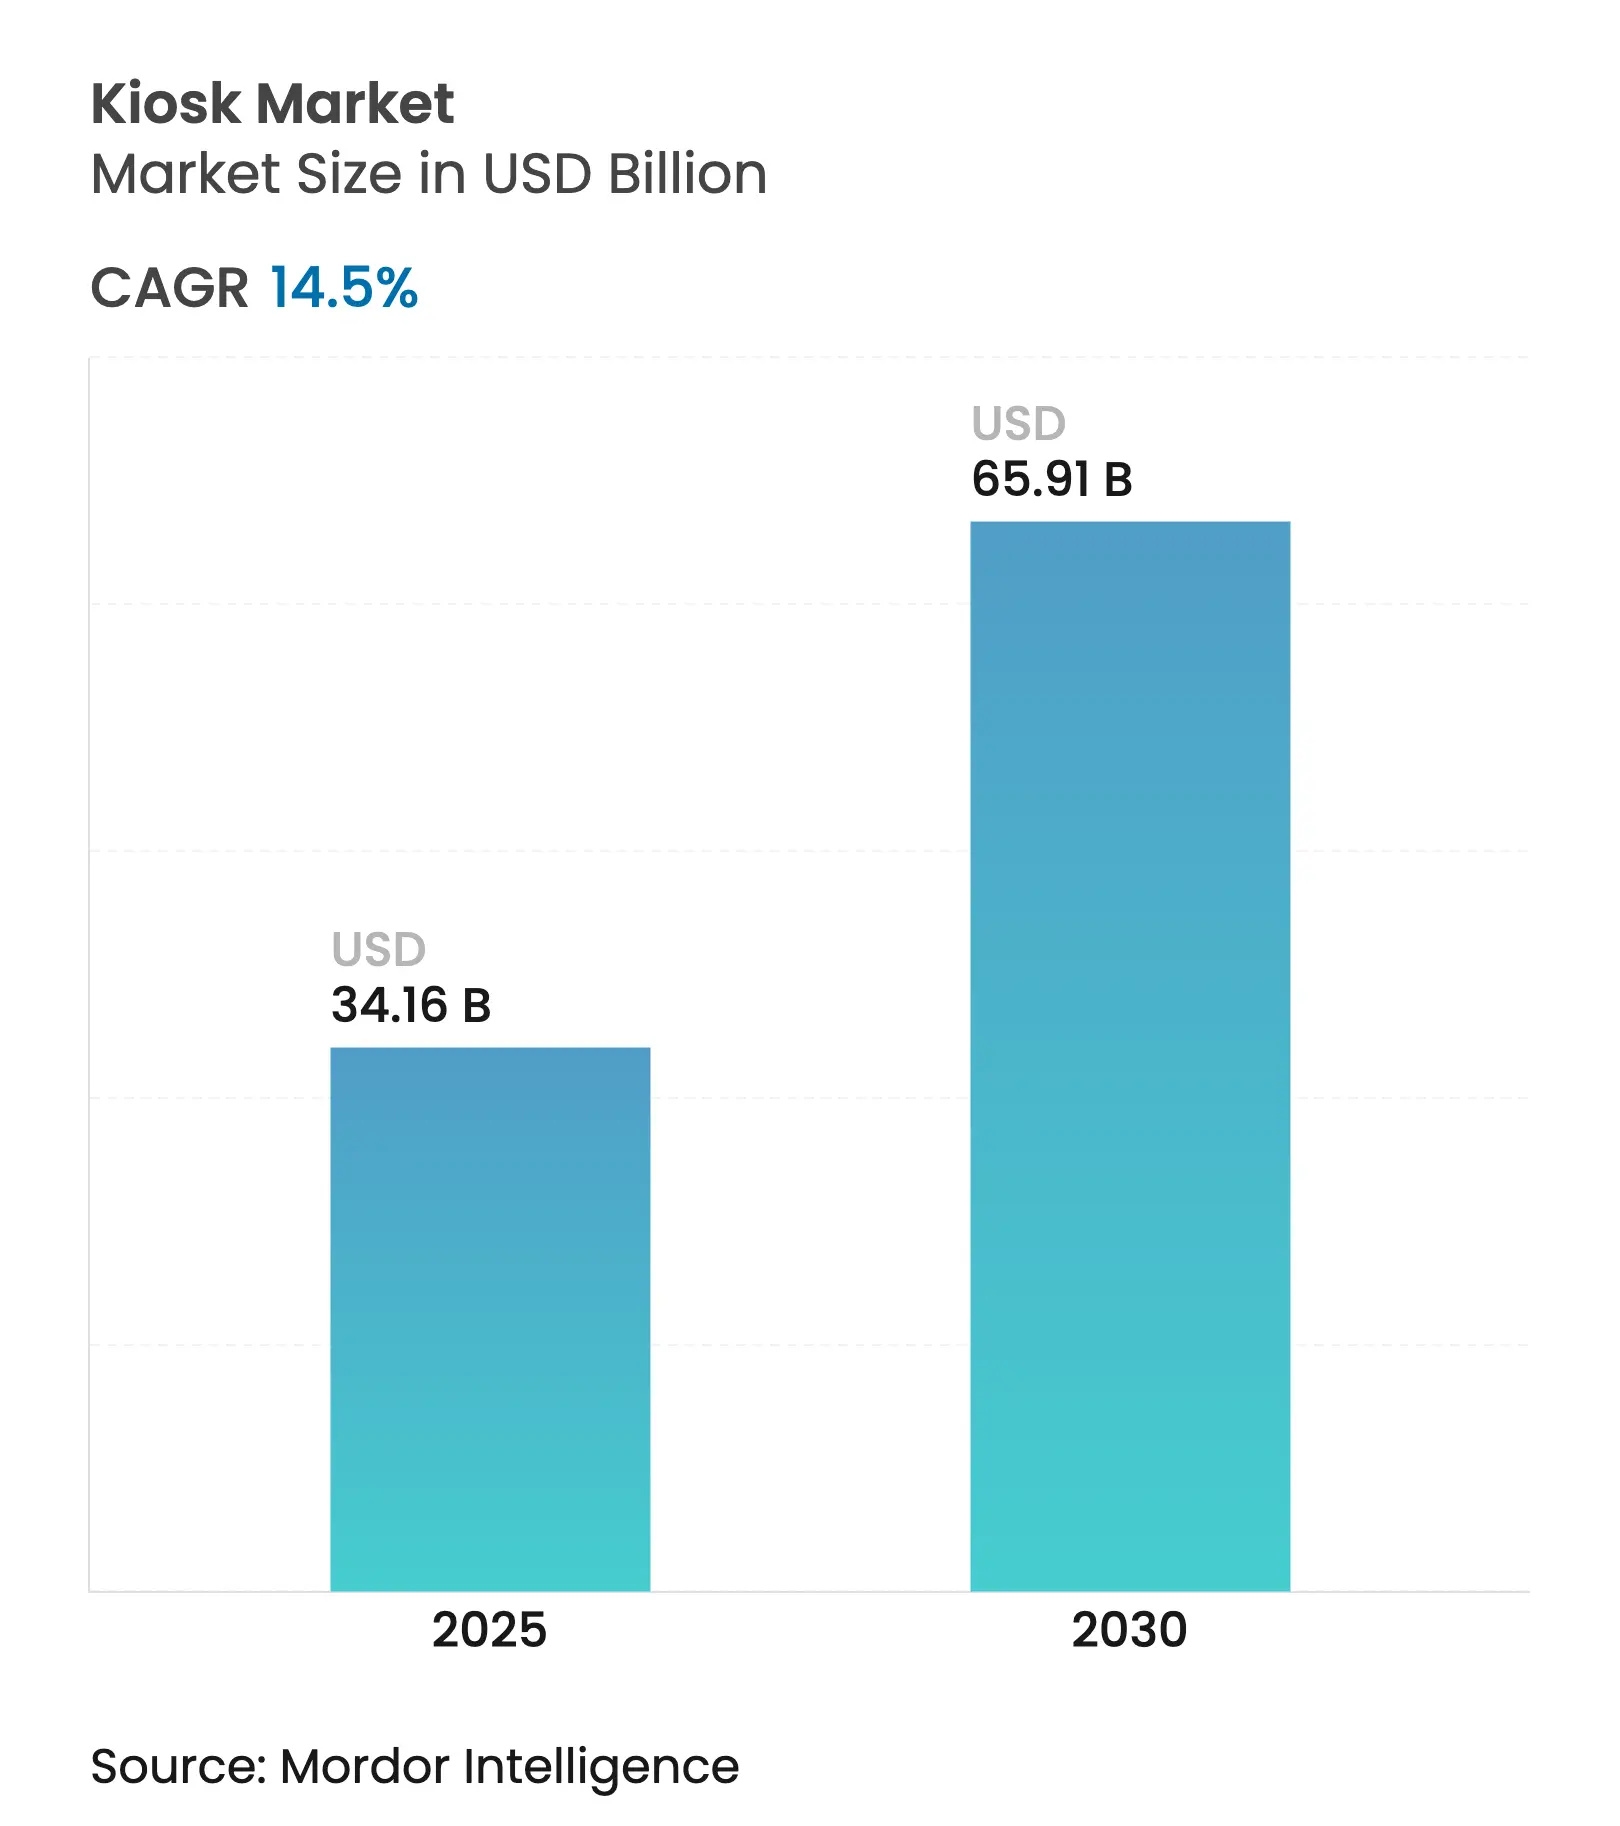
The global kiosk market stands at USD 34.16 billion in 2025 and is forecast to reach USD 65.91 billion by 2030, advancing at a 14.5% CAGR. This expansion reflects how self-service terminals solve labor shortages, accelerate digital payment acceptance, and lower operating costs across retail, banking, transportation, healthcare, and government settings. Hardware reliability, artificial intelligence, biometric authentication, and omnichannel integration are reshaping deployment strategies, while contactless transactions have become a default customer expectation. Asia leads demand, yet North America drives many software-centric upgrades that extend asset life and deepen personalization. Vendor competition now centers on lifecycle services, remote management, and vertical-specific software that boost return on investment.
Key Report Takeaways
Drivers Impact Analysis
| Driver | (~) % Impact on CAGR Forecast | Geographic Relevance | Impact Timeline | |||
|---|---|---|---|---|---|---|
Rising adoption of contactless self-service Rising adoption of contactless self-service | +3.5% | North America and Europe | Medium term (2-4 years) | (~) % Impact on CAGR Forecast :+3.5% | Geographic Relevance :North America and Europe | Impact Timeline :Medium term (2-4 years) |
Expansion of ATM and cash recyclers in rural Asia Expansion of ATM and cash recyclers in rural Asia | +3.1% | Asia; spillover to Africa | Long term (≥4 years) | |||
Digital wallets and NFC payments integration Digital wallets and NFC payments integration | +2.5% | Global; led by Asia and North America | Medium term (2-4 years) | |||
Middle-East smart-city information kiosks Middle-East smart-city information kiosks | +2.1% | Middle East; adoption spreading to Asia | Long term (≥4 years) | |||
Labor shortages in U.S. QSRs Labor shortages in U.S. QSRs | +1.7% | North America; expansion to Europe | Short term (≤2 years) | |||
Airport modernization programs Airport modernization programs | +1.4% | Europe and Asia | Medium term (2-4 years) | |||
| Source: Mordor Intelligence | ||||||
Rising Adoption of Contactless Self-Service in Post-Pandemic Retail Environment
Two-thirds of U.S. consumers favor self-checkout, and retailers that install kiosks report a 30% uplift in basket values. Loyalty programs, dynamic pricing, and localized promotions are delivered in real time, guided by artificial intelligence that tailors screens to user behavior. The approach cuts queue times, captures behavioral data, and limits staffing demands during peak trading periods. These benefits have cemented self-service as a strategic pillar in the kiosk market.[1]Deliverect, “Why Consumers Prefer Contactless Self-Service,” deliverect.com
Rapid Expansion of ATM and Cash Recycling Kiosks Across Rural Asia for Financial Inclusion
Cash recyclers handle both deposits and withdrawals, slashing cash logistics costs by up to 40% for banks while broadening rural access to formal financial services. Leading suppliers now embed biometric authentication and digital-wallet compatibility, aligning with Asia’s push for cash-light economies. Governments see the hardware as critical digital infrastructure that supports growth goals across underserved regions.
Integration of Digital Wallets and NFC Payments Stimulating Upgrade Cycles
Mobile wallets and contactless cards dominate point-of-sale growth, so fleet operators retrofit kiosks with NFC readers and biometric sensors. The upgrade shortens transaction times by as much as 120% and paves the way for unified loyalty wallets that span store, web, and app. Payment compliance and tokenization safeguards become decisive purchase criteria, repositioning software updates as a major revenue stream in the kiosk industry.
Government Smart-City Initiatives Fueling Information Kiosk Installations in Middle East
Municipalities deploy multilingual touchscreen pillars that dispense transit schedules, wayfinding, and e-government forms. Advertising slots generate recurring income, and embedded sensors capture footfall analytics that refine urban design. Installations in Ankara and Bursa exemplify how real-time citizen feedback loops improve service quality while strengthening transparency.
Restraints Impact Analysis
| Restraint | (~) % Impact on CAGR Forecast | Geographic Relevance | Impact Timeline | |||
|---|---|---|---|---|---|---|
High capex and field maintenance outdoors High capex and field maintenance outdoors | -2.8% | Global; more severe in emerging markets | Medium term (2-4 years) | (~) % Impact on CAGR Forecast :-2.8% | Geographic Relevance :Global; more severe in emerging markets | Impact Timeline :Medium term (2-4 years) |
Cyber-security and privacy concerns in healthcare Cyber-security and privacy concerns in healthcare | -2.1% | Europe; spillover to North America | Medium term (2-4 years) | |||
Fragmented software ecosystem in omnichannel retail Fragmented software ecosystem in omnichannel retail | -1.7% | Global; pronounced in mature markets | Short term (≤2 years) | |||
Vandalism and harsh conditions in emerging markets Vandalism and harsh conditions in emerging markets | -1.4% | Asia, Africa and Latin America | Long term (≥4 years) | |||
| Source: Mordor Intelligence | ||||||
High Up-Front Capex and Ongoing Field Maintenance Costs in Outdoor Deployments
Weatherproof shells, high-brightness panels, and antivandal films can raise purchase price by 50%. Outdoor units also demand more frequent service visits, which inflates total cost of ownership where local technical support is scarce. Subscription models that bundle hardware, software, and maintenance convert capital expense into predictable operating outlays and are gaining favor among cost-conscious buyers.[2]Advanced Kiosks, “Calculating Total Cost of Ownership for Outdoor Kiosks,” advancedkiosks.com
Cyber-Security and Data-Privacy Concerns Limiting Adoption in Healthcare Kiosks
Outdated operating systems expose medical check-in stations to intrusion risks at a time when regulations mandate strict patient data protection. Healthcare operators tighten encryption, deploy secure browsers, and adopt remote patch management to mitigate threats, but the added complexity slows procurement cycles. A coordinated physical-and-digital security framework is now essential to unlock broad installations.[3]Kaspersky Labs, “Legacy Systems in ATMs and Kiosks Pose Security Risks,” kaspersky.com
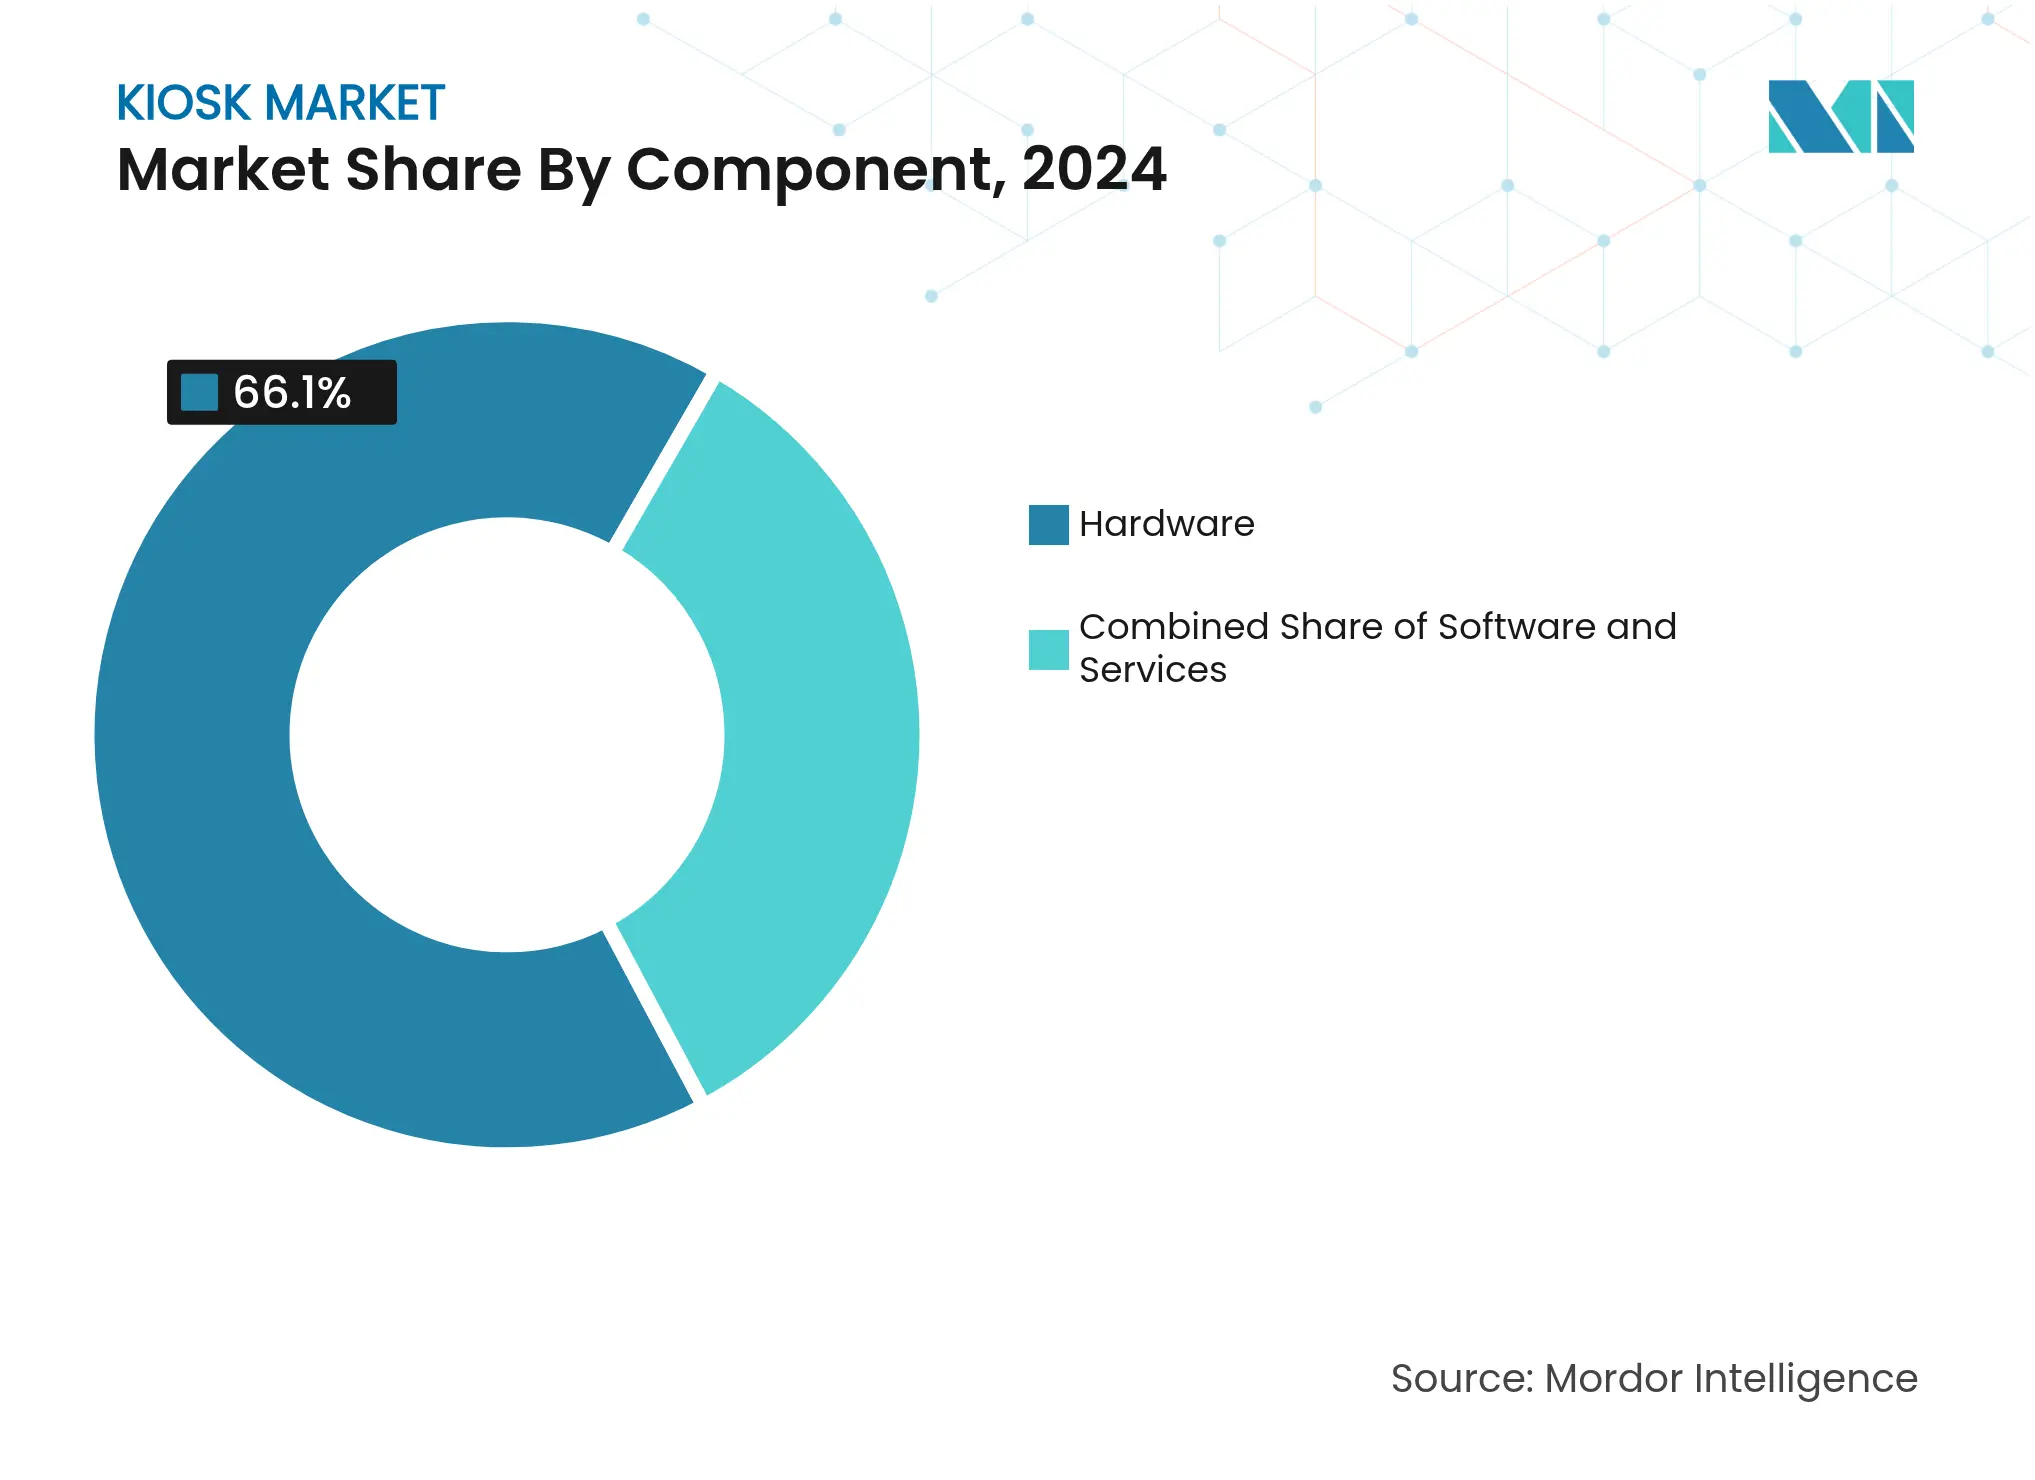
By Component: Services Outpace Hardware Growth
The hardware segment contributed the majority of kiosk market revenue in 2024 because every deployment begins with rugged enclosures, touchscreens, processors, and peripherals. Vendors have improved modularity and serviceability, extending product life and supporting higher duty cycles in high-traffic venues. Remote sensors alert technicians before downtime occurs, improving availability metrics that operators monitor closely.
Services, comprising installation, content management, predictive maintenance, and cybersecurity audits, are forecast to expand faster than hardware through 2030. Businesses increasingly outsource these tasks under multi-year contracts that guarantee uptime. Managed platforms stream diagnostics and content updates, minimizing truck rolls and standardizing user experience across distributed fleets.
Note: Segment shares of all individual segments available upon report purchase
By Type: Patient Interaction Kiosks Revolutionize Healthcare Access
Retail-focused vending and self-checkout units held the largest share in 2024, confirming their ubiquity in supermarkets, pharmacies, and convenience stores. They help retailers combat wage inflation while boosting throughput and upsell rates through cross-sell prompts. Advanced camera vision now verifies product scans, curbing shrinkage.
Patient interaction and pharmacy kiosks will register the highest growth as providers automate check-ins, prescription pickups, and telehealth sessions. Rural facilities see the terminals as cost-effective touchpoints that extend care, and urban hospitals value shorter registration lines. Fingerprint, palm-vein, or facial recognition ensure secure record retrieval, aligning with regulatory guidelines.
By Location: Outdoor Kiosks Overcome Environmental Challenges
Indoor venues, ranging from big-box stores to corporate lobbies, dominate deployments owing to ample power, connectivity, and climate control. Operators appreciate the lower cleaning and repair bills relative to street-side units. Interactive wayfinding maps, loyalty account sign-ups, and secure payments are the most common functions.
Outdoor kiosks will capture rising investment as new materials resist moisture and ultraviolet light. High-brightness panels remain readable in direct sun, and laminated safety glass rated IK10 stands up to impact. Solar panels and passive cooling cut energy costs, making installations feasible in remote bus shelters, parking facilities, and tourist trails.

Recognized by Experts. Trusted by Leaders.
A trusted intelligence partner to global decision-makers across 90+ countries.


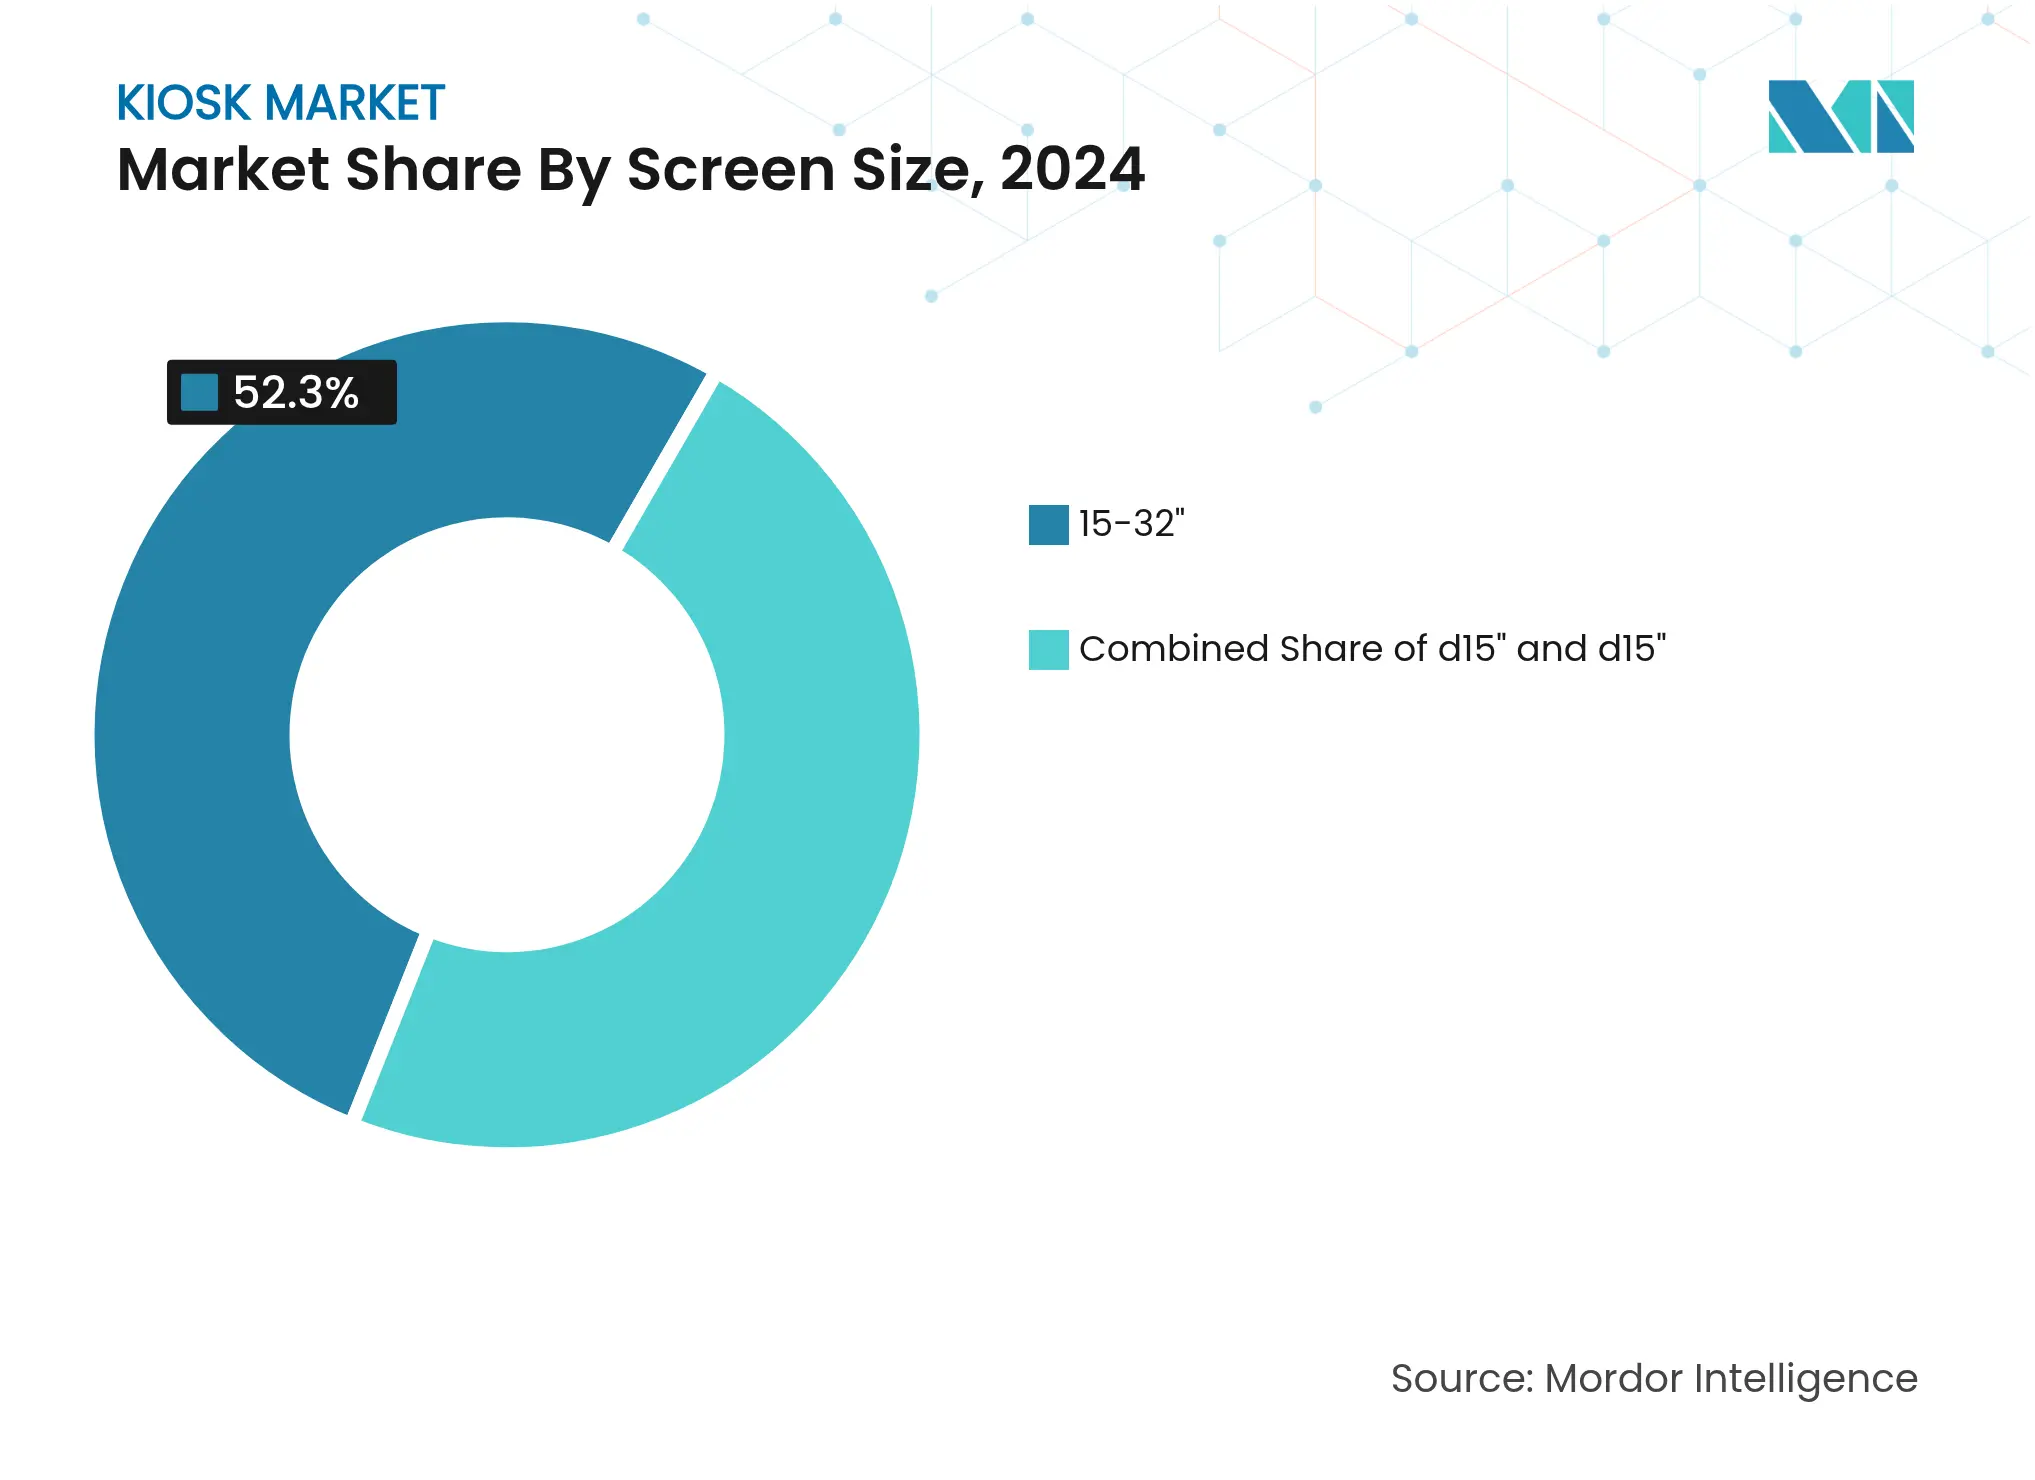
By Screen Size: Larger Displays Enable Richer Interactions
Mid-size panels between 15″ and 32″ provide enough canvas for item images, promotional videos, and on-screen keyboards without overwhelming users. Their popularity keeps component costs low and eases enclosure design. They dominate retail, banking, and healthcare scenarios.
Displays above 32″ will see the fastest uptake where immersive content and simultaneous multi-user sessions matter. Examples include interactive transit maps, stadium ticketing walls, and museum exhibits that let groups browse digital archives. Thinner bezels and 4K resolution give designers latitude to split screens into multiple interactive zones.
By End-User Industry: Hospitality and QSR Address Critical Labor Challenges
Retail applications such as scan-and-go, loyalty enrollment, and product configuration account for the leading revenue slice. Chains integrate inventory feeds and CRM records, ensuring prices and offers remain synchronized across channels.
Hospitality and QSR operators will deliver the sharpest growth as they confront staff shortages and higher wage floors. Self-order terminals accelerate queue movement, upsell extras, and transmit laser-printed order tickets directly to kitchens. They also collect first-party data that shapes menu design and marketing.
Asia represents the largest regional opportunity, holding 34.6% of 2024 sales. Governments roll out smart-city schemes, banks extend cash recyclers to villages, and airports modernize terminals using self-service for baggage and immigration. India’s push could see local kiosk market size touch INR 3,000 crores (USD 360 million equivalent) by 2025. Biometrics and multilingual interfaces accommodate diverse user groups, while domestic manufacturers supply cost-competitive units that meet strict durability norms.
North America remains an innovation hub where retailers, financial institutions, and restaurants perform large-scale upgrades that integrate AI, predictive maintenance, and cloud analytics. Quick-service brands demonstrate that kiosks lift average order value while freeing staff for hospitality roles. Payment platforms harmonize card, wallet, and loyalty tender types, reinforcing omnichannel consistency.
The Middle East shows the fastest growth trajectory to 2030, propelled by multi-billion-dollar urban initiatives that emphasize digital citizen services. Outdoor digital signage and information pylons enrich tourism corridors, while energy companies deploy rugged units that handle bill payment in desert climates. Europe follows closely, capitalizing on airport upgrades and retail reinvention, yet faces stricter data-privacy scrutiny that shapes deployment architecture. South America, Africa, and Oceania remain smaller but promising, provided vendors address power reliability and security in public spaces.

Reports are available across multiple geographies.
Gain in-depth market insights across regions to support informed decisions.
Market Concentration
The kiosk market hosts global conglomerates, vertical specialists, and agile contract manufacturers. Scale leaders such as NCR Corporation and Diebold Nixdorf bundle hardware, software, and managed services for banking and retail chains. Mid-tier innovators like KIOSK Information Systems, Meridian, and Posiflex tailor form factors to niche use cases ranging from marijuana dispensaries to border-control checkpoints.
Asian suppliers, including SZZT Electronics and Shenzhen Hunghui IT, gain share through price competitiveness, quick engineering cycles, and localization. Strategic partnerships now pair enclosure makers with cloud software firms so buyers receive a turnkey stack that integrates with payment gateways, CRM suites, and inventory systems. Vendors differentiate on AI vision modules, antimicrobial coatings, and edge compute accelerators that support machine-learning inference.
Investment focuses on outdoor durability, biometric ID, and modular service subscriptions. Toshiba’s 2025 launch of the MxP Vision Kiosk underscores the race to embed computer vision that auto-detects SKUs and mitigates shrink. Glory’s dominance in banknote recyclers illustrates how incumbents can extend cash-handling expertise into new territories, leveraging robust global service networks.

*Disclaimer: Major Players sorted in no particular order
1. INTRODUCTION
2. RESEARCH METHODOLOGY
3. EXECUTIVE SUMMARY
4. MARKET LANDSCAPE
5. MARKET SIZE AND GROWTH FORECASTS (VALUE)
6. COMPETITIVE LANDSCAPE
7. MARKET OPPORTUNITIES AND FUTURE OUTLOOK
A kiosk is a physical unit that provides a service and displays information. Kiosks may be either unmanned or manned (either digital or non-digital). Kiosks are majorly installed at locations with a high movement of people. For instance, unmanned kiosks in a shopping mall are installed near the entrance to guide people with promotional offer information and provide them with directions. Kiosks that offer customers a variety of self-service features are gaining full acceptance at hotel check-ins, retail sales check-outs, etc.
The Kiosk Market is Segmented By Type (Bank Kiosks, Vending Kiosks, Ticketing Kiosks, Patient Interactive Kiosks, Casino kiosks, Information Kiosks), By End-user Industry (Banking & Financial Services, Healthcare, Retail, Hospitality, Transportation), By Geography (North America (United States, Canada), Europe (United Kingdom, Germany, France, Rest of Europe), Asia Pacific (China, India, Japan, Rest of Asia Pacific), Latin America, Middle East and Africa). The market sizes and forecasts are provided in terms of value in USD million for all the above segments.
Pricing Strategy for Semiconductor Components
3 Min Read
Accelerating Additive Manufacturing Adoption in India
3 Min Read
When decisions matter, industry leaders turn to our analysts. Let’s talk.