Emission Monitoring Systems Market Size and Share
Market Overview
| Study Period | 2020 - 2031 |
|---|---|
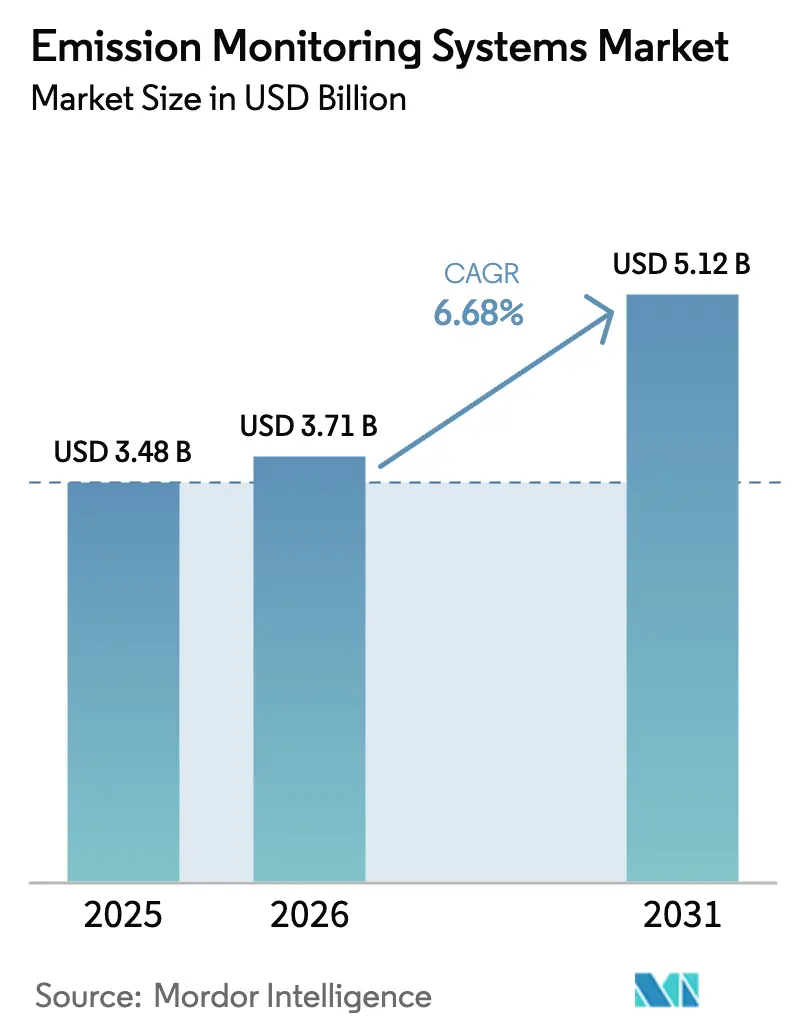
| Market Size (2026) | USD 3.71 Billion |
| Market Size (2031) | USD 5.12 Billion |
| Growth Rate (2026 - 2031) | 6.68% CAGR |
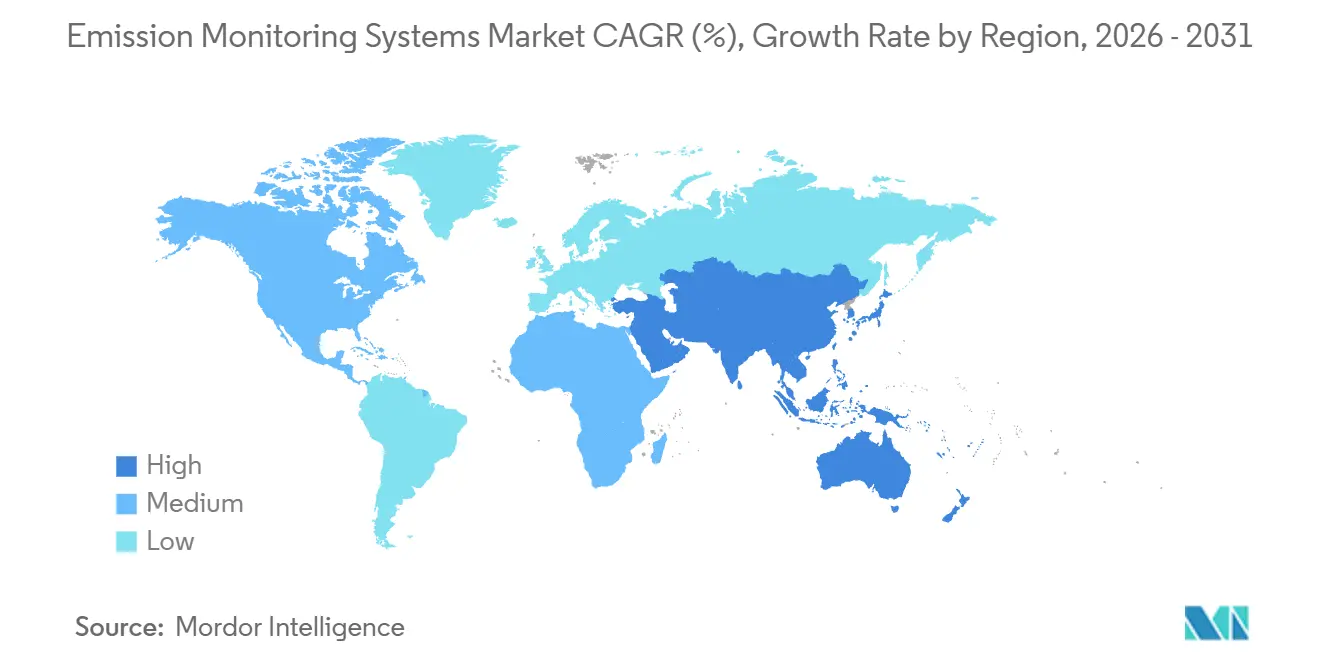
| Fastest Growing Market | Middle East |
| Largest Market | Asia Pacific |
| Market Concentration | Medium |
Major Players *Disclaimer: Major Players sorted in no particular order Image © Mordor Intelligence. Reuse requires attribution under CC BY 4.0. | |
Emission Monitoring Systems Market Analysis by Mordor Intelligence
The Emission Monitoring Systems Market size is projected to be USD 3.48 billion in 2025, USD 3.71 billion in 2026, and reach USD 5.12 billion by 2031, growing at a CAGR of 6.68% from 2026 to 2031. Carbon-pricing mandates in Europe, tax-credit verification in the United States, and ship-board rules under the International Maritime Organization (IMO) anchor demand, while cost-saving predictive models and cloud analytics reshape vendor strategies. Utilities and refiners treat high-accuracy stack data as a financial control point because a 1% measurement error can swing European Union Emissions Trading System (EU-ETS) allowance costs by millions of dollars per site. Asia Pacific remains the revenue leader thanks to India’s National Clean Air Programme retrofits and Southeast Asian waste-to-energy expansions, yet the Middle East delivers the fastest growth as refinery modernization accelerates ahead of potential carbon border adjustments. Hybrid continuous-predictive architectures, in-situ laser sensors, and cloud-hosted diagnostics cut total cost of ownership, but technician shortages and tropical humidity bias threaten timely commissioning and accurate reporting.
Key Report Takeaways
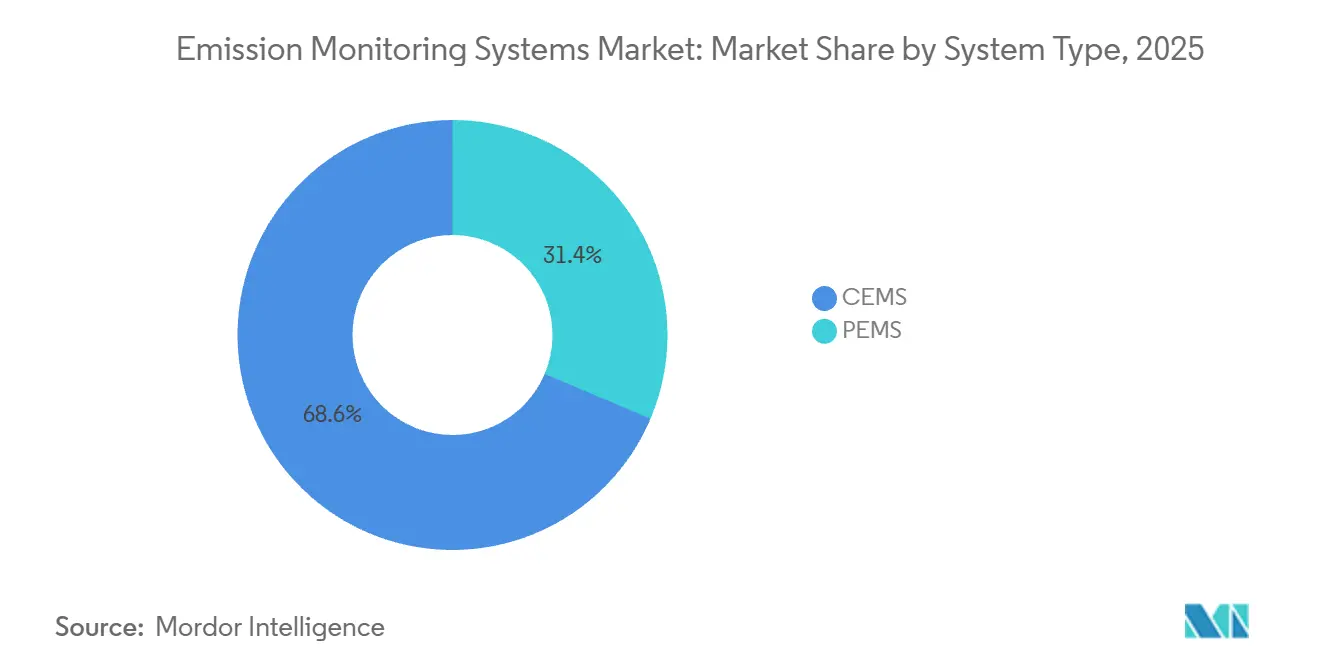
- By system type, continuous solutions led with 68.64% revenue share in 2025, while predictive models are on track for a 7.87% CAGR through 2031.
- By component, hardware represented 44.16% of 2025 spend, yet software is forecast to expand at an 8.27% CAGR to 2031.
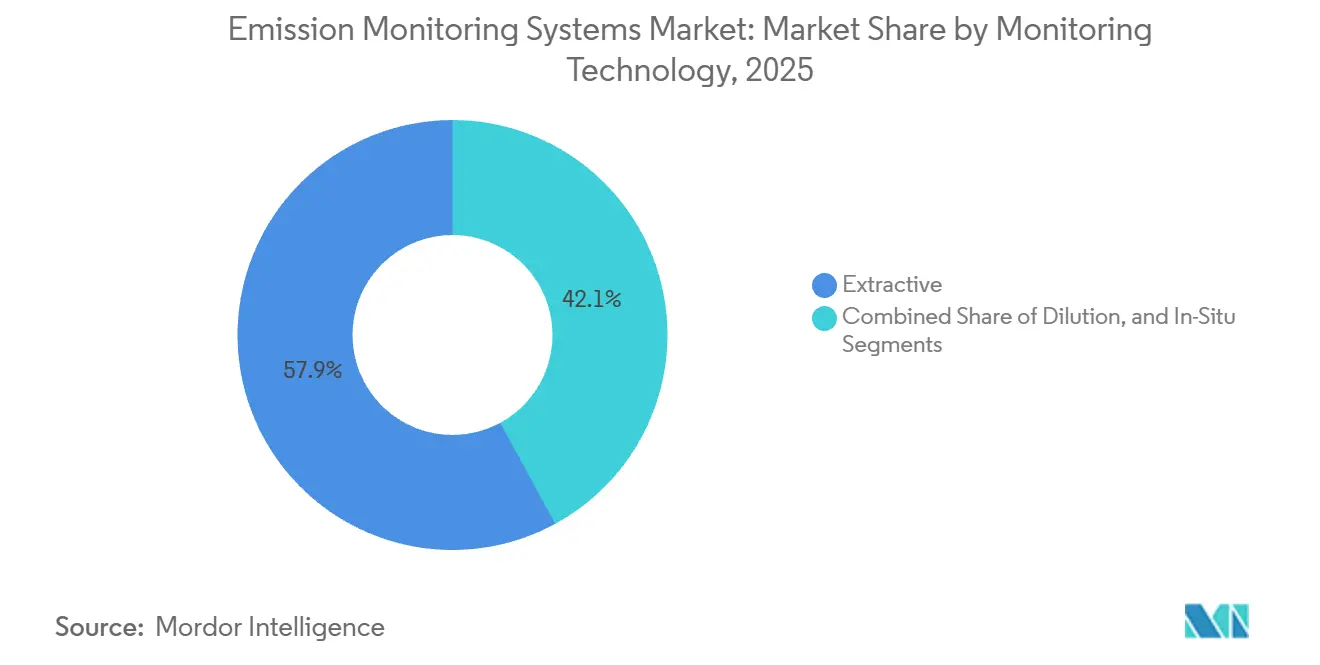
- By monitoring technology, extractive methods captured 57.93% of the emission monitoring systems market share in 2025, whereas in-situ tunable diode laser spectroscopy is projected to grow 8.19% annually to 2031.
- By end-user, power generation held 33.48% of the emission monitoring systems market size in 2025, but waste-to-energy facilities will post the quickest 9.19% CAGR to 2031.
- By geography, Asia Pacific led with a 36.17% revenue share in 2025, while the Middle East is set to post the highest 8.19% CAGR through 2031.
Note: Market size and forecast figures in this report are generated using Mordor Intelligence’s proprietary estimation framework, updated with the latest available data and insights as of January 2026.
Global Emission Monitoring Systems Market Trends and Insights
Drivers Impact Analysis*
| Driver | (~) % Impact on CAGR Forecast | Geographic Relevance | Impact Timeline |
|---|---|---|---|
| Transition from CAPEX-heavy CEMS to hybrid CEMS-PEMS architectures in Europe | +1.2% | Europe, with early adoption in Germany, Netherlands, United Kingdom | Medium term (2-4 years) |
| Mandatory EU-ETS Phase IV carbon pricing driving stack-level monitoring, Europe | +1.5% | Europe, concentrated in Germany, Poland, Spain, Italy | Short term (≤ 2 years) |
| Inflation Reduction Act tax-credit verification creating surge in United States power-plant CEMS retrofits | +1.3% | United States, with concentration in Texas, Pennsylvania, West Virginia coal and gas regions | Short term (≤ 2 years) |
| In-situ laser-based sensors cutting lifecycle cost by 30% in Asia Pacific waste-to-energy plants | +1.1% | Asia Pacific core (China, India, Southeast Asia), spill-over to Middle East | Medium term (2-4 years) |
| National Clean Air Programme accelerating coal-fired CEMS roll-outs, India | +0.9% | India, with early gains in Delhi NCR, Maharashtra, Gujarat thermal clusters | Short term (≤ 2 years) |
| IMO 2023 EEXI and CII rules triggering ship-board SEMS installations, global maritime | +0.7% | Global, with highest uptake in European, Asian, and North American shipping lanes | Short term (≤ 2 years) |
| Source: Mordor Intelligence | |||
Transition From CAPEX-Heavy CEMS to Hybrid CEMS-PEMS Architectures in Europe
European operators overlay predictive emission monitoring models on existing continuous analyzers to curb capital spending, cut installation from 12 weeks to 4 weeks, and accelerate compliance reporting. Germany’s Federal Immission Control Act endorses predictive methods for low-emission units once quarterly crosschecks confirm model accuracy within ±10%. The Netherlands and United Kingdom grant similar flexibility for refinery flares, trimming hardware budgets 40%-50% for ancillary stacks. Utilities with mature data-science teams exploit process variables such as fuel flow, excess oxygen, and flame temperature to calculate nitrogen oxides and sulfur dioxide in real time, reducing unscheduled downtime for analyzer maintenance. Smaller plants struggle to maintain the statistical models, prompting a services opportunity for vendors that bundle software, calibration gases, and regulatory reporting. The hybrid path also supports faster technology refresh cycles because model coefficients update in software rather than through hardware swaps.
Mandatory EU-ETS Phase IV Carbon Pricing Driving Stack-Level Monitoring
EU-ETS Phase IV tightened the cap reduction factor to 4.3% in 2024, pushing spot prices to EUR 80-EUR 100 per metric ton (USD 90-USD 113) during 2025.[1]European Commission, “EU ETS Phase IV,” ec.europa.eu A 500 MW coal plant emitting 3 million tCO₂ per year faces EUR 240 million (USD 272 million) in annual allowance costs, so a ±2% measurement margin mandated by EN 14181 directly influences cash flow. Operators retrofit heated extractive lines, redundant analyzers, and automated drift diagnostics to meet the precision threshold. Poland and Spain alone represented 38% of new orders in 2025 as facilities rushed to secure monitoring-plan approvals before the 2026 deadline. Vendors with full EN 15267 certification libraries command premium pricing, although regional utilities increasingly demand remote calibration to overcome technician shortages.
Inflation Reduction Act Verification Creating United States Retrofit Surge
The 2022 Inflation Reduction Act grants up to USD 85 per metric ton for captured carbon dioxide, contingent on continuous baseline monitoring under 40 CFR Part 75. More than 200 gas and coal units in Texas, Pennsylvania, and West Virginia ordered analyzers in 2025 to qualify for transferable tax credits that can cut project payback to under 12 months. A single 400 MW combined-cycle plant capturing 500,000 tCO₂ yearly secures USD 42.5 million in credits against a USD 3 million monitoring package, making instrumentation a negligible cost of capital. Demand spikes have strained calibration-gas suppliers and lengthened third-party relative accuracy test audit queues into late 2026, underscoring the need for additional certified service capacity.
In-Situ Laser Sensors Cutting Lifecycle Cost by 30% in Asia Pacific Waste-to-Energy Plants
Tunable diode laser spectroscopy transmits a beam across the stack, eliminating pumps, filters, and drying systems. Jakarta’s 50 MW Sunter waste-to-energy plant cut 10-year ownership cost 32% after switching from cold-dry extractive units in 2024. Maintenance intervals lengthened from weekly to quarterly, and sensor life doubled to a decade. China’s 14th Five-Year Plan demands continuous monitoring at every facility processing more than 300 t/day of municipal waste, and provincial bureaus in Guangdong, Zhejiang, and Jiangsu pre-approved in-situ lasers to streamline permits. Southeast Asian plants in Thailand and Vietnam replicate this model to avoid humidity-related drift that plagues extractive hardware, tilting regional specifications toward in-situ technology.
Restraints Impact Analysis*
| Restraint | (~) % Impact on CAGR Forecast | Geographic Relevance | Impact Timeline |
|---|---|---|---|
| Scarcity of TÜV and MCERTS-certified technicians delaying European commissioning | -0.8% | Europe, acute in Germany, Poland, Spain, Italy | Short term (≤ 2 years) |
| High humidity bias in tropical regions raising false-compliance risk | -0.6% | Southeast Asia, India, Middle East coastal zones, Sub-Saharan Africa | Medium term (2-4 years) |
| Legacy DCS-DAQ inter-operability gaps inflating retrofit costs in United States utilities | -0.5% | United States, concentrated in coal-heavy Midwest and Appalachian regions | Medium term (2-4 years) |
| Capital lock-in from long-term CEMS leasing models hindering PEMS adoption, Middle East | -0.4% | Middle East, particularly Saudi Arabia, UAE, Qatar refining and petrochemical sectors | Long term (≥ 4 years) |
| Source: Mordor Intelligence | |||
Scarcity of TUV and MCERTS-Certified Technicians Delaying European Commissioning
Field certification under EN 15267 requires accredited engineers to perform multi-point calibration, linearity checks, and relative accuracy testing. TUV SUD logged a 40% rise in requests during 2025 yet expanded its engineer roster only 12%, lifting average wait times from 8 weeks to 18 weeks in Germany, Poland, and Spain. Smaller operators defer upgrades or accept provisional permits that rely on manual stack tests, eroding real-time visibility for regulators. The shortage sparks price inflation for certification services and encourages larger utilities to self-fund technician training programs, but accreditation lead times restrain quick fixes.
High Humidity Bias Raising False-Compliance Risk in Tropical Regions
Extractive systems draw gas through sample lines where condensation forms if temperature drops below the dew point, distorting infrared and ultraviolet absorption. A 2024 field study showed 8%-15% sulfur dioxide over-reporting at Indonesian coal plants during monsoon months, inflating limestone consumption for flue-gas desulfurization.[2]Asian Development Bank, “Southeast Asia Energy Outlook 2024,” adb.org Conversely, moisture can suppress nitrogen oxide readings, risking non-detected exceedances and potential fines during quarterly audits. Heated sample lines or in-situ lasers solve the bias but add USD 50,000-USD 150,000 per stack, a hurdle for independent power producers with thin margins. Regulators across Southeast Asia now mandate humidity-compensated designs in new tenders, signaling tighter enforcement.
*Our forecasts treat driver/restraint impacts as directional, not additive. The impact forecasts reflect baseline growth, mix effects, and variable interactions.
Segment Analysis
By System Type: Predictive Models Gain Ground Despite CEMS Dominance
Continuous solutions retained a 68.64% share in 2025, anchored by decades of codified requirements under EU-ETS, the United States Clean Air Act, and China’s ultra-low emission rules. Predictive models will register a 7.87% annual advance, capturing interest from operators keen to avoid analyzer duplication on ancillary stacks. The emission monitoring systems market size for predictive models is forecast to exceed USD 1.2 billion by 2031, reflecting their role in digitally mature utilities. Early adopters in Germany and the United States exploit real-time process variables to simulate nitrogen oxides within ±10% of extractive readings, satisfying regulators while shaving hardware budgets by nearly half. Middle Eastern refineries remain cautious because long-term leases signed a decade ago lock them into fixed continuous contracts until 2028-2030, but hybrid pilots on flare systems are underway with regulatory oversight from Saudi Arabia’s National Environment Strategy.[3]Saudi Ministry of Environment, Water and Agriculture, “National Environment Strategy 2024,” mewa.gov.sa
In North America, combined-cycle gas turbines use predictive algorithms during cycling operation to avoid downtime when extractive analyzers require maintenance. Asia Pacific utilities adopt a split strategy, retaining continuous analyzers on primary boilers and deploying predictive models on secondary units to align with China’s digital-twin policy for coal plants. Cloud vendors that combine neural-network modeling with enterprise carbon accounting gain traction because they simplify quarterly regulatory reporting. As more jurisdictions recognize predictive techniques, the emission monitoring systems market will likely see regulatory language shift from prescriptive hardware mandates to performance-based accuracy thresholds.


By Component: Cloud-Hosted Software Outpaces Hardware as Data Integration Deepens
Hardware accounted for 44.16% of 2025 spending, reflecting a mature installed base of gas analyzers, flow meters, and data acquisition units. Software will grow 8.27% each year through 2031 as operators integrate real-time stack data with enterprise resource planning and environmental, social, and governance dashboards. A 15-plant European utility consolidated data from 60 stacks into a cloud portal in 2025, trimming calibration labor 25% by automating drift alerts. Cloud platforms also underpin predictive maintenance, notifying technicians before sensor fouling degrades accuracy, thereby protecting compliance margins.
Services (installation, calibration, third-party certification, and multi-year maintenance) capture the balance of revenue and ride the cumulative installed base. Vendors tie software subscriptions to service agreements, offsetting hardware commoditization. Gas analyzers remain the revenue cornerstone, especially nondispersive infrared CO₂ cells and chemiluminescence nitrogen oxide detectors, yet open-protocol data acquisition hardware grows fastest as operators demand OPC UA and Ethernet to avoid vendor lock-in. As software penetration rises, the emission monitoring systems industry pivots toward recurring revenue models built on analytics rather than box sales.
By Monitoring Technology: In-Situ TDLS Gains Share in High-Moisture Applications
Extractive methods dominated 57.93% of deployments in 2025, especially at coal plants where EN 14181 specifies continuous extractive measurement for CO₂, SO₂, and NOₓ. The emission monitoring systems market anticipates an 8.19% CAGR for in-situ tunable diode laser spectroscopy through 2031 because it sidesteps sample conditioning and slashes maintenance hours by up to 70%. Southeast Asian waste-to-energy plants, operating in humid, particulate-rich gas streams, increasingly select laser sensors to avoid frequent filter clogging and moisture drift.
Dilution sampling occupies a niche on marine vessels where space constraints limit heater enclosures, but sensitivity trade-offs hinder adoption on stationary sources. Hot-wet extractive systems still appeal to high-sulfur processes, albeit at higher auxiliary power cost, while cold-dry variants save energy yet demand strict moisture correction in tropical climates. Regulatory endorsements such as China’s pre-approval of in-situ lasers for municipal waste plants and India’s ongoing evaluation for biomass co-firing indicate the technique’s mainstreaming by 2027. The emission monitoring systems market size linked to laser-based hardware could surpass USD 900 million by 2031 if certification bottlenecks ease.

By End-User Industry: Waste-to-Energy Leads Growth as Municipal Mandates Tighten
Power generation held 33.48% of 2025 demand, reflecting legacy coal fleets and modern gas turbines that already rely on extractive analyzers under strict air rules. Waste-to-energy, however, will record a 9.19% CAGR as municipal landfill-diversion targets force continuous monitoring at thousands of incinerators worldwide. The emission monitoring systems market share for waste-to-energy applications could reach 18% by 2031 as the European Union mandates diversion of 65% of municipal waste from landfills by 2035. China added 12 GW of waste-to-energy capacity in 2024 and requires continuous monitoring on every line exceeding 300 t/day throughput, leading to roughly 1,200 new systems annually.
Oil and gas remains significant, driven by flare monitoring on offshore platforms and refinery heaters, while cement, steel, and chemicals adopt multi-gas analyzers to meet both air-pollution and carbon-trading requirements. Pharmaceutical plants, though lower emitters, demand ultra-low detection limits for volatile organic compounds, spurring high-precision flame ionization detectors. Maritime retrofits accelerate as 15,000 vessels above 5,000 gross tonnage must comply with IMO EEXI and CII rules by 2027, adding ship-board analyzers and satellite telemetry to the overall emission monitoring systems market.
Geography Analysis
Asia Pacific retained 36.17% of revenue in 2025, anchored by China’s coal capacity, India’s National Clean Air Programme rollouts, and Southeast Asian waste-to-energy projects. The region’s policy mix of ultra-low emission standards and municipal-solid-waste directives sustains hardware replacement and software upgrades, while local fabricators in China and South Korea intensify price pressure on Western suppliers. The emission monitoring systems market size in Asia Pacific is forecast to climb steadily as in-situ laser uptake offsets extractive saturation.
The Middle East emerges as the fastest-growing region at an 8.19% CAGR through 2031. Saudi Arabia’s National Environment Strategy mandates continuous monitoring for thermal inputs above 50 MW by 2027, compelling refineries, desalination plants, and gas-fired power stations to install analyzers on stacks that previously relied on annual tests. The United Arab Emirates enacted Federal Decree-Law 24-2022, giving industrial operators three years to adopt best available techniques, including continuous monitoring. Refinery upgrades and petrochemical debottlenecking drive bundled analyzer-plus-service contracts that elevate regional spend.
Europe remains large and compliance-driven, with Germany, Poland, Spain, and Italy accounting for most installations. Tightened EU-ETS rules and Industrial Emissions Directive standards encourage analyzer replacements that deliver ±2% accuracy. North America sees retrofit momentum as United States tax credits reward verified emission cuts, and Canada’s Output-Based Pricing System expands to more provinces. South America adds selective demand in Brazil, Argentina, and Mexico as state-level air agencies adopt continuous monitoring, while Africa concentrates activity in South Africa, Nigeria, and Egypt where multinational plants align with export-market environmental norms. Collectively, these dynamics ensure global diversity in the emission monitoring systems market.
Mordor Intelligence provides coverage of the emission monitoring systems market across other key regional markets, including North America, each with their regulatory frameworks and demand patterns.

Competitive Landscape
The market shows moderate concentration. Five global conglomerates ABB, Siemens, Emerson, Thermo Fisher Scientific, and AMETEK held roughly 45% of 2025 revenue, leveraging wide product portfolios, multi-jurisdictional certifications, and service annuities from long-lived installations. Niche players such as HORIBA, SICK, Teledyne, ENVEA, and Opsis secure share in high-precision or niche segments, including pharmaceuticals, semiconductors, and marine applications, where detection limits and response times exceed general-purpose specifications. New entrants from data science and photonics concentrate on predictive software and in-situ lasers, respectively, eroding incumbent hold on emerging growth niches.
Strategic moves emphasize vertical integration and digital-service bundling. Emerson invested in predictive-model software in 2024 to complement its DeltaV control system, aiming to serve cost-sensitive Eastern European utilities through hybrid architectures. Siemens embeds analyzer interfaces into SIMATIC control platforms to automate EU-ETS reporting, enhancing stickiness for heavy industries. ENVEA and Opsis undercut extractive incumbents by offering modular in-situ laser systems priced 20%-30% lower, resonating with municipal utilities. Certification remains a moat; ISO 12039, EN 15267, and United States Performance Specification standards require costly tests that favor firms with in-house labs.[4] International Organization for Standardization, “ISO 12039:2019,” iso.org
Geographic expansion also shapes competition. HORIBA opened a Jakarta service hub in 2025 to support Southeast Asian customers, cutting turnaround time from four weeks to one. Teledyne introduced an IMO-certified ship-board analyzer with satellite telemetry, capturing early maritime retrofits. ABB secured a USD 52 million refinery order in the Middle East to retrofit 18 heaters and flares, signaling oil and gas modernization momentum. Vendors that pair hardware with cloud analytics and certified services position to capture recurring revenue as the emission monitoring systems market pivots toward outcome-based contracts.
Emission Monitoring Systems Industry Leaders
ABB Ltd.
Siemens AG
Emerson Electric Co.
General Electric Company
AMETEK Inc.
- *Disclaimer: Major Players sorted in no particular order

Recent Industry Developments
- December 2025: Siemens AG invested EUR 45 million (USD 51 million) to expand its Karlsruhe gas-analyzer plant, adding tunable diode laser module capacity for European and Asian waste-to-energy demand.
- November 2025: Thermo Fisher Scientific won a USD 38 million contract to supply analyzers for 22 Indian coal plants under the National Clean Air Programme, with installation through 2027.
- October 2025: AMETEK acquired a United States predictive-emission software firm for USD 120 million, integrating cloud analytics into its Process Instruments division.
- September 2025: Honeywell launched Experion PKS Orion, merging continuous monitoring data, process control, and carbon accounting in one platform for refineries and chemical plants.


Research Methodology Framework and Report Scope
Market Definitions and Key Coverage
Our study defines the emission monitoring systems market as sales of fixed-site instrumentation, data loggers, and software that continuously or predictively capture stack-gas parameters (SO₂, NOx, CO, CO₂, O₂, flow, opacity) to evidence compliance with air-quality regulations across industrial point sources. We track Continuous (CEMS) and Predictive (PEMS) solutions installed on boilers, kilns, furnaces, reactors, and flares worldwide.
Scope exclusion: portable hand-held testers and satellite-based ambient sensing are outside this remit.
Segmentation Overview
- By System Type
- Continuous Emission Monitoring Systems (CEMS)
- Predictive Emission Monitoring Systems (PEMS)
- By Component
- Hardware
- Gas Analyzers
- Flow and Opacity Monitors
- Data Acquisition Systems (DAS)
- Software
- Stand-Alone
- Cloud-Hosted
- Services
- Installation and Deployment
- Calibration and Certification
- Support and Maintenance
- Hardware
- By Monitoring Technology
- Extractive
- Hot-Wet
- Cold-Dry
- Dilution
- In-Situ
- Tunable Diode Laser Spectroscopy (TDLS)
- Extractive
- By End-User Industry
- Power Generation
- Coal-Fired
- Combined-Cycle Gas Turbines
- Oil and Gas
- Upstream
- Midstream
- Downstream and Refineries
- Metals and Mining
- Chemicals and Petrochemicals
- Pharmaceuticals
- Cement and Aggregates
- Pulp and Paper
- Waste-to-Energy and Incineration
- Maritime (Ship-Board)
- Power Generation
- By Geography
- North America
- United States
- Canada
- Mexico
- South America
- Brazil
- Argentina
- Rest of South America
- Europe
- United Kingdom
- Germany
- France
- Italy
- Spain
- Russia
- Rest of Europe
- Asia Pacific
- China
- India
- Japan
- South Korea
- Australia
- Southeast Asia
- Rest of Asia Pacific
- Middle East
- United Arab Emirates
- Saudi Arabia
- Turkey
- Rest of Middle East
- Africa
- South Africa
- Nigeria
- Egypt
- Rest of Africa
- North America
Detailed Research Methodology and Data Validation
Primary Research
Mordor analysts interviewed stack-testing contractors, CEMS integrators, refinery EHS managers, and regional regulators in North America, Europe, and Asia. These dialogues clarified real-world replacement cycles, service mark-ups, and regulatory grace periods, letting us reconcile desk-based volume estimates with field reality.
Desk Research
We compiled public data from regulators such as the US EPA's Air Markets Program, the EU Industrial Emissions Directive registries, and India's CPCB OCEMS dashboard, alongside trade bodies like the World Cement Association and the International Energy Agency. Company 10-Ks, import-export manifests (Volza), patent families (Questel), and peer-reviewed journals on tunable-diode-laser analyzers rounded out baseline evidence. Our team also tapped Dow Jones Factiva to track tender awards and plant retrofits. The examples cited are illustrative; many other sources reinforced each datapoint.
Market-Sizing & Forecasting
We began with a top-down construct that rebuilt the addressable demand pool from registered emission points per industry and their mandated monitoring frequency. We then cross-checked totals with sampled bottom-up roll-ups of supplier shipments and average selling prices gathered through channel checks. Key variables like new coal- and gas-fired capacity additions, refinery throughputs, cement kiln counts, average CEMS ASP erosion, and PEMS adoption rates drive the model. A multivariate regression with ARIMA overlays projected each variable, after which scenario analysis adjusted for policy tightening or early coal retirements. Any data gaps in the supplier roll-ups were back-filled using region-specific ASP corridors derived from D&B Hoovers financials.
Data Validation & Update Cycle
Outputs pass a two-layer analyst review where variance against known plant-level inventories and historical spend triggers re-checks. We refresh every twelve months and issue ad-hoc updates within four weeks of material regulatory changes; a final analyst sweep occurs just before delivery to ensure clients receive the latest view.
Why Mordor's Emission Monitoring Systems Baseline Figures Earn Deep Trust
Published numbers often diverge because firms vary scope choices, base years, currency treatments, and refresh frequency. Our disciplined selection of stack-bound systems only, an annual refresh cadence, and verified ASP inputs position Mordor's estimate as the dependable midpoint buyers can plan around.
Key gap drivers with other publishers include their inclusion of ambient air sensors, use of aggressive regulatory adoption curves, or reliance on static 2022 exchange rates, which inflate or deflate totals relative to what we report.
Benchmark comparison
| Market Size | Anonymized source | Primary gap driver |
|---|---|---|
| USD 3.47 billion (2025) | Mordor Intelligence | - |
| USD 3.50 billion (2023) | Regional Consultancy A | Adds ambient sensors and software platforms, projects faster PEMS penetration |
| USD 3.20 billion (2023) | Trade Journal B | Excludes PEMS, uses constant 2022 FX rates, model last updated 2023 |
In sum, our balanced blend of authoritative sources, real-world interviews, and transparent modeling steps gives decision-makers a baseline that is both traceable and repeatable, reducing the risk of over- or under-estimating true market potential.


Key Questions Answered in the Report
How large is the emission monitoring systems market in 2026?
The market stands at USD 3.71 billion in 2026 and is projected to reach USD 5.12 billion by 2031.
Which region grows fastest through 2031?
The Middle East posts the quickest 8.19% CAGR, driven by refinery and petrochemical modernization mandates.
What technology segment is expanding most rapidly?
In-situ tunable diode laser spectroscopy is advancing at about 8.19% a year due to lower lifecycle cost in high-moisture environments.
Why are predictive emission monitoring systems gaining traction?
They reduce hardware capital by up to 50%, cut installation time from 12 weeks to 4 weeks, and now meet accuracy thresholds under evolving regulations.
What is the biggest restraint facing new installations in Europe?
A shortage of TÜV and MCERTS-certified technicians has doubled commissioning lead times to roughly 18 weeks.
Page last updated on:


