Carbon Management Software Market Size and Share
Market Overview
| Study Period | 2020 - 2031 |
|---|---|
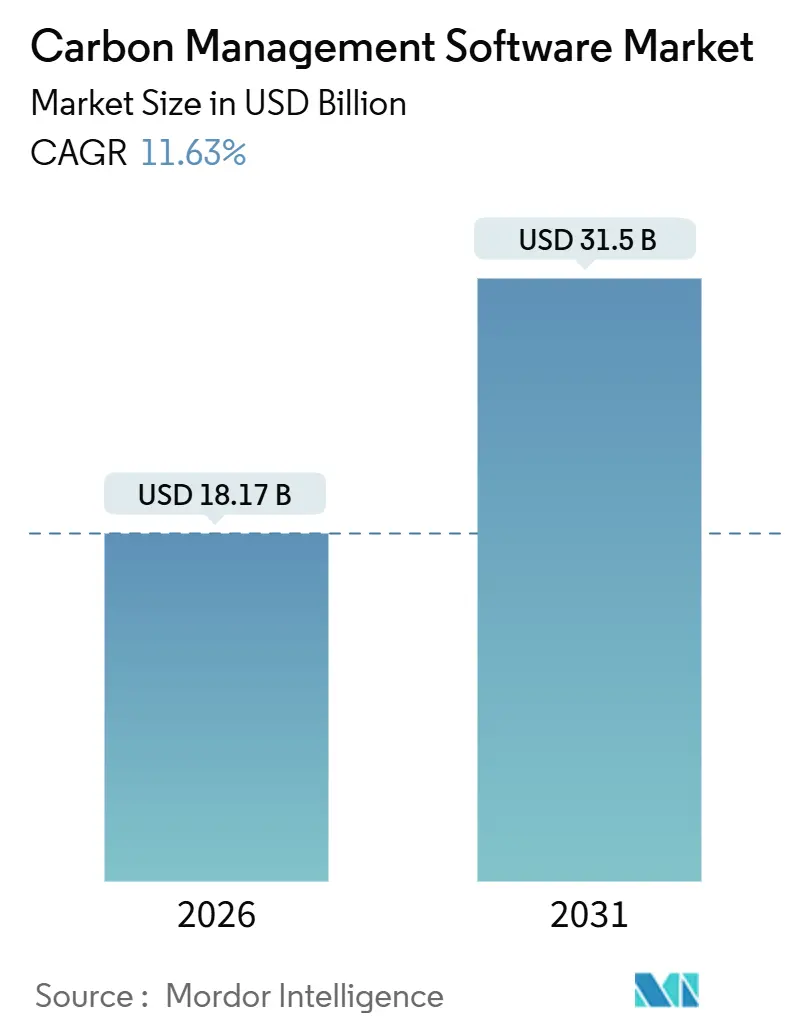
| Market Size (2026) | USD 18.17 Billion |
| Market Size (2031) | USD 31.5 Billion |
| Growth Rate (2026 - 2031) | 11.63% CAGR |
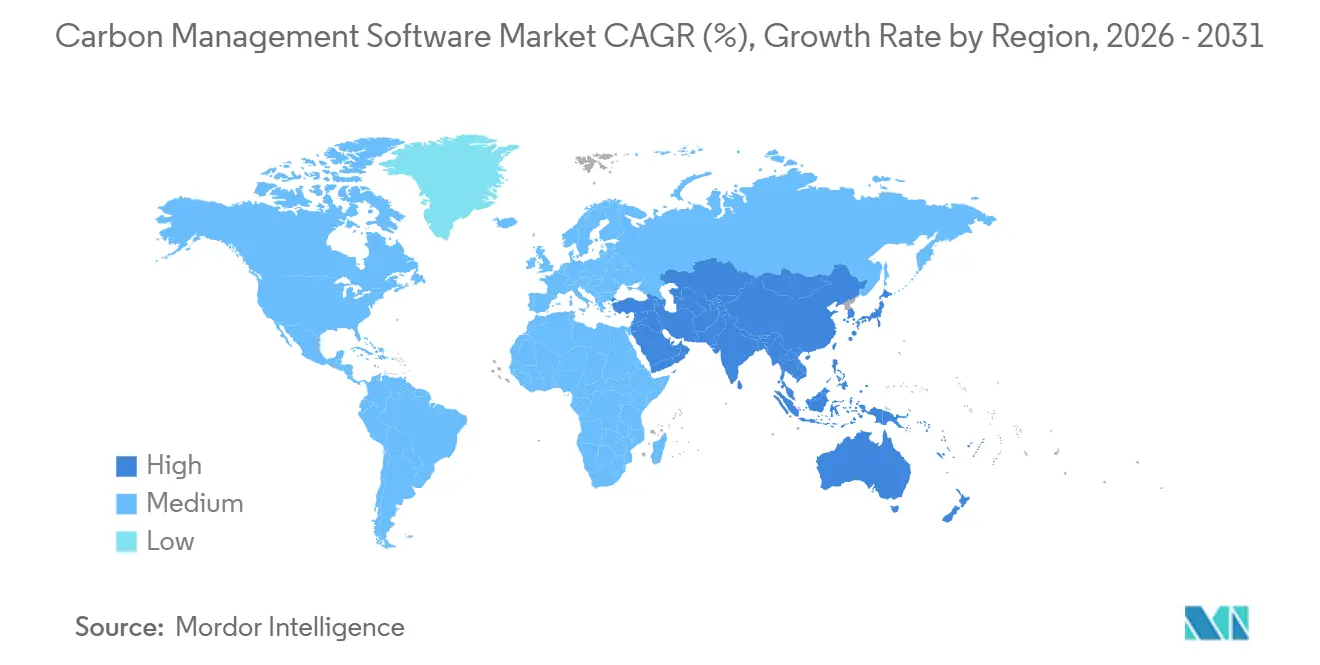
| Fastest Growing Market | Asia Pacific |
| Largest Market | North America |
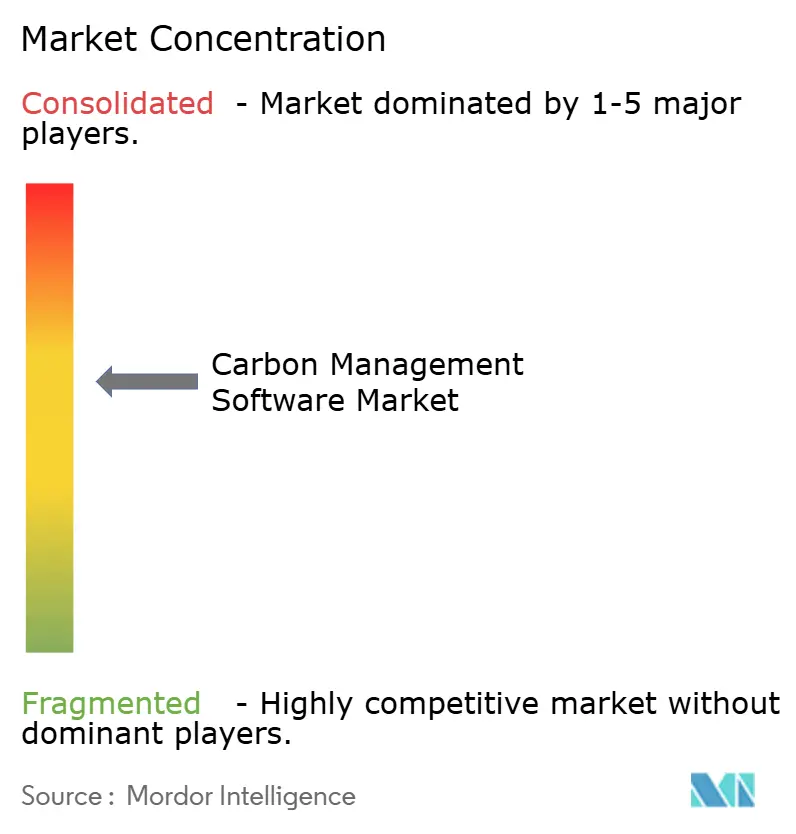
| Market Concentration | Medium |
Major Players *Disclaimer: Major Players sorted in no particular order Image © Mordor Intelligence. Reuse requires attribution under CC BY 4.0. | |
Carbon Management Software Market Analysis by Mordor Intelligence
The Carbon Management Software Market size is estimated at USD 18.17 billion in 2026, and is expected to reach USD 31.5 billion by 2031, at a CAGR of 11.63% during the forecast period (2026-2031).
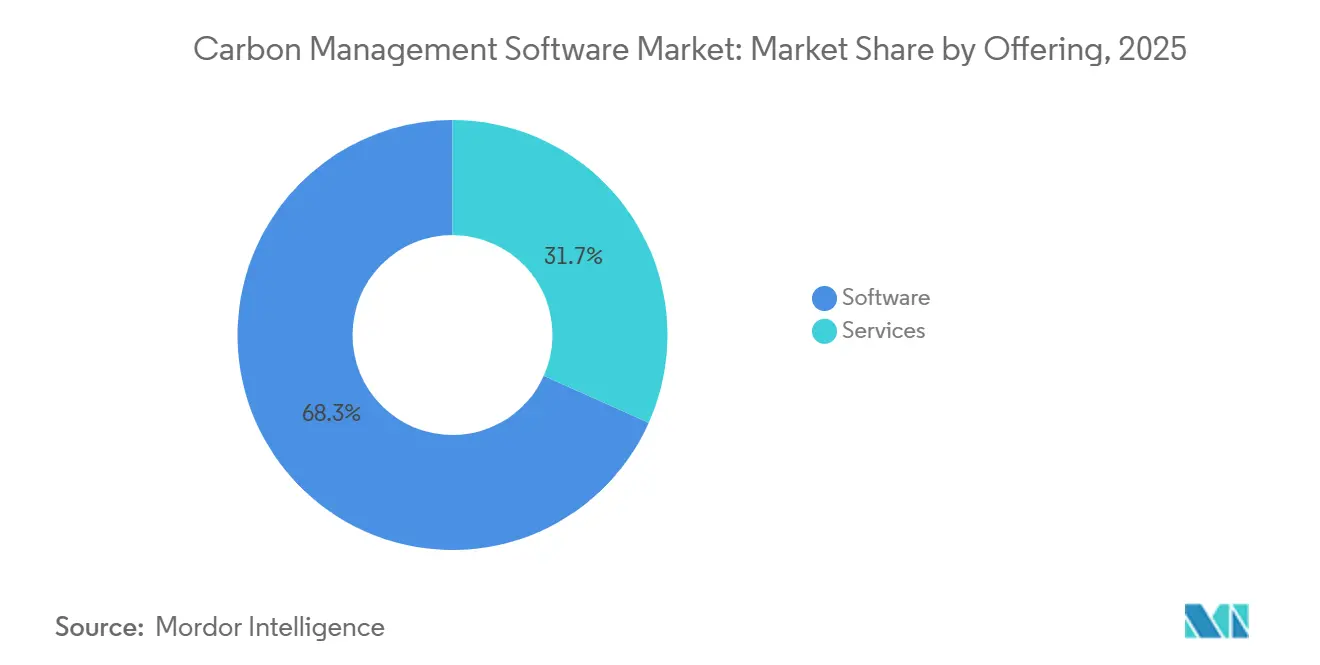
Rising disclosure mandates from the United States Securities and Exchange Commission and the European Union, coupled with investor demand for audit-grade emissions data, keep enterprise budgets focused on automated platforms that reduce assurance costs and unlock sustainability-linked finance[1]U.S. Securities and Exchange Commission, “Final Rule: The Enhancement and Standardization of Climate-Related Disclosures,” sec.gov. Software still accounted for 68.3% of 2025 revenue, but service engagements are growing faster as companies outsource complex Scope-3 data harmonization tasks. Cloud-first deployments captured 73.7% of the market share in 2025 because real-time application programming interfaces reduce manual data entry and lower the total cost of ownership for mid-market adopters. North America remains the largest buyer base, yet Asia-Pacific leads with the fastest regional CAGR, driven by China’s dual-carbon policy and India’s decarbonization roadmap.
Key Report Takeaways
- By offering, software led with 68.3% of the carbon management software market share in 2025, while services are projected to expand at a 12.1% CAGR through 2031.
- By deployment mode, cloud-based solutions commanded 73.7% of the carbon management software market in 2025 and are set to grow at an 11.9% CAGR through 2031.
- By application, energy management accounted for 27% of the carbon management software market in 2025, whereas sustainability modules are advancing at a 12.15% CAGR through 2031.
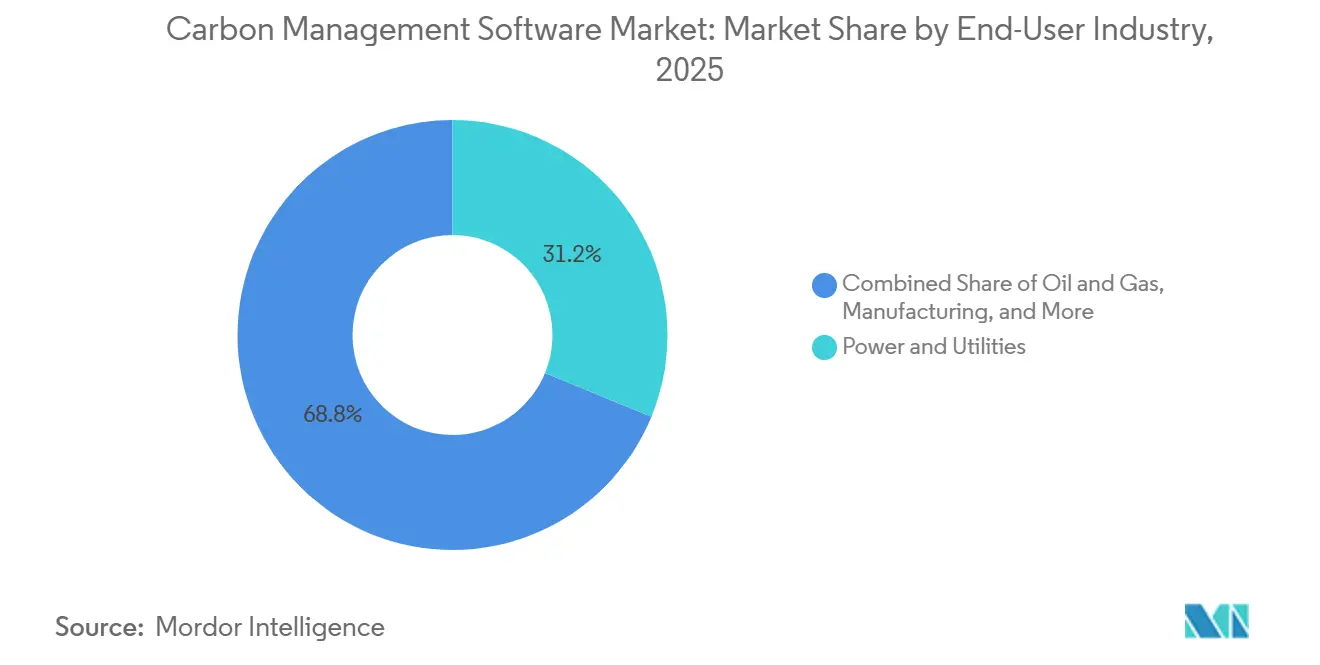
- By end-user industry, power and utilities led with a 31.2% revenue share in 2025; healthcare is the fastest-growing user segment, with a 12.65% CAGR to 2031.
- By organization size, large enterprises held 71.4% of 2025 spending, yet small and medium enterprises will post a 12.1% CAGR through 2031.
- By geography, North America retained 35.85% revenue share in 2025, but Asia-Pacific is on track for the quickest 11.85% CAGR during the forecast horizon.
Note: Market size and forecast figures in this report are generated using Mordor Intelligence’s proprietary estimation framework, updated with the latest available data and insights as of January 2026.
Global Carbon Management Software Market Trends and Insights
Drivers Impact Analysis*
| Driver | (~) % Impact on CAGR Forecast | Geographic Relevance | Impact Timeline |
|---|---|---|---|
| Stricter Carbon-Disclosure Regulations | +3.2% | North America and European Union | Short term (≤ 2 years) |
| Corporate Net-Zero Commitments and ESG Pressure | +2.8% | OECD markets, global supply chains | Medium term (2-4 years) |
| AI-Driven Scope-3 Data Harmonization | +2.1% | North America and Europe, spill-over to APAC | Medium term (2-4 years) |
| Cost Savings from Energy-Efficiency and Cloud Migration | +1.5% | Global, energy-intensive verticals | Short term (≤ 2 years) |
| Tokenized Carbon-Credit Integration | +0.9% | European Union and Singapore pilots | Long term (≥ 4 years) |
| Mandated Digital Product Passports | +1.1% | European Union, trading partners | Medium term (2-4 years) |
| Source: Mordor Intelligence | |||
Stricter Carbon-Disclosure Regulations
The March 2024 SEC rule triggered a 40% year-over-year surge in U.S. demand for audit-ready platforms during 1H 2025. Parallel pressure stems from the Corporate Sustainability Reporting Directive, which extends mandatory reporting to roughly 50,000 European companies starting with fiscal 2025 filings. Multinationals, therefore, need multi-tenant solutions that toggle between divergent jurisdictional templates without duplicating data collection. Early adopters embedding carbon metrics into quarterly close reports have 25% lower external assurance costs compared with spreadsheet-based late movers. Competitive advantage now hinges on how quickly a vendor updates rule libraries and maintains immutable audit trails for regulators and investors alike.
Corporate Net-Zero Commitments and ESG Pressure
More than 4,000 companies with a market capitalization of USD 70 trillion have set net-zero targets, yet fewer than 1 in 5 maintain inventories granular enough to track progress against interim milestones. Asset managers overseeing USD 130 trillion expect portfolio firms to disclose full Scope-3 emissions, making carbon transparency a capital-access prerequisite. Supplier portals that enable tier-one manufacturers to pull product-level data via standardized APIs are therefore proliferating, especially in automotive and consumer goods. Verified reductions unlock cheaper sustainability-linked loans, a market that exceeded USD 450 billion in new issuance during 2024. Brand and talent risks add another layer: a 2025 survey found 62% of millennials shun employers without credible decarbonization plans.
AI-Driven Scope-3 Data Harmonization
Scope-3 typically covers 70-90% of an organization’s footprint, but supplier data arrive in dozens of incompatible formats. Natural-language models now map unstructured invoices and bills of lading to activity-based emission factors, trimming data-collection time by 60% and shrinking error margins by up to 30 percentage points. Satellite imagery and IoT feeds further refine facility-level estimates, highlighting the 20% of suppliers responsible for 80% of embedded carbon. Banks price these insights into credit-risk covenants, so corporates using AI-powered systems have already secured loans 15-25 basis points cheaper than peers. Regulators endorse AI outputs only when they are explainable, pushing vendors to pursue ISO 14064 certification and publish transparent methodologies [2]ISO, “ISO 14064-1:2018,” iso.org.
Cost Savings from Energy-Efficiency and Cloud Migration
Energy costs account for 2-8% of operating expenses for manufacturers and data center operators. Real-time dashboards correlate production schedules with grid-emission factors, enabling demand-response strategies that shave 10-15% off utility bills within 18 months. Cloud software eliminates on-premise hardware spend and cuts IT overhead by roughly 40%, with subscription fees for mid-market adopters now as low as USD 15,000-USD 50,000 a year. Tenants also inherit the 100% renewable energy commitments of hyperscale providers, simplifying Scope 2 accounting.
Restraints Impact Analysis*
| Restraint | (~) % Impact on CAGR Forecast | Geographic Relevance | Impact Timeline |
|---|---|---|---|
| High Implementation and Integration Costs for SMEs | -1.8% | Global, acute in emerging markets | Short term (≤ 2 years) |
| Data-Accuracy and Standardization Challenges | -1.2% | Global, highest fragmentation in APAC supply chains | Medium term (2-4 years) |
| Vendor Lock-In Risk from Proprietary Factors | -0.7% | North America and Europe | Long term (≥ 4 years) |
| Cyber-Security Liabilities in Audit Trails | -0.5% | Global, especially regulated sectors | Medium term (2-4 years) |
| Source: Mordor Intelligence | |||
High Implementation and Integration Costs for SMEs
Initial outlays range from USD 50,000 to USD 200,000, once integration and training are included, equal to 2-5% of a firm's annual IT budget for firms with fewer than 500 staff. Custom APIs for legacy enterprise resource planning platforms can add 30-50% to project costs and push payback beyond 12 months. Limited in-house sustainability talent forces reliance on consultants billing USD 150-USD 300 per hour, while the absent of interval-metered energy data inflates uncertainty in reported footprints. Freemium tiers and modular pricing are emerging, but financing programs still focus on physical assets rather than software subscriptions, slowing uptake among capital-constrained firms.
Data-Accuracy and Standardization Challenges
Spend-based factors can deviate 20-40% from supplier-specific realities, leaving executive teams wary of basing strategy on noisy data. Divergent frameworks, including Greenhouse Gas Protocol, ISO 14064, and the Partnership for Carbon Accounting Financials, force multi-jurisdiction filers to reconcile several methodologies at once, a top-three headache for 45% of sustainability managers surveyed in 2025[3]Partnership for Carbon Accounting Financials, “Global GHG Standard for the Financial Industry,” carbonaccountingfinancials.com. Suppliers, fearing exposure of proprietary processes, often withhold primary data, locking buyers into generic averages and raising litigation risk for potential greenwashing. Blockchain-based provenance tools promise immutable records, yet interoperability remains unproven, and adoption is limited to pilot projects.
*Our forecasts treat driver/restraint impacts as directional, not additive. The impact forecasts reflect baseline growth, mix effects, and variable interactions.
Segment Analysis
By Offering: Services Gain as Scope-3 Complexity Escalates
Services captured 31.7% of 2025 revenue, but they are forecast to post the fastest 12.1% CAGR, as enterprises outsource data engineering and assurance tasks that internal teams struggle to staff. API build work, ERP connector setup, and data migration account for roughly 40% of service billings. Managed services are growing because resource-constrained companies prefer vendors that keep their emission-factor libraries up to date and prepare filings. Training and change-management support drive user adoption rates above 80% in successful rollouts. Outcome-based pricing that links fees to verified reductions is taking hold, though measurement and attribution remain contentious. As these models mature, the carbon management software market sees service providers embedding themselves in long-term client workflows rather than on one-off projects, boosting visibility into recurring revenue.
The consulting component commands premium rates when multinationals juggle U.S., EU, and Asia-Pacific regulations. Third-party assurance is a high-growth niche because investors now demand independent verification under the Corporate Sustainability Reporting Directive. Combined, these trends elevate services from a supporting role to a central growth lever, widening the total addressable market for carbon management software.


By Deployment Mode: Cloud Dominance Mirrors the API Economy
Cloud installations accounted for 73.7% of 2025 billings and are expected to maintain an 11.9% CAGR through 2031. Multi-tenant architectures cut per-user costs by up to 60% and automatically update the rule library, keeping customers current with evolving disclosure frameworks. Hyperscale infrastructure also supplies the compute needed for AI-driven Scope-3 estimation and real-time analytics. For regulated utilities and banks subject to data-residency mandates, hybrid models store sensitive operational data on-premise while dispatching anonymized aggregates to the cloud for processing. Although on-premises still holds a 26.3% share, its footprint shrinks each year as vendors announce the end of life for perpetual licenses, offering migration credits to cushion the transition. This shift keeps the carbon management software market aligned with broader enterprise-software trends toward subscription revenue and continuous delivery.
Edge deployments are gaining traction in steel and chemicals, where latency-free insights optimize furnace loads and cut energy waste by 10-15%. As 5G networks mature, vendors expect edge-native modules to free heavy industry from bandwidth constraints. Nonetheless, cloud remains the backbone because supply-chain data aggregation and investor reporting need globally accessible platforms.
By Application: Sustainability Modules Accelerate on Circular-Economy Rules
Energy management held 27% of 2025 demand, reflecting immediate cost-savings potential. Greenhouse-gas inventory modules form the regulatory core, but sustainability add-ons, including life-cycle assessment, water and waste tracking, and biodiversity impact, register the fastest 12.15% CAGR thanks to the European Union’s 2026 digital product passport mandate. Cross-application analytics connect emissions, cost, and risk data, enabling CFOs to hard-wire decarbonization metrics into capital-allocation models. Air-quality tracking remains niche, yet industrial emitters integrate criteria pollutant data to meet national ambient air quality standards and avoid fines. Overall, the carbon management software market enjoys a tailwind as customers migrate from single-purpose tools to integrated suites that bring financial and environmental performance together.
Vendors now pre-package sector-specific libraries for batteries, textiles, and electronics to speed compliance. Early pilots show 30% faster Scope-3 data-collection cycles when digital passports are embedded at product-code level. As these features mature, sustainability modules are poised to overtake energy management as the strategic growth engine of the carbon management software market.
By End-User Industry: Healthcare Emerges as the Fastest-Growing Buyer
Power and utilities delivered 31.2% of 2025 spending because regulators require continuous monitoring and public disclosure. Oil and gas majors follow closely, using methane-tracking functions to protect access to capital. Manufacturing firms adopt carbon management software to stay ahead of carbon border tariffs and to satisfy downstream customers who increasingly audit supplier footprints. Healthcare, however, shows the fastest 12.65% CAGR as hospital groups tackle anesthetic gas emissions and pharmaceutical firms wrestle with cold-chain and clinical-trial logistics. Information-technology providers rely on detailed data-center metrics to prove progress toward climate pledges demanded by enterprise clients.
Transportation and logistics companies embed route-optimization APIs to cut fuel burn, while construction players model embodied carbon to win green building certifications. Retail, hospitality, and professional-services firms round out demand, driven less by regulation and more by reputational and supply-chain pressures. Each vertical’s specific pain points push vendors toward specialized templates, reinforcing the depth of segmentation in the carbon management software market.

By Organization Size: SMEs Close the Functionality Gap
Large enterprises accounted for 71.4% of 2025 revenue, reflecting complex multi-entity reporting needs and bigger budgets. Annual subscriptions can top USD 1 million when thousands of users feed data from dozens of ERP instances. Small and medium enterprises, though still a minority share, will post the quickest 12.1% CAGR because modular SaaS tiers strip back features to essentials and reduce integration overhead. Supplier mandates accelerate this dynamic: 60% of surveyed small manufacturers say tier-one customers now require emissions data as a contract condition. Government programs such as the U.S. Department of Energy’s Better Buildings Initiative offer co-funding but remain underutilized.
Vertical point solutions aimed at craft breweries or regional logistics providers show that one-click templates and pre-loaded emission factors can cut implementation from months to weeks. As freemium tiers mature, the carbon management software industry expects SME adoption curves to steepen, broadening the user base and diversifying revenue streams beyond Fortune 500 heavyweights.
Geography Analysis
North America retained 35.85% of 2025 turnover, buoyed by early regulatory moves and abundant venture capital that accelerated the formation of start-ups in climate analytics. Large U.S. corporates devote USD 2-USD 5 million annually to carbon-IT stacks, and Canada’s federal carbon-pricing framework keeps domestic demand resilient. Yet the carbon management software market is seeing a shift in momentum toward the East.
Europe held a roughly 30% share on the back of the Corporate Sustainability Reporting Directive and the looming Carbon Border Adjustment Mechanism, which forces exporters to document cradle-to-gate emissions or face tariffs[4]European Commission, “Corporate Sustainability Reporting Directive,” ec.europa.eu. Germany, the United Kingdom, and France account for 60% of regional spend, as headquarters functions centralize data governance. The directive’s extraterritorial reach nudges non-EU suppliers toward compatible platforms, indirectly enlarging market scope.
Asia-Pacific is the fastest riser with an 11.85% CAGR, propelled by China’s dual-carbon goals and India’s energy-transition roadmap. Japan’s Green Transformation Fund and South Korea’s emissions-trading obligations add further pull. Association of Southeast Asian Nations members, led by Singapore, mandate reporting for listed companies, spurring adoption across export-oriented supply chains. Australia and New Zealand already show uptake levels akin to those in North America, thanks to long-standing cap-and-trade schemes.
South America accounts for 8% of revenue, led by Brazil’s deforestation monitoring and Argentina’s renewable build-out. The Middle East and Africa contribute 10%, anchored by net-zero pledges from Gulf energy giants and carbon-tax frameworks in South Africa and Nigeria. Though smaller bases temper absolute revenues, both regions show above-average pipeline growth as energy diversification policies and investor scrutiny converge.

Competitive Landscape
The top five vendors, IBM, SAP, Microsoft, Schneider Electric, and Salesforce, controlled about 40% of 2025 revenue, signaling moderate concentration. Each bundle combines emissions modules with existing enterprise suites, exploiting installed bases to cross-sell at marginal cost. Specialized entrants, including Persefoni, Watershed, and Plan A, attack white spaces such as AI-driven Scope-3 automation and vertical-specific templates for heavy industry.
Strategic alliances between tech vendors and consultancies (for example, Deloitte-Microsoft and PwC-Salesforce tie-ups) deliver one-stop implementation and assurance, lifting switching barriers. Eighteen M&A deals valued at USD 50 million or more closed in 2024-2025, as incumbents acquired point solutions for life-cycle assessment and supply-chain analytics. Blockchain-based provenance tools and tokenized offset settlement layers differentiate early movers, though regulatory clarity and interoperability standards remain nascent.
Open-source coalitions like the Linux Foundation’s Green Software Foundation push interoperable schemas, curbing vendor lock-in but also seeding service opportunities. Hard-to-abate sectors, cement, steel, and maritime, remain underserved, inviting niche specialists to tailor process-optimization algorithms and emissions-factor libraries. Competitive intensity, therefore, rests on innovation velocity and ability to prove audit-grade accuracy rather than on pricing alone, shaping the future arc of the carbon management software market.
Carbon Management Software Industry Leaders
Simble Solutions Ltd
IBM Corporation
ENGIE Impact
GreenStep Solutions Inc.
SAP SE
- *Disclaimer: Major Players sorted in no particular order

Recent Industry Developments
- December 2025: Diginex, a sustainability-focused RegTech company, has signed a non-binding memorandum of understanding (MOU) to acquire Plan A, a provider of software for carbon measurement, reporting, and reduction. The transaction aims to establish a comprehensive AI-powered platform for ESG and carbon management.
- October 2025: Greenly, a climate data solutions provider launched EcoPilot, a platform developed to simplify and accelerate carbon accounting processes for businesses by utilizing AI and language model technologies.
- August 2025: Gravity, a carbon management platform, has introduced an Energy Management Marketplace designed to help customers efficiently identify opportunities to reduce energy consumption and costs.


Research Methodology Framework and Report Scope
Market Definitions and Key Coverage
Our study treats the carbon management software market as all packaged platforms and modules that track, calculate, reduce, or report organizational greenhouse-gas emissions across Scopes 1-3, whatever the underlying accounting standard or sectoral template may be. We cover revenues from new licenses, subscription fees, and managed software services that embed such functionality across all industries and regions.
Scope exclusion: Stand-alone consulting assignments, voluntary-credit trading volumes, and hardware-only metering devices fall outside this software-centric boundary.
Segmentation Overview
- By Offering
- Software
- Services
- By Deployment Mode
- Cloud-Based
- On-Premise
- By Application
- Energy
- Greenhouse Gas Management
- Air Quality Management
- Sustainability
- Other Applications
- By End-User Industry
- Oil and Gas
- Manufacturing
- Healthcare
- IT and Telecom
- Power and Utilities
- Transportation and Logistics
- Construction and Infrastructure
- Other End-User Industries
- By Organization Size
- Large Enterprises
- Small and Medium Enterprises
- By Geography
- North America
- United States
- Canada
- Mexico
- South America
- Brazil
- Argentina
- Rest of South America
- Europe
- Germany
- United Kingdom
- France
- Italy
- Spain
- Russia
- Rest of Europe
- Asia-Pacific
- China
- Japan
- India
- South Korea
- ASEAN
- Australia and New Zealand
- Rest of Asia-Pacific
- Middle East and Africa
- Middle East
- Saudi Arabia
- United Arab Emirates
- Turkey
- Rest of Middle East
- Africa
- South Africa
- Nigeria
- Rest of Africa
- Middle East
- North America
Detailed Research Methodology and Data Validation
Primary Research
Mordor analysts interviewed sustainability officers in energy, manufacturing, retail, and logistics firms across North America, Europe, and Asia-Pacific, along with regional implementation partners and cloud-platform product managers. These conversations validated typical user counts, cloud-to-on-premise migration rates, and realistic price bands before we finalized assumptions.
Desk Research
We began with public datasets, UNFCCC emissions inventories, IEA energy balances, Eurostat environmental accounts, US EPA greenhouse-gas factors, and CDP disclosure trends, which frame the potential user base and intensity of reporting requirements. Company 10-Ks, SEC filings, and sustainability reports helped benchmark prevailing software spend by heavy emitters. Trade associations such as the Software Alliance and WBCSD clarified adoption barriers, while patent abstracts from Questel revealed emerging AI-enabled scope-3 calculators. To refine volumes and pricing, analysts extracted shipment codes from Volza, license counts from open-source repos, and headline vendor revenues reported in financial press retrieved through Dow Jones Factiva. The sources above are illustrative; many additional public and paid references fed our desk analysis.
Market-Sizing & Forecasting
A top-down reconstruction converts sectoral carbon-reporting obligations and firm counts into an addressable demand pool, which is then stress-tested through selective bottom-up checks such as averaged annual-subscription price multiplied by installed-base estimates. Key variables include the number of reporting entities under emerging SEC/EU-CSRD rules, cloud adoption ratio, average seats per deployment, corporate net-zero target penetration, and regional GDP growth. A multivariate regression ties revenue growth to these drivers and projects through 2030; outliers are adjusted where primary feedback contradicts historical elasticity.
Data Validation & Update Cycle
Outputs pass a three-layer review: automated anomaly flags, peer-analyst cross-checks, and a senior sign-off. Models refresh annually, with interim tweaks whenever material policy shifts or sizeable vendor acquisitions surface. Clients therefore receive the freshest validated baseline.
Why Our Carbon Management System Baseline Commands Trust
Published figures often vary because firms slice the market by differing solution stacks, deployment modes, or regulatory coverage windows.
Key gap drivers include narrower component scope, single-region sampling, aggressive penetration ramps, or static currency conversions used by other publishers, whereas Mordor combines multi-tier software scope with annual FX averaging and dual-track model corroboration.
Benchmark comparison
| Market Size | Anonymized source | Primary gap driver |
|---|---|---|
| USD 16.11 B (2025) | Mordor Intelligence | - |
| USD 15.07 B (2025) | Global Consultancy A | Excludes managed software services; relies on vendor surveys from only five countries |
| USD 20.37 B (2024) | Industry Journal B | Applies uniform 22% CAGR from 2021 without segment checks |
| USD 22.51 B (2025) | Regional Consultancy C | Counts advisory fees and offset-trading portals inside software revenues |
In sum, by anchoring estimates to clearly defined software revenues, verified adoption ratios, and continuous validation loops, Mordor Intelligence delivers a balanced, reproducible baseline that decision-makers can rely on with confidence.


Key Questions Answered in the Report
What is the projected value of the carbon management software market by 2031?
The market is expected to hit USD 31.5 billion by 2031, up from USD 18.17 billion in 2026.
Which deployment model is growing fastest?
Cloud-based solutions lead, holding 73.7% share in 2025 and advancing at an 11.9% CAGR through 2031.
Why are services outpacing software in growth?
Enterprises are outsourcing Scope-3 data engineering and third-party assurance, driving a 12.1% CAGR for services.
Which region shows the highest forecast CAGR?
Asia-Pacific, supported by China’s dual-carbon policy and India’s transition plan, posts an 11.85% CAGR over the outlook period.
How concentrated is the vendor landscape?
The top five players hold roughly 40% of revenue, indicating moderate concentration with room for niche entrants.
What restrains adoption among SMEs?
Up-front integration costs of USD 50,000-USD 200,000 and limited in-house expertise slow uptake, though modular SaaS tiers are easing barriers.
Page last updated on:


