
Scandinavia Self-Storage Market Size and Share
Market Overview
| Study Period | 2020 - 2031 |
|---|---|
| Forecast Data Period | 2026 - 2031 |
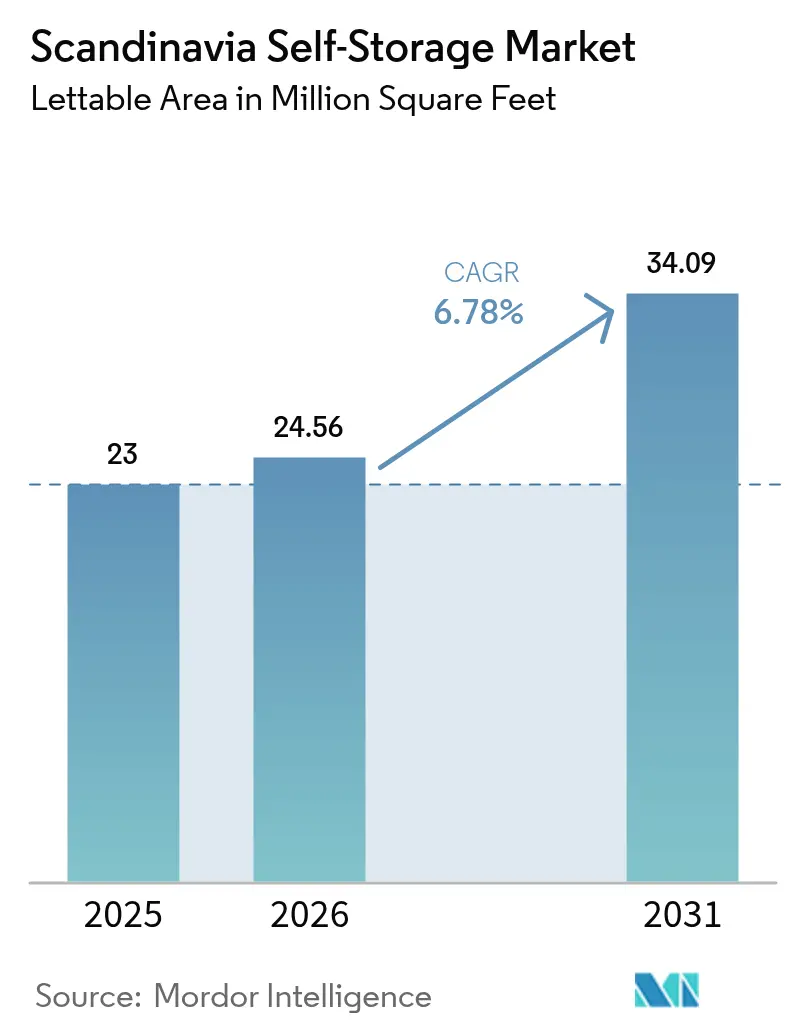
| Base Year Market Size (2025) | 23 Million square feet |
| Market Volume (2026) | 24.56 Million square feet |
| Market Volume (2031) | 34.09 Million square feet |
| Growth Rate (2026 - 2031) | 6.78 % |
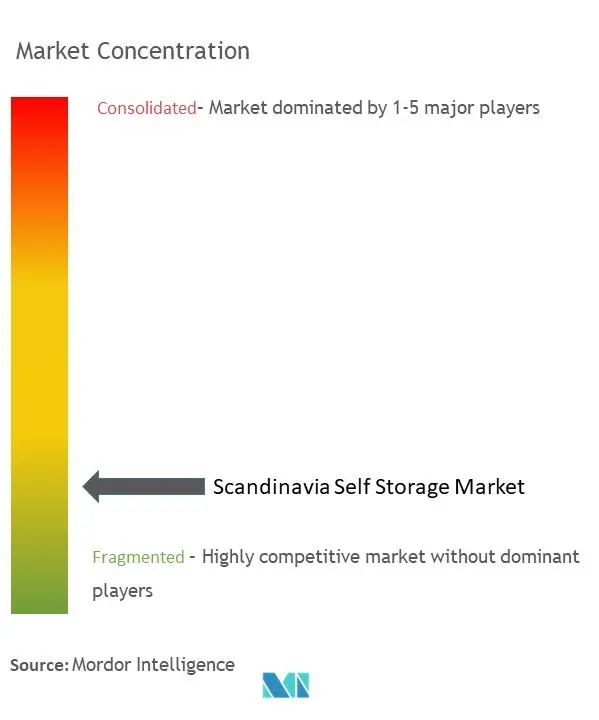
| Market Concentration | Low |
Major Players *Disclaimer: Major Players sorted in no particular order Image © Mordor Intelligence. Reuse requires attribution under CC BY 4.0. | |
Scandinavia Self-Storage Market Analysis by Mordor Intelligence
Scandinavia Self-Storage Market size in 2026 is estimated at 24.56 million sq ft, growing from 2025 value of 23 million sq ft with 2031 projections showing 34.09 million sq ft, growing at 6.78% CAGR over 2026-2031. Strong urbanization, tight housing supply, and high e-commerce adoption continue to underpin demand for flexible storage, while institutional capital inflows accelerate the professionalization of operations. Digital-first customer journeys, premium climate-controlled offerings, and asset-light leasing models are widening revenue opportunities for operators. Technology-enabled access control, smart HVAC systems, and sustainability certifications are further differentiating leading brands. Growing cross-border logistics complexity between EU members and Norway, coupled with circular-economy initiatives, provides fresh niches for business-to-business clients.
Key Report Takeaways
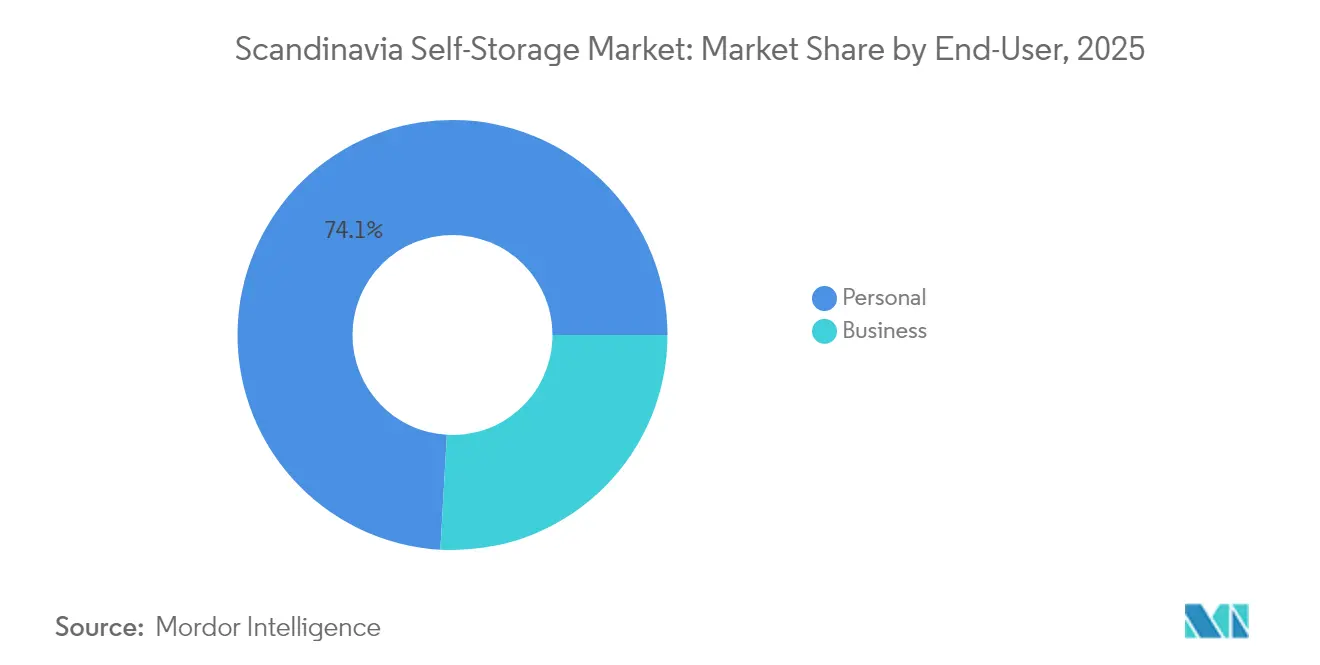
- By end-user, personal customers held 74.10% of Scandinavia self-storage market share in 2025. By end-user, business users are projected to register a 7.88% CAGR through 2031.
- By storage size, units below 40 sq ft accounted for 58.10% of the Scandinavia self-storage market size in 2025. By storage size, the same compact category is set to expand at a 7.52% CAGR between 2026-2031.
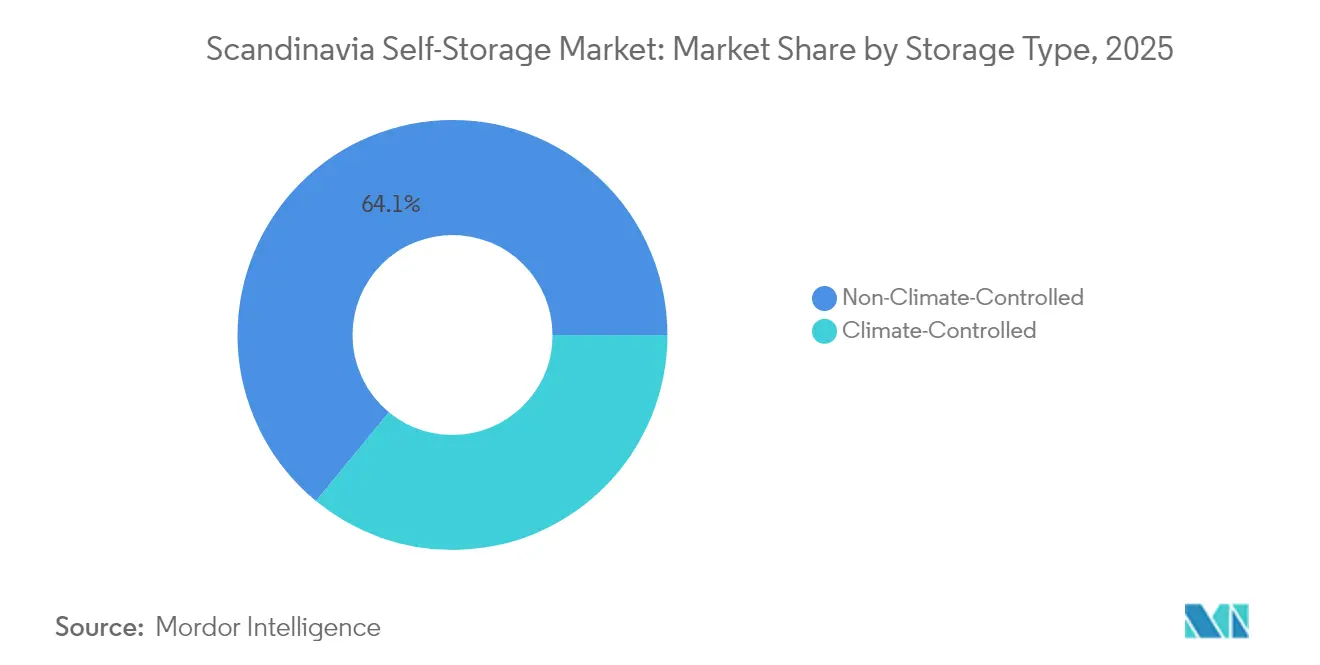
- By storage type, non-climate-controlled facilities retained 64.05% revenue share in 2025 in the Scandinavia self-storage market, while climate-controlled units are advancing at a 7.71% CAGR through 2031.
- By ownership, owned facilities represented 71.10% of revenue in 2025 in the Scandinavia self-storage market; leased sites are growing at a 7.76% CAGR through 2031.
Note: Market size and forecast figures in this report are generated using Mordor Intelligence’s proprietary estimation framework, updated with the latest available data and insights as of 2026.
Market Trends and Insights
Drivers Impact Analysis of Scandinavia Self-Storage Market*
| Driver | (~) % Impact on CAGR Forecast | Geographic Relevance | Impact Timeline |
|---|---|---|---|
| Urbanisation and Smaller Living Spaces | +1.8% | Sweden, Norway, Denmark capitals | Medium term (2-4 years) |
| High E-commerce Penetration Driving SME Inventory Needs | +1.2% | Global, strongest in Finland and Sweden | Short term (≤ 2 years) |
| Rising Housing Mobility and Rental Turnover | +1.0% | Stockholm, Oslo, Copenhagen metro areas | Medium term (2-4 years) |
| Institutional Capital Seeking Yield-Stabilised Assets | +0.9% | Nordic region, spillover to continental Europe | Long term (≥ 4 years) |
| Sustainability-Linked Conversions of Retail/Industrial Boxes | +0.7% | Urban Scandinavia, regulatory compliance zones | Long term (≥ 4 years) |
| Municipal Incentives to Repurpose Underground Parking | +0.5% | Stockholm, Oslo, Copenhagen city centers | Medium term (2-4 years) |
| Source: Mordor Intelligence | |||
Urbanization and Smaller Living Spaces
Population growth has concentrated in 30 Nordic urban areas, lifting density and shrinking average apartment sizes.[1]Nordregio, “Challenges for Nordic Urban Areas,” nordregio.org Oslo recorded a 22.5% density uptick over two decades, while Stockholm followed a similar trajectory. Constrained space pushes households toward external storage, especially as Norwegian home prices rose 7.3% YoY in early 2025. Swedish construction costs outpacing land values further compress unit footprints. Denmark’s 25% affordable-housing rule limits unit size, compounding demand across income levels.
High E-Commerce Penetration Driving SME Inventory Needs
Online purchasing rates of 97-99% stretch Nordic delivery networks, creating micro-fulfillment requirements for SMEs. Finnish consumers’ preference for parcel lockers drives distributed storage nodes that double as last-mile hubs. PostNord’s heavy parcel-box investment offers partnership paths for operators. EU-mandated 14-day returns and Norway’s comparable consumer-protection rules produce predictable reverse-logistics peaks requiring overflow space. Seasonal surges in clothing, electronics, and cosmetics underline the business segment’s need for flexible contracts.
Rising Housing Mobility and Rental Turnover
Buy-to-let participation accelerates price cycles and pushes tenants through more frequent moves, increasing short-term storage usage. Tourism-driven short-rentals in Reykjavík and Stockholm create turnover that aligns with month-to-month self-storage terms. Nordic universities’ accommodation gaps, including Norway’s 14,000-bed shortfall, stimulate demand during academic transitions. Regional migration from capitals to secondary towns, tracked by Newsec, generates storage needs at both ends.
Institutional Capital Seeking Yield-Stabilized Assets
Non-listed investors shifted 78% of 2024 allocations toward value-added plays, spotlighting self-storage for its cash-flow durability. Public Storage’s 35% holding in Shurgard and EUR 150 million note issue underscore confidence. Serial-acquirer roadmaps from Lifco and Teqnion give self-storage consolidators proven templates.
Restraints Impact Analysis of Scandinavia Self-Storage Market*
| Restraint | (~) % Impact on CAGR Forecast | Geographic Relevance | Impact Timeline |
|---|---|---|---|
| Scarcity and High Cost of Zoned Urban Land | -1.4% | Stockholm, Oslo, Copenhagen city centers | Long term (≥ 4 years) |
| Stringent Heritage-District Building Regulations | -0.8% | Historic city centers across Scandinavia | Medium term (2-4 years) |
| Escalating Construction and Fit-out Costs | -1.1% | Nordic region, acute in Sweden and Norway | Medium term (2-4 years) |
| Cultural Reliance on Basement/Attic Storage in Rural Areas | -0.6% | Rural Sweden, Norway, Denmark | Long term (≥ 4 years) |
| Source: Mordor Intelligence | |||
Scarcity and High Cost of Zoned Urban Land
Compact-city policies prioritize residential or mixed-use projects, pushing storage developers to peripheral sites where accessibility is weaker. Prime Oslo yields widened to 4.7% amid financing cost hikes, dampening acquisition appetite.[2]Entra ASA, “Annual Report 2023,” entra.no Competition from data centers and logistics centers inflates industrial-zone values, squeezing margins and prolonging timelines.
Stringent Heritage-District Building Regulations
Fire-safety mandates, façade preservation and height limits complicate adaptive reuse in historic centers. Norwegian rules demand documented fire-prevention systems and ongoing maintenance. Swedish certification standards require materials that meet SS-ISO 1182 and EN 13501-1 thresholds, lifting capital expenditure. Long approval cycles create uncertainty for midsize operators lacking deep capital pools.
*Our forecasts treat driver/restraint impacts as directional, not additive. The impact forecasts reflect baseline growth, mix effects, and variable interactions.
Scandinavia Self-Storage Market Segment Analysis
By End-User:
Personal Storage Holds the Lead while Business Verticals AcceleratePersonal customers accounted for 74.10% of the Scandinavia self-storage market size in 2025, a share rooted in high housing costs and shrinking dwelling footprints. The segment grows in tandem with frequent relocations and student moves, particularly in the capitals. Pricing models emphasize small-unit formats and month-to-month flexibility that align with consumer cash-flow patterns. Operators employ app-based access and bundled moving supplies to enhance stickiness.
Business users, although smaller, are forecast to log an 7.88% CAGR through 2031. E-commerce SMEs leverage units as micro-fulfillment nodes for returns and seasonal stock peaks. Regulatory return periods and cross-border VAT reconciliation amplify the need for local inventory buffers. Operators respond with 24/7 loading bays, integrated parcel services, and short-commitment contracts, broadening the Scandinavia self-storage market’s addressable base.



By Storage Size:
Compact Units Anchor Revenue and GrowthUnits below 40 sq ft captured 58.10% of Scandinavia self-storage market share in 2025, reflecting customer sensitivity to price per month and the prevalence of apartment living. The category is projected to post a 7.52% CAGR, buoyed by dynamic partitioning technologies that let operators adjust mix ratios in real time. Compact formats also underpin lockers designed for click-and-collect partnerships with logistics groups.
Larger units serve SME inventory and recreational-gear storage, generating higher absolute rents but lower occupancy turnover. Operators use tiered pricing, insurance upsells and ancillary services such as shelving installation to defend yields. Double-stacked designs in dense districts help extract additional lettable volume without new land take, strengthening overall profitability inside the Scandinavia self-storage market.
By Storage Type:
Climate-Controlled Facilities Capture PremiumNon-climate-controlled space retained 64.05% revenue in 2025 due to lower build-out costs and broad suitability for household goods. Yet demand for temperature-managed environments is accelerating at an 7.71% CAGR as customers store electronics, art and documents vulnerable to Nordic winter swings. Heat-pump installations, widely adopted across the region, slash energy bills and support ESG narratives.
Climate-controlled sites command rate premiums of 15-25% and often attract longer average lengths of stay. Operators integrate sensor-driven monitoring and automated ventilation to comply with ISO 14001 standards. Such differentiation enlarges the Scandinavia self-storage market size by tapping price-insensitive client segments and institutional investors seeking green-certified assets.
By Ownership Pattern:
Leased Assets Fuel Faster Footprint ExpansionOwned facilities made up 71.10% of lettable area in 2025, aligning with institutional appetite for hard real-estate exposure. Long holding periods secure rental inflation capture and collateralize bond placements. Operators adopt modular construction to shorten time-to-cash-flow and accommodate phased expansions.
Leased facilities, while still niche, are on track for an 7.76% CAGR through 2031. The model lowers upfront capital and accelerates entry into supply-constrained urban nodes. Lease-indexed rents and triple-net structures mitigate operating risk. Hybrid portfolios blend owned flagships with leased satellites to optimize balance-sheet leverage and market responsiveness, reinforcing competitiveness in the Scandinavia self-storage market.
Geography Analysis
Nordics Self-Storage Market
Stockholm, Oslo and Copenhagen dominate demand as urban densification squeezes in-home storage capacity. Sweden leads supply with established operators such as Shurgard’s 36 facilities, complemented by on-demand newcomer Ztorage, which prices units at SEK 399-1,999 per month. Regulatory clarity, robust digital infrastructure and high consumer openness to subscription services reinforce Sweden’s primacy.
Norway Self-Storage Market
Norway shows the highest near-term growth potential, buoyed by 7.3% YoY home-price inflation and structural housing deficits. National fire-safety rules provide standardized development pathways, lowering compliance ambiguity for investors. Municipal incentives to retrofit garages into storerooms are broadening inner-city inventory, expanding the Scandinavia self-storage market footprint across Oslo’s ring districts.
Northern Europe Self-Storage Market
Denmark and Finland leverage advanced e-commerce ecosystems. Parcel-locker saturation invites joint-venture models between storage brands and logistics firms. Helsinki’s Underground Master Plan facilitates subterranean projects that free scarce surface land. Iceland remains nascent but tourism-linked demand for seasonal gear storage and limited domestic competition hint at future niche openings.
Regulatory Landscape
Self-storage development and operations across Scandinavia are shaped by national building and fire-safety regimes, notably Norway's Regulations on Technical Requirements for Building Works (TEK) administered via DiBK guidance, and Denmark's BR18 building regulations that govern building performance, safety, and approvals for conversions and new builds. Where operators pursue adaptive reuse in heritage-sensitive or dense urban districts, permitting cycles tend to run longer and compliance requirements tighten around facades, fire compartmentation, and access/egress. This affects project timelines and fit-out specifications.
On the service and commercial side, operators commonly align processes to the European self-storage service standard SS-EN 15696:2008 for baseline operating and customer transparency practices. In Sweden, a March 2026 advance ruling from Skatterattsnamnden clarified VAT treatment for renting non-permanent, foundation-placed self-storage containers, which feeds into cost modeling for modular, quickly deployable capacity. For digital-first operators using online booking, e-signing, and remote access, EU-wide digital rules such as the Digital Services Act (DSA) introduce additional compliance considerations around platform accountability and transparency when storage is marketed and transacted through intermediary-like digital interfaces.
Value Chain Analysis
The Scandinavia self-storage value chain starts with site sourcing and entitlement, typically through acquisitions of urban assets for conversion or through leasing strategies for satellite sites. It then moves through design, fit-out, and commissioning. Upstream inputs include modular partitioning systems, doors and locks, HVAC and humidity control for climate-managed units, fire-safety systems, and security hardware. Technology vendors carry more weight than in traditional real estate operations because many facilities run with low staffing, relying on cloud-based facility management software, digital identity checks, mobile access control, and IoT monitoring to maintain service levels.
Midstream activities focus on remote operations and revenue management, including digital marketing and lead capture, online reservations and contracting, dynamic pricing, payments, and customer support. These functions are increasingly delivered through integrated property management, CRM, and finance stacks. Downstream, personal customers use app-based 24/7 access and self-service onboarding, while business users tend to require flexible invoicing, more frequent access, and occasional last-mile or returns handling. Specialist models such as Flexistore in Norway show how proprietary lock and sensor hardware, paired with standardized micro-site deployment, can speed up rollouts and also create a practical barrier for smaller entrants through the software-hardware integration layer.
Competitive Landscape
Pan-European operators continue to consolidate capacity, resulting in moderate concentration. Shurgard commands the largest share, operating 337 European sites totaling 1.7 million m², with Sweden and Denmark forming key Nordic clusters. Digital engagement metrics reveal 90% of prospects connect online and 50% finalize e-rentals, underscoring technology’s role in customer acquisition.[3]Shurgard, “Company Presentation,” shurgard.com
Regional specialists like 24Storage AB expand through developer alliances; Kynningsrud is delivering its fifth project for the brand to meet suburban demand. Certification-heavy operators such as Storespeed differentiate on ESG performance via ISO 9001, ISO 14001 and ISO 27001 credentials, appealing to sustainability-minded renters.
Emerging disruptors deploy asset-light, on-demand models that bypass high-rent cores by collecting items off-site and managing inventory through mobile apps. M&A appetite remains robust; Access Self Storage’s GBP 1 billion auction attracted bids from Aermont Capital, TPG and Shurgard, highlighting capital’s keen eye on scalable European platforms.
Scandinavia Self-Storage Industry Leaders
Shurgard Self-Storage SA
Self Storage Group ASA
24Storage AB
Servistore Oy
Pelican Self-Storage ApS
- *Disclaimer: Major Players sorted in no particular order
Scandinavia Self-Storage Market Companies Covered in this Report
- Shurgard Self-Storage SA
- Self Storage Group ASA
- Pelican Self-Storage ApS
- 24Storage AB
- City Self-Storage AS
- Green Storage AB
- Sesam Self-Storage AB
- Servistore Oy
- YourSpace Storage AB
- Solo Minilager AS
- Lagersjefen AS
- Storage365 ApS
- Bear Storage Oy
- StorageCo AS
- CityBox AS
- Grenland Minilager AS
- 123Minilager AS
- Lagerboks AS
- Magasinera AB
- Your and Box AB

Market Opportunities and Future Outlook
A clear whitespace in Scandinavia is the expansion of fully digital, unmanned facilities into secondary towns and suburban nodes where zoned urban land is scarce, but customer expectations for self-service are high. February 2026 activity in Denmark illustrates this approach: Opbevaring.nu opened a 100% automated facility in Hvalso using Sharefox management software and MitID-based verification, demonstrating how national eID rails can reduce onboarding friction through to access. Similar models can be adapted for operators looking to enter infill locations without staffing-heavy operations, using standardized access control, remote monitoring, and digital contracts.
Another opportunity involves conversion-led supply creation and modular capacity additions that shorten time-to-market versus greenfield builds, particularly where planning constraints and heritage requirements increase development friction. The March 2026 Swedish VAT clarification on non-permanent container-based storage also encourages operators to be more deliberate about modular formats, pricing, and leasing structures when deploying removable units. Demand-side pull from e-commerce returns handling and SME inventory buffering supports offerings that combine small-unit availability with loading convenience, parcel integrations, and month-to-month business terms. ESG-driven differentiation continues through climate-controlled premiums, smart HVAC, and recognizable operating standards.
Recent Industry Developments in Scandinavia Self-Storage Market
- May 2026: Pelican Self Storage completed the acquisition of a property at Roskildevej 398 in Rodovre (Copenhagen) and communicated plans to convert vacant areas into a self-storage facility targeted to open in spring 2027. The acquisition strengthens a conversion-led pipeline in a supply-constrained urban area and reflects a preference for buying existing assets to accelerate market entry versus greenfield development.
- April 2026: Self Storage Group ASA consolidated its Norwegian operations under the Green Storage brand and outlined a program to roll out digital lock systems across its Nordic portfolio by the end of 2026. Brand unification, alongside access-control standardization, is designed to lower-cost remote operations and keep a more consistent customer journey across sites.
- May 2025: Shurgard acquired a multi-story self-storage facility in Cologne, Germany, adding 34,444 sq ft and 487 units, with a phase-two expansion plan to 66,736 sq ft. Although outside Scandinavia, the transaction highlights continued consolidation capacity by a leading operator with Nordic clusters, reinforcing competitive pressure and spillover effects in adjacent European markets.


Scandinavia Self-Storage Market Report Scope and Research Methodology
Market Definition and Coverage
We define the Scandinavia self storage market as purpose built and professionally operated self storage space supplied to end users, measured on a facility space basis across Sweden, Norway, and Denmark.
Scope exclusions: We exclude informal storage (garages and private basements), pure warehousing, and moving or transport services that are billed separately.
Segments Covered in This Report
- By End-User
- Personal
- Business
- By Storage Size
- Small and Medium Units (less than 40 sq ft)
- Large Units (above 40 sq ft)
- Others (Lockers/Double-Stacked)
- By Storage Type
- Climate-Controlled
- Non-Climate-Controlled
- By Ownership Pattern
- Owned Facilities
- Leased Facilities
Data Sources, Market Sizing, and Validation
Desk Research
Desk work started with mapping supply and demand signals that can be checked publicly, then aligning them to the market boundary used in this report. We mainly use official statistics for housing and mobility patterns, and we pair that with sector references on total self storage area, occupancy, and typical rent levels.
Sources used include public releases from national statistics agencies in Sweden, Norway, and Denmark (housing stock, household size, migration), Eurostat for macro and construction indicators, and planning or building permit portals where available to sanity check new capacity. We also reviewed industry association publications such as the FEDESSA European Industry Report for area, occupancy, and rent benchmarks, plus company filings, investor presentations, and reputable press coverage to understand expansion pipelines and pricing direction. In selected cases, we used paid subscription databases for company financials, and another paid subscription database for shipment level import or export checks on building materials as a loose proxy for construction activity. This list is illustrative, and many other public sources were reviewed for data collection, validation, and clarification.
Primary Interviews and Surveys
We interview operators, property specialists, and channel participants active in Denmark, Norway, and Sweden to test occupancy, rent movement, customer demand, new-store timing, and independent-facility coverage. Responses help validate secondary findings, fill gaps, and adjust assumptions before the final Scandinavia analysis.
Distribution of primary research fieldwork respondents
| Company type | Respondent position |
|---|---|
| Top tier: 30% | CXOs: 15% |
| Mid tier: 45% | Functional/Unit leaders: 30% |
| Smaller Players: 25% | Managers: 55% |
Market-Sizing & Forecasting
Sizing was built using top-down and bottom-up logic, with the main build starting from the region's self storage area base and then reconstructing demand through leased area and pricing. In practice, total rentable space was aligned to country level supply indicators, which were then filtered through occupancy to convert supply into occupied space, followed by an average rent per square foot to translate it into market value.
Key inputs used in the model include total gross self storage area by country, occupancy levels, rent per square foot trends, the pace of new facility openings or expansions, and household level drivers such as moving rates and urban apartment size pressure. Where local rent data differed by city and operator type, ranges were set from interviews and then applied conservatively based on the share of space in major metro areas. To corroborate totals, we also ran selective bottom-up checks using sampled facilities (advertised rents, unit size mix, and typical discounts) and then scaled these checks to known supply clusters to make sure the implied revenue per square foot was realistic.
Forecasting was carried out using scenario analysis supported by variable level expectations from primary respondents, especially around new capacity delivery timing, occupancy normalization, and rent resets on renewals. When a facility pipeline could not be confirmed cleanly, gap handling was done by applying country specific historical build rates and then stress testing against planning activity and announced projects before finalizing growth.
Data Validation & Update Cycle
Model outputs were tested against independent signals, including implied revenue per square foot, occupancy bands reported in the sector, and whether country splits align with observed supply concentration. Variances were reviewed step by step, and when a figure looked off, the underlying driver was rechecked first (area, occupancy, or rent) before the total was changed.
A second analyst review is completed prior to sign off, and larger deviations trigger re-contact with sources to confirm whether pricing, discounting, or utilization changed recently. Reports are refreshed annually, and interim updates are made when material events occur, such as major facility transactions, unusual vacancy moves, or sharp inflation led rent changes. Before delivery, we perform a fresh pass so clients receive the most current view supported by the latest public releases and expert feedback.
Mordor Intelligence's Scandinavia Self Storage Market Size Versus Other Published Estimates
Published numbers for this market can look far apart because the study unit is not always the same, and even small changes in area, occupancy, or rent assumptions can shift the total quickly. Differences also show up when one source reports capacity in square feet and another reports revenue, or when countries inside Scandinavia are not consistently included.
The benchmark table shows how much the final total moves when the model is built on facility area and utilization, and then converted to value using rent per square foot, under Mordor Intelligence's scope that treats Scandinavia as Sweden, Norway, and Denmark only, with informal storage and moving services excluded from the revenue pool.
Benchmark comparison
| Source | Market Size | Gaps in Research Methodology |
|---|---|---|
| Mordor Intelligence | USD 0.60 B (2026) | |
| Regional Consultancy A | USD 1.60 B (2024) | Uses a broader Nordic definition that typically adds Finland, and it appears to blend self storage with adjacent rented space categories, which inflates the billable area base. |
| Trade Journal B | USD 0.48 B (2025) | Applies a conservative rent level and a fixed occupancy assumption across countries, and it does not clearly normalize discounts and promotional pricing that affect realized revenue per square foot. |
The spread across sources is mainly explained by geography coverage, how billable area is defined, and the rent and occupancy paths assumed for the same space base. By keeping the steps visible (area, occupancy, realized rent, and currency timing), the estimate stays traceable and can be rechecked when new supply or pricing evidence emerges.


Key Questions Answered in the Report
How big is the Scandinavia self-storage market in 2026?
The Scandinavia self-storage market size stands at 24.56 million sq ft in 2026 and is projected to reach 34.09 million sq ft by 2031.
What is the growth rate for self-storage facilities in Scandinavia?
The sector is forecast to expand at a 6.78% CAGR between 2026-2031, driven by urban density, e-commerce and institutional investment.
Which customer segment dominates Nordic self-storage demand?
Personal users lead with 74.10% revenue share due to small apartments and frequent housing moves in major cities.
Why are climate-controlled units gaining traction in the Nordics?
Harsh winters, high heat-pump adoption and rising demand for secure storage of electronics and documents are fueling 7.71% CAGR growth for climate-controlled facilities through 2031.
Which cities offer the most attractive expansion opportunities?
Stockholm, Oslo and Copenhagen remain priority markets thanks to dense populations, high housing costs and supportive digital infrastructure.
Page last updated on:


 Your data is secure and never sold or shared.


